SlideShare una empresa de Scribd logo
1 de 15
Descargar para leer sin conexión
Synopsis – Grade 9 Math Term II


Chapter 4: Linear Equations in Two Variables

 An equation of the form, ax + by + c = 0, where a, b, and c are real numbers, such that a and
  b are both not zero, is called a linear equation in two variables.
  For example, 2x + 3y + 10 = 0, 3x + 7y = 0
   Equations of the form, ax + b = 0 or cy + d = 0, are also examples of linear equations in
      two variables since they can be written as ax +0. y + b = 0 or 0.x + cy + d = 0
      respectively.
 Solution of a linear equation in two variables
  A solution of a linear equation represents a pair of values, one for x and one for y which
  satisfy the given equation.
   Linear equation in one variable has a unique solution.
   Linear equation in two variables has infinitely many solutions.
 Geometrical representation of a linear equation in two variables
   The geometrical representation of the equation, ax + by + c = 0, is a straight line.

       For example: the equation x + 3y = 6 can be represented on a graph paper as follows:


   An equation of the form, y = mx, represents a line passing through the origin.
   Every point on the graph of a linear equation in two variables is a solution of the linear
    equation. Every solution of the linear equation is a point on the graph of the linear
    equation.
 Equation of lines parallel to the x-axis and y-axis
   The graph of x = a is a straight line parallel to the y-axis.
   The graph of y = b is a straight line parallel to the x-axis.


Chapter 8: Quadrilaterals

 The sum of all the interior angles of a quadrilateral is 360°.
  In the following quadrilateral ABCD, A + B + C + D = 360°.


 Classification of quadrilaterals


 Classification of parallelograms


 Diagonals of a parallelogram divide it into two congruent triangles.


   If ABCD is a parallelogram, then ABC  CDA
 In a parallelogram,
   opposite sides are parallel and equal
   opposite angles are equal
   adjacent angles are supplementary
 diagonals bisect each other
 A quadrilateral is a parallelogram, if
   each pair of opposite sides is equal
   each pair of opposite angles is equal
   diagonals bisect each other
   a pair of opposite sides is equal and parallel
 Properties of some special parallelograms
   Diagonals of a rectangle are equal and bisect each other.
   Diagonals of a rhombus bisect each other at right angles.
   Diagonals of a square are equal and bisect each other at right angles.
 Mid-point theorem and its converse
   Mid-point theorem
     The line segment joining the mid-point of any two sides of a triangle is parallel to the
     third side and is half of it.


       In ABC, if D and E are the mid-points of sides AB and AC respectively, then by the
                                             BC
       mid-point theorem, DE||BC and DE         .
                                              2
      Converse of the mid-point theorem
       A line through the mid-point of one side of a triangle parallel to the other side bisects the
       third side.


       In the given figure, if AP = PB and PQ||BC, then PQ bisects AB i.e., Q is the mid-point
       of AC.

 The quadrilateral formed by joining the mid-points of the sides of a quadrilateral is a
  parallelogram.
Chapter 9: Areas of Parallelograms and Triangles

 Two congruent figures have equal areas, but the converse is not true.
 If a figure is formed by two non-overlapping regions A and B, then the area of the figure =
  Area (A) + Area (B).


 Two figures lie on the same base and between the same parallels if they have a common base
  and if the opposite vertex (or side) lies on a line parallel to the base.
  For example:


   In the first figure, parallelograms ABCE and ABDF lie on the same base AB and between the
   same parallels AB and CF.
   In the second figure, parallelogram ABCE and triangle ABD lie on the same base but they do
   not lie between the same parallels.

 Parallelograms on the same (or equal) base and between the same parallels are equal in area.
  Its converse is also true, i.e., parallelograms on the same base and having equal areas lie
  between the same parallels.
 The area of a parallelogram is the product of its base and the corresponding height.
 Areas of parallelogram and triangle on the same base
   If a parallelogram and a triangle lie on the same (or equal) base and between the same
      parallels, then the area of the triangle is half the area of the parallelogram.
   If a parallelogram and a triangle lie on the same base and the area of the triangle is half
      the area of the parallelogram, then the triangle and the parallelogram lie between the
      same parallels.
 Triangles on the same base and between the same parallels
   Triangles on the same base (or equal base) and between the same parallels are equal in
      area.
   Triangles having the same base and equal areas lie between the same parallels.
 The median of a triangle divides it into two congruent triangles.
Thus, a median of a triangle divides it into two triangles of equal area.

Chapter 10: Circles

 Two or more circles are said to be congruent if they have the same radii.
 Two or more circles are said to be concentric if their centre’s lie at the same point.
 Angle subtended by chords at the centre
   Chords that are equal in length subtend equal angles at the centre of the circle.
   Chords subtending equal angles at the centre of the circle are equal in length.
 Perpendicular from the centre to a chord
   The perpendicular from the centre of a circle to a chord bisects the chord.
   The line joining the centre of the circle to the mid-point of a chord is perpendicular to the
      chord.
   Perpendicular bisector of a chord always passes through the centre of the circle.
 At least three points are required to construct a unique circle.
 Equal chords and their distances from the centre
   Equal chords of a circle (or congruent circles) are equidistant from the centre.
   Chords which are equidistant from the centre of a circle are equal in length.
 Angle subtended by an arc of a circle
   Two or more chords are equal if and only if the corresponding arcs are congruent.
   The angle subtended by an arc at the centre of the circle is double the angle subtended by
      the arc at the remaining part of the circle.
      For example:


       Here, AXB is the angle subtended by arc AB at the remaining part of the circle.
       AOB = 2  AXB
                    1
        AXB   30  15
                    2
      Angles in the same segment of a circle are equal.
PRQ and PSQ lie in the same segment of a circle.
    PRQ = PSQ
   Angle in a semicircle is a right angle.
 Concyclic points
   A set of points that lie on a common circle are known as concyclic points.


       Here, A, B, D, and E are concyclic points.
      If a line segment joining two points subtends equal angles at the two points lying on the
       same side of the line segment, then the four points are concyclic.
       For example:


       Here, if ACB = ADB, then points A, B, C, and D are concyclic.

 Cyclic quadrilaterals
   A cyclic quadrilateral is a quadrilateral if all four vertices of the quadrilateral lie on a
     circle.


       Here, ABCD is a cyclic quadrilateral.
 The sum of each pair of opposite angles of a cyclic quadrilateral is 180.
    If the sum of a pair of opposite angles of a quadrilateral is 180, then the quadrilateral is
     cyclic.
 The quadrilateral formed by the angle bisectors of interior angles of any quadrilateral is a
  cyclic quadrilateral.
 Non-parallel sides of a cyclic trapezium are equal in length.


Chapter 11: Constructions

 When the base, base angle, and the sum of other two sides of a triangle are given, the
  triangle can be constructed as follows.
  Let us suppose base BC, B, and (AB + AC) are given.
  Steps of construction:
  (1) Draw BC and make an angle, B, at point B.
  (2) Draw an arc on BX, which cuts it at point P, such that BP (= AB + AC).
  (3) Join PC and draw its perpendicular bisector. Let this perpendicular bisector intersect BP
      at A.


  Thus, ABC is the required triangle.
 When the base, base angle, and the difference between the other two sides of the
  triangle are given, the triangle can be constructed as follows.
  Let us suppose base BC, B, and (AB – AC) are given.
  Steps of construction:
  (1) Draw BC and make an angle, B, at point B.
  (2) Draw an arc on BX, which cuts it at point P, such that BP (= AB – AC).
  (3) Join PC and draw its perpendicular bisector. Let this perpendicular bisector intersect BX
      at point A. Join AC.
Thus, ABC is the required triangle.
 When the base BC, B, and (AC – AB) are given, the triangle can be constructed as
  follows:
  (1) Draw base BC and B.
  (2) Draw an arc, which cuts extended BX on opposite side of BC at point Q, such that
      BQ = (AC – AB).
  (3) Join QC and draw its perpendicular bisector. Let this perpendicular bisector intersect BX
      at point A. Join AC.


  Thus, ABC is the required triangle.
 When the perimeter and two base angles of the triangle are given, the triangle can be
  constructed as follows.
  Let us suppose that base angle, B, and C of  ABC are given.
  Steps of construction:
  (1) Draw a line segment PQ of length equal to the perimeter of the triangle and draw the base
      angles at points P and Q.
  (2) Draw the angle bisectors of P and Q. Let these angle bisectors intersect each other at
      point A.
  (3) Draw the perpendicular bisectors of AP and AQ. Let these perpendicular bisectors
      intersect PQ at points B and C respectively. Join AB and AC.
Thus, ABC is the required triangle.


Chapter 13: Surface Areas and Volumes

 Cuboid
  Consider a cuboid with dimensions l, b and h.


      Lateral surface area = 2h(l + b)
      Total surface area = 2(lb + bh + hl)
      Volume = l × b × h

 Cube
  Consider a cube with edge length a.


      Lateral surface area = 4a2
      Total surface area = 6a2
      Volume = a3

 Right circular cylinder
  Consider a right circular cylinder with height h and radius r.
   Curved surface area = 2πrh
      Total surface area = 2πr (h + r)
      Volume = πr2h

 Right circular cone
  Consider a right circular cone of height h, slant height l and base radius r.


    Slant height, l  h2  r 2
    Curved surface area = πrl
    Total surface area = πr (l + r)
                1
   Volume = πr 2 h
                3
 Sphere
  Consider a sphere of radius r.


      Curved surface area = Total surface area = 4πr2
                 4
      Volume  πr 3
                 3
 Hemisphere
  Consider a hemisphere of radius r.


      Curved surface area = 2πr2
      Total surface area = 3πr2
                  2
      Volume  πr 3
                  3


Chapter 14: Statistics

 The marks of 20 students of a school are as follows.
  86 49     52      78     46      54
  62 71     92      87     84      45
  58 52     50      60     77      85
  88 63

   The above data can be written in the form of class intervals as follows.

                Marks               Number of students
                40 – 50                    3
                50 – 60                    5
                 60 –70                    3
                70 – 80                    3
                 80 –90                    5
                90 –100                    1

   This table is called grouped frequency distribution table.
   40 – 50, 50 – 60, etc. are class intervals.
   40 is the lower limit and 50 is the upper limit of class interval 40 – 50.
   The number of students for each class interval is the frequency of that class interval.
 Exclusive frequency distribution table
  The frequency distribution tables in which the upper limit of any class interval coincides with
  the lower limit of the next class interval are known as exclusive frequency distribution tables.
 Inclusive frequency distribution table
  Consider the following table.

            Class interval              Frequency
               10 – 19                      2
               20 –29                       7
               30 – 39                      4
               40 – 49                      1

   Here, the upper limit of any class interval does not coincide with the lower class limit of next
   class interval. Such frequency distribution table is known as inclusive frequency distribution
   table.
                                                            20  19 1
   It can be converted into exclusive table by subtracting           0.5 from the upper limit
                                                               2      2
   and lower limit of each class interval as follows.

             Class interval             Class interval               Frequency
         (10 – 0.5) – (19 + 0.5)          9.5 –19.5                      2
         (20 – 0.5) – (29 + 0.5)         19.5 – 29.5                     7
         (30 – 0.5) – (39 + 0.5)         29.5 –39.5                      4
         (40 – 0.5) – (49 + 0.5)         39.5 – 49.5                     1

 A histogram is a graphical representation of data.

   Example: Represent the given data in the form of a histogram.

                   Height (in cm)          Number of students
                     140 – 150                    10
                     150 – 160                     6
                     160 – 170                    15
                     170 –180                      4

   Solution:
   For this data, histogram can be drawn by taking class intervals along x-axis and frequency
   along y-axis and then drawing bars parallel to y-axis.
   The histogram for this data is as follows.
 If the class intervals are not of uniform width, then in the histogram, the length of bars is
  equal to adjusted frequencies. For example, consider the following data.

                      Class interval              Frequency
                          0 – 10                      1
                         10 – 20                      5
                         20 – 40                      8
                         40 –70                       6

   Here, minimum class size is 10.
                                                    Frequency
   The adjusted frequencies can be calculated by,               × Minimum class size
                                                    Class width

   Therefore, we obtain the table as:

            Class interval              Frequency            Adjusted frequency
                                                                  1
                0 – 10                        1                     10  1
                                                                 10
                                                                  5
               10 – 20                        5                     10  5
                                                                 10
                                                                  8
               20 – 40                        8                     10  4
                                                                 20
                                                                  6
               40 – 70                        6                     10  2
                                                                 30

   The histogram can be drawn by taking class intervals on x-axis and adjusted frequencies on
   y-axis.
 The frequency polygon for a grouped data is drawn by first drawing its histogram and then
  by joining the mid-points of the top of bars. For example, the frequency polygon for the data
  given in the previous table can be drawn as follows.


   ABCDEF is the required frequency polygon.

 Measures of central tendency
  Mean, median, and mode are the measures of central tendency.
   Mean: Mean is defined by,

     Mean x     Sum of all observations
                                              
                                                 fi xi
                 Total number of observations     fi
      Median: To find the median, the observations are arranged in ascending or descending
       order.
                                                                      n  1
                                                                                th

       (i) If the number of observations (n) is odd, then value of                   observation is the
                                                                        2
           median.

       (ii) If the number of observations (n) is even, then the mean of the values of


           n
                 th             th
                          n 
                      and   1 observations is the median.
            2             2 

      Mode: The value of the observation that occurs most frequently is called mode. Mode is
       the value of observation whose frequency is maximum.

Chapter 15: Probability

 Experiment: An experiment is a situation involving chance or probability.
  For example, tossing a coin is an experiment.
 Outcome: An outcome is the result of an experiment.
  For example, getting a head on tossing a coin is an outcome.
 Sample space: The set of all possible outcomes of an experiment is called sample space.
  The sample space of the experiment of throwing a die is {1, 2, 3, 4, 5, 6}.
 Event: An event is the set of one or more outcomes of an experiment.
  For example, in the experiment of throwing a die, the event of getting an even number is {2,
  4, 6}.
 Probability: The empirical (or experimental) probability of an event A is given by
           Number of favorable outcomes
  P  A 
            Total number of outcomes

  Example: When a coin is tossed 500 times and on the upper face of the coin tail comes up
  280 times, what is the probability of getting head on the upper face of the coin?
  Solution: Let A be the event of getting head on the upper face of the coin.
  Total number of trials = 500
  Number of trials in which tail comes up = 280
  Number of trials in which head comes up = 500 – 280 = 220
            220 11
  P A        
            500 25
 The probability of an event always lies between 0 and 1.

Más contenido relacionado

La actualidad más candente

Proportionality theorem and its converse
Proportionality theorem and its converseProportionality theorem and its converse
Proportionality theorem and its conversesrshrunga
 
Triangles For Class 10 CBSE NCERT
Triangles For Class 10 CBSE NCERTTriangles For Class 10 CBSE NCERT
Triangles For Class 10 CBSE NCERTLet's Tute
 
PPT ON TRIANGLES FOR CLASS X
PPT ON TRIANGLES FOR CLASS XPPT ON TRIANGLES FOR CLASS X
PPT ON TRIANGLES FOR CLASS XMiku09
 
maths ppt for class x chapter 6 theorm
maths ppt for class x chapter 6 theorm maths ppt for class x chapter 6 theorm
maths ppt for class x chapter 6 theorm Vishal Vj
 
Digit l textbook 131
Digit l textbook 131Digit l textbook 131
Digit l textbook 131SEV VARGHESE
 
Similar Triangles
Similar TrianglesSimilar Triangles
Similar TrianglesPassy World
 
Similarity of triangles -GEOMETRY
Similarity of triangles -GEOMETRYSimilarity of triangles -GEOMETRY
Similarity of triangles -GEOMETRYindianeducation
 
Maths ppt of class 9 CBSE topic Triangles
Maths ppt of class 9 CBSE topic TrianglesMaths ppt of class 9 CBSE topic Triangles
Maths ppt of class 9 CBSE topic TrianglesVishwas108
 
ppt on Triangles Class 9
ppt on Triangles Class 9 ppt on Triangles Class 9
ppt on Triangles Class 9 Gaurav Kumar
 
8.6 proportions and similar triangles
8.6 proportions and similar triangles8.6 proportions and similar triangles
8.6 proportions and similar triangleslothomas
 
Ppt on triangles class x made my jatin jangid
Ppt on triangles class x made my jatin jangidPpt on triangles class x made my jatin jangid
Ppt on triangles class x made my jatin jangidJatinJangid5
 
Triginometry
TriginometryTriginometry
TriginometryTGTMATH
 

La actualidad más candente (17)

Proportionality theorem and its converse
Proportionality theorem and its converseProportionality theorem and its converse
Proportionality theorem and its converse
 
Triangles For Class 10 CBSE NCERT
Triangles For Class 10 CBSE NCERTTriangles For Class 10 CBSE NCERT
Triangles For Class 10 CBSE NCERT
 
PPT ON TRIANGLES FOR CLASS X
PPT ON TRIANGLES FOR CLASS XPPT ON TRIANGLES FOR CLASS X
PPT ON TRIANGLES FOR CLASS X
 
maths ppt for class x chapter 6 theorm
maths ppt for class x chapter 6 theorm maths ppt for class x chapter 6 theorm
maths ppt for class x chapter 6 theorm
 
Digit l textbook 131
Digit l textbook 131Digit l textbook 131
Digit l textbook 131
 
Similar Triangles
Similar TrianglesSimilar Triangles
Similar Triangles
 
TRIANGLES
TRIANGLESTRIANGLES
TRIANGLES
 
Similarity of triangles -GEOMETRY
Similarity of triangles -GEOMETRYSimilarity of triangles -GEOMETRY
Similarity of triangles -GEOMETRY
 
Maths ppt of class 9 CBSE topic Triangles
Maths ppt of class 9 CBSE topic TrianglesMaths ppt of class 9 CBSE topic Triangles
Maths ppt of class 9 CBSE topic Triangles
 
Symmetry
SymmetrySymmetry
Symmetry
 
ppt on Triangles Class 9
ppt on Triangles Class 9 ppt on Triangles Class 9
ppt on Triangles Class 9
 
Priyanshu presentation
Priyanshu presentationPriyanshu presentation
Priyanshu presentation
 
point,line,ray
point,line,raypoint,line,ray
point,line,ray
 
8.6 proportions and similar triangles
8.6 proportions and similar triangles8.6 proportions and similar triangles
8.6 proportions and similar triangles
 
Ppt on triangles class x made my jatin jangid
Ppt on triangles class x made my jatin jangidPpt on triangles class x made my jatin jangid
Ppt on triangles class x made my jatin jangid
 
Triginometry
TriginometryTriginometry
Triginometry
 
Triangles
TrianglesTriangles
Triangles
 

Destacado

Introduction to coordinate_geometry_pdf
Introduction to coordinate_geometry_pdfIntroduction to coordinate_geometry_pdf
Introduction to coordinate_geometry_pdfAbdallahawesome
 
Presentationon coordinate axis
Presentationon coordinate axisPresentationon coordinate axis
Presentationon coordinate axisAbdallahawesome
 
Social scienceix07sept100
Social scienceix07sept100Social scienceix07sept100
Social scienceix07sept100Abdallahawesome
 
Q paper I puc-2014(MATHEMATICS)
Q paper I puc-2014(MATHEMATICS)Q paper I puc-2014(MATHEMATICS)
Q paper I puc-2014(MATHEMATICS)Bagalkot
 
Class 9 civics
Class 9 civicsClass 9 civics
Class 9 civicspratik8897
 

Destacado (8)

Introduction to coordinate_geometry_pdf
Introduction to coordinate_geometry_pdfIntroduction to coordinate_geometry_pdf
Introduction to coordinate_geometry_pdf
 
Presentationon coordinate axis
Presentationon coordinate axisPresentationon coordinate axis
Presentationon coordinate axis
 
Maths sa 1 synopsis
Maths sa 1 synopsisMaths sa 1 synopsis
Maths sa 1 synopsis
 
Poetic devices
Poetic devicesPoetic devices
Poetic devices
 
Social scienceix07sept100
Social scienceix07sept100Social scienceix07sept100
Social scienceix07sept100
 
Three men on_a_boat
Three men on_a_boatThree men on_a_boat
Three men on_a_boat
 
Q paper I puc-2014(MATHEMATICS)
Q paper I puc-2014(MATHEMATICS)Q paper I puc-2014(MATHEMATICS)
Q paper I puc-2014(MATHEMATICS)
 
Class 9 civics
Class 9 civicsClass 9 civics
Class 9 civics
 

Similar a Maths sa 2 synopsis

Drawing some kinds of line in triangle
Drawing some kinds of line in triangleDrawing some kinds of line in triangle
Drawing some kinds of line in trianglePamujiarso Wibowo
 
C2.0 Triangles
C2.0 TrianglesC2.0 Triangles
C2.0 Trianglesrey castro
 
DIGITAL TEXT BOOK
DIGITAL TEXT BOOKDIGITAL TEXT BOOK
DIGITAL TEXT BOOKantonyge68
 
Triangles and it's properties
Triangles and it's propertiesTriangles and it's properties
Triangles and it's propertiesminhajnoushad
 
Triangles and its all types
Triangles and its all typesTriangles and its all types
Triangles and its all typesmirabubakar1
 
Geometry theorem triangles and Circles
Geometry theorem triangles and CirclesGeometry theorem triangles and Circles
Geometry theorem triangles and CirclesReshmaurfaculty
 
TRIANGLE CONGRUENCE, SSS, ASA, SAS and AAS
TRIANGLE CONGRUENCE, SSS, ASA, SAS and AASTRIANGLE CONGRUENCE, SSS, ASA, SAS and AAS
TRIANGLE CONGRUENCE, SSS, ASA, SAS and AASMarkChristianBalaald
 
Ch 6 TRIANGLES Ex 6.4
Ch 6 TRIANGLES Ex 6.4Ch 6 TRIANGLES Ex 6.4
Ch 6 TRIANGLES Ex 6.4Rashmi Taneja
 
class-9-math-triangles_1595671835220.pdf
class-9-math-triangles_1595671835220.pdfclass-9-math-triangles_1595671835220.pdf
class-9-math-triangles_1595671835220.pdfsuhaskatragadda28
 
Geometry of shapes sGeometry of shapes s
Geometry of shapes sGeometry of shapes sGeometry of shapes sGeometry of shapes s
Geometry of shapes sGeometry of shapes spisopay00
 
Lines and angles
Lines and anglesLines and angles
Lines and anglesAlish Mahat
 
Geom 5point1and2
Geom 5point1and2Geom 5point1and2
Geom 5point1and2herbison
 
Angle for class VI & VII
Angle for class VI & VIIAngle for class VI & VII
Angle for class VI & VIIMD. G R Ahmed
 

Similar a Maths sa 2 synopsis (20)

C1 g9-s1-t7-2
C1 g9-s1-t7-2C1 g9-s1-t7-2
C1 g9-s1-t7-2
 
Drawing some kinds of line in triangle
Drawing some kinds of line in triangleDrawing some kinds of line in triangle
Drawing some kinds of line in triangle
 
C2.0 Triangles
C2.0 TrianglesC2.0 Triangles
C2.0 Triangles
 
Ankit1
Ankit1Ankit1
Ankit1
 
DIGITAL TEXT BOOK
DIGITAL TEXT BOOKDIGITAL TEXT BOOK
DIGITAL TEXT BOOK
 
Triangles and it's properties
Triangles and it's propertiesTriangles and it's properties
Triangles and it's properties
 
Triangles and its all types
Triangles and its all typesTriangles and its all types
Triangles and its all types
 
Geometry theorem triangles and Circles
Geometry theorem triangles and CirclesGeometry theorem triangles and Circles
Geometry theorem triangles and Circles
 
TRIANGLE CONGRUENCE, SSS, ASA, SAS and AAS
TRIANGLE CONGRUENCE, SSS, ASA, SAS and AASTRIANGLE CONGRUENCE, SSS, ASA, SAS and AAS
TRIANGLE CONGRUENCE, SSS, ASA, SAS and AAS
 
Triangles
TrianglesTriangles
Triangles
 
Ch 6 TRIANGLES Ex 6.4
Ch 6 TRIANGLES Ex 6.4Ch 6 TRIANGLES Ex 6.4
Ch 6 TRIANGLES Ex 6.4
 
class-9-math-triangles_1595671835220.pdf
class-9-math-triangles_1595671835220.pdfclass-9-math-triangles_1595671835220.pdf
class-9-math-triangles_1595671835220.pdf
 
Chapter activity plus-in-mathematics-10
Chapter activity plus-in-mathematics-10Chapter activity plus-in-mathematics-10
Chapter activity plus-in-mathematics-10
 
Shivam goyal ix e
Shivam goyal ix eShivam goyal ix e
Shivam goyal ix e
 
Geometry proofs
Geometry proofsGeometry proofs
Geometry proofs
 
Modern Geometry Topics
Modern Geometry TopicsModern Geometry Topics
Modern Geometry Topics
 
Geometry of shapes sGeometry of shapes s
Geometry of shapes sGeometry of shapes sGeometry of shapes sGeometry of shapes s
Geometry of shapes sGeometry of shapes s
 
Lines and angles
Lines and anglesLines and angles
Lines and angles
 
Geom 5point1and2
Geom 5point1and2Geom 5point1and2
Geom 5point1and2
 
Angle for class VI & VII
Angle for class VI & VIIAngle for class VI & VII
Angle for class VI & VII
 

Más de Abdallahawesome

Introduction to coordinate_geometry_pdf
Introduction to coordinate_geometry_pdfIntroduction to coordinate_geometry_pdf
Introduction to coordinate_geometry_pdfAbdallahawesome
 
Jeromek jerome-120514192414-phpapp01 (1)
Jeromek jerome-120514192414-phpapp01 (1)Jeromek jerome-120514192414-phpapp01 (1)
Jeromek jerome-120514192414-phpapp01 (1)Abdallahawesome
 

Más de Abdallahawesome (6)

How to write_a_story
How to write_a_storyHow to write_a_story
How to write_a_story
 
Hots a necessity
Hots a necessityHots a necessity
Hots a necessity
 
Introduction to coordinate_geometry_pdf
Introduction to coordinate_geometry_pdfIntroduction to coordinate_geometry_pdf
Introduction to coordinate_geometry_pdf
 
Science sa 2 synopsis
Science sa 2 synopsisScience sa 2 synopsis
Science sa 2 synopsis
 
Speech writing
Speech writingSpeech writing
Speech writing
 
Jeromek jerome-120514192414-phpapp01 (1)
Jeromek jerome-120514192414-phpapp01 (1)Jeromek jerome-120514192414-phpapp01 (1)
Jeromek jerome-120514192414-phpapp01 (1)
 

Maths sa 2 synopsis

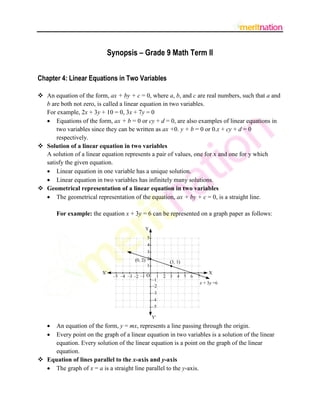
  • 1. Synopsis – Grade 9 Math Term II Chapter 4: Linear Equations in Two Variables  An equation of the form, ax + by + c = 0, where a, b, and c are real numbers, such that a and b are both not zero, is called a linear equation in two variables. For example, 2x + 3y + 10 = 0, 3x + 7y = 0  Equations of the form, ax + b = 0 or cy + d = 0, are also examples of linear equations in two variables since they can be written as ax +0. y + b = 0 or 0.x + cy + d = 0 respectively.  Solution of a linear equation in two variables A solution of a linear equation represents a pair of values, one for x and one for y which satisfy the given equation.  Linear equation in one variable has a unique solution.  Linear equation in two variables has infinitely many solutions.  Geometrical representation of a linear equation in two variables  The geometrical representation of the equation, ax + by + c = 0, is a straight line. For example: the equation x + 3y = 6 can be represented on a graph paper as follows: An equation of the form, y = mx, represents a line passing through the origin. Every point on the graph of a linear equation in two variables is a solution of the linear equation. Every solution of the linear equation is a point on the graph of the linear equation.  Equation of lines parallel to the x-axis and y-axis  The graph of x = a is a straight line parallel to the y-axis.
  • 2. The graph of y = b is a straight line parallel to the x-axis. Chapter 8: Quadrilaterals  The sum of all the interior angles of a quadrilateral is 360°. In the following quadrilateral ABCD, A + B + C + D = 360°.  Classification of quadrilaterals  Classification of parallelograms  Diagonals of a parallelogram divide it into two congruent triangles. If ABCD is a parallelogram, then ABC  CDA  In a parallelogram,  opposite sides are parallel and equal  opposite angles are equal  adjacent angles are supplementary
  • 3.  diagonals bisect each other  A quadrilateral is a parallelogram, if  each pair of opposite sides is equal  each pair of opposite angles is equal  diagonals bisect each other  a pair of opposite sides is equal and parallel  Properties of some special parallelograms  Diagonals of a rectangle are equal and bisect each other.  Diagonals of a rhombus bisect each other at right angles.  Diagonals of a square are equal and bisect each other at right angles.  Mid-point theorem and its converse  Mid-point theorem The line segment joining the mid-point of any two sides of a triangle is parallel to the third side and is half of it. In ABC, if D and E are the mid-points of sides AB and AC respectively, then by the BC mid-point theorem, DE||BC and DE  . 2  Converse of the mid-point theorem A line through the mid-point of one side of a triangle parallel to the other side bisects the third side. In the given figure, if AP = PB and PQ||BC, then PQ bisects AB i.e., Q is the mid-point of AC.  The quadrilateral formed by joining the mid-points of the sides of a quadrilateral is a parallelogram.
  • 4. Chapter 9: Areas of Parallelograms and Triangles  Two congruent figures have equal areas, but the converse is not true.  If a figure is formed by two non-overlapping regions A and B, then the area of the figure = Area (A) + Area (B).  Two figures lie on the same base and between the same parallels if they have a common base and if the opposite vertex (or side) lies on a line parallel to the base. For example: In the first figure, parallelograms ABCE and ABDF lie on the same base AB and between the same parallels AB and CF. In the second figure, parallelogram ABCE and triangle ABD lie on the same base but they do not lie between the same parallels.  Parallelograms on the same (or equal) base and between the same parallels are equal in area. Its converse is also true, i.e., parallelograms on the same base and having equal areas lie between the same parallels.  The area of a parallelogram is the product of its base and the corresponding height.  Areas of parallelogram and triangle on the same base  If a parallelogram and a triangle lie on the same (or equal) base and between the same parallels, then the area of the triangle is half the area of the parallelogram.  If a parallelogram and a triangle lie on the same base and the area of the triangle is half the area of the parallelogram, then the triangle and the parallelogram lie between the same parallels.  Triangles on the same base and between the same parallels  Triangles on the same base (or equal base) and between the same parallels are equal in area.  Triangles having the same base and equal areas lie between the same parallels.  The median of a triangle divides it into two congruent triangles.
  • 5. Thus, a median of a triangle divides it into two triangles of equal area. Chapter 10: Circles  Two or more circles are said to be congruent if they have the same radii.  Two or more circles are said to be concentric if their centre’s lie at the same point.  Angle subtended by chords at the centre  Chords that are equal in length subtend equal angles at the centre of the circle.  Chords subtending equal angles at the centre of the circle are equal in length.  Perpendicular from the centre to a chord  The perpendicular from the centre of a circle to a chord bisects the chord.  The line joining the centre of the circle to the mid-point of a chord is perpendicular to the chord.  Perpendicular bisector of a chord always passes through the centre of the circle.  At least three points are required to construct a unique circle.  Equal chords and their distances from the centre  Equal chords of a circle (or congruent circles) are equidistant from the centre.  Chords which are equidistant from the centre of a circle are equal in length.  Angle subtended by an arc of a circle  Two or more chords are equal if and only if the corresponding arcs are congruent.  The angle subtended by an arc at the centre of the circle is double the angle subtended by the arc at the remaining part of the circle. For example: Here, AXB is the angle subtended by arc AB at the remaining part of the circle. AOB = 2  AXB 1  AXB   30  15 2  Angles in the same segment of a circle are equal.
  • 6. PRQ and PSQ lie in the same segment of a circle. PRQ = PSQ  Angle in a semicircle is a right angle.  Concyclic points  A set of points that lie on a common circle are known as concyclic points. Here, A, B, D, and E are concyclic points.  If a line segment joining two points subtends equal angles at the two points lying on the same side of the line segment, then the four points are concyclic. For example: Here, if ACB = ADB, then points A, B, C, and D are concyclic.  Cyclic quadrilaterals  A cyclic quadrilateral is a quadrilateral if all four vertices of the quadrilateral lie on a circle. Here, ABCD is a cyclic quadrilateral.
  • 7.  The sum of each pair of opposite angles of a cyclic quadrilateral is 180.  If the sum of a pair of opposite angles of a quadrilateral is 180, then the quadrilateral is cyclic.  The quadrilateral formed by the angle bisectors of interior angles of any quadrilateral is a cyclic quadrilateral.  Non-parallel sides of a cyclic trapezium are equal in length. Chapter 11: Constructions  When the base, base angle, and the sum of other two sides of a triangle are given, the triangle can be constructed as follows. Let us suppose base BC, B, and (AB + AC) are given. Steps of construction: (1) Draw BC and make an angle, B, at point B. (2) Draw an arc on BX, which cuts it at point P, such that BP (= AB + AC). (3) Join PC and draw its perpendicular bisector. Let this perpendicular bisector intersect BP at A. Thus, ABC is the required triangle.  When the base, base angle, and the difference between the other two sides of the triangle are given, the triangle can be constructed as follows. Let us suppose base BC, B, and (AB – AC) are given. Steps of construction: (1) Draw BC and make an angle, B, at point B. (2) Draw an arc on BX, which cuts it at point P, such that BP (= AB – AC). (3) Join PC and draw its perpendicular bisector. Let this perpendicular bisector intersect BX at point A. Join AC.
  • 8. Thus, ABC is the required triangle.  When the base BC, B, and (AC – AB) are given, the triangle can be constructed as follows: (1) Draw base BC and B. (2) Draw an arc, which cuts extended BX on opposite side of BC at point Q, such that BQ = (AC – AB). (3) Join QC and draw its perpendicular bisector. Let this perpendicular bisector intersect BX at point A. Join AC. Thus, ABC is the required triangle.  When the perimeter and two base angles of the triangle are given, the triangle can be constructed as follows. Let us suppose that base angle, B, and C of  ABC are given. Steps of construction: (1) Draw a line segment PQ of length equal to the perimeter of the triangle and draw the base angles at points P and Q. (2) Draw the angle bisectors of P and Q. Let these angle bisectors intersect each other at point A. (3) Draw the perpendicular bisectors of AP and AQ. Let these perpendicular bisectors intersect PQ at points B and C respectively. Join AB and AC.
  • 9. Thus, ABC is the required triangle. Chapter 13: Surface Areas and Volumes  Cuboid Consider a cuboid with dimensions l, b and h.  Lateral surface area = 2h(l + b)  Total surface area = 2(lb + bh + hl)  Volume = l × b × h  Cube Consider a cube with edge length a.  Lateral surface area = 4a2  Total surface area = 6a2  Volume = a3  Right circular cylinder Consider a right circular cylinder with height h and radius r.
  • 10. Curved surface area = 2πrh  Total surface area = 2πr (h + r)  Volume = πr2h  Right circular cone Consider a right circular cone of height h, slant height l and base radius r.  Slant height, l  h2  r 2  Curved surface area = πrl  Total surface area = πr (l + r) 1  Volume = πr 2 h 3  Sphere Consider a sphere of radius r.  Curved surface area = Total surface area = 4πr2 4  Volume  πr 3 3
  • 11.  Hemisphere Consider a hemisphere of radius r.  Curved surface area = 2πr2  Total surface area = 3πr2 2  Volume  πr 3 3 Chapter 14: Statistics  The marks of 20 students of a school are as follows. 86 49 52 78 46 54 62 71 92 87 84 45 58 52 50 60 77 85 88 63 The above data can be written in the form of class intervals as follows. Marks Number of students 40 – 50 3 50 – 60 5 60 –70 3 70 – 80 3 80 –90 5 90 –100 1  This table is called grouped frequency distribution table.  40 – 50, 50 – 60, etc. are class intervals.  40 is the lower limit and 50 is the upper limit of class interval 40 – 50.  The number of students for each class interval is the frequency of that class interval.  Exclusive frequency distribution table The frequency distribution tables in which the upper limit of any class interval coincides with the lower limit of the next class interval are known as exclusive frequency distribution tables.
  • 12.  Inclusive frequency distribution table Consider the following table. Class interval Frequency 10 – 19 2 20 –29 7 30 – 39 4 40 – 49 1 Here, the upper limit of any class interval does not coincide with the lower class limit of next class interval. Such frequency distribution table is known as inclusive frequency distribution table. 20  19 1 It can be converted into exclusive table by subtracting   0.5 from the upper limit 2 2 and lower limit of each class interval as follows. Class interval Class interval Frequency (10 – 0.5) – (19 + 0.5) 9.5 –19.5 2 (20 – 0.5) – (29 + 0.5) 19.5 – 29.5 7 (30 – 0.5) – (39 + 0.5) 29.5 –39.5 4 (40 – 0.5) – (49 + 0.5) 39.5 – 49.5 1  A histogram is a graphical representation of data. Example: Represent the given data in the form of a histogram. Height (in cm) Number of students 140 – 150 10 150 – 160 6 160 – 170 15 170 –180 4 Solution: For this data, histogram can be drawn by taking class intervals along x-axis and frequency along y-axis and then drawing bars parallel to y-axis. The histogram for this data is as follows.
  • 13.  If the class intervals are not of uniform width, then in the histogram, the length of bars is equal to adjusted frequencies. For example, consider the following data. Class interval Frequency 0 – 10 1 10 – 20 5 20 – 40 8 40 –70 6 Here, minimum class size is 10. Frequency The adjusted frequencies can be calculated by, × Minimum class size Class width Therefore, we obtain the table as: Class interval Frequency Adjusted frequency 1 0 – 10 1 10  1 10 5 10 – 20 5 10  5 10 8 20 – 40 8 10  4 20 6 40 – 70 6 10  2 30 The histogram can be drawn by taking class intervals on x-axis and adjusted frequencies on y-axis.
  • 14.  The frequency polygon for a grouped data is drawn by first drawing its histogram and then by joining the mid-points of the top of bars. For example, the frequency polygon for the data given in the previous table can be drawn as follows. ABCDEF is the required frequency polygon.  Measures of central tendency Mean, median, and mode are the measures of central tendency.  Mean: Mean is defined by, Mean x   Sum of all observations   fi xi Total number of observations  fi  Median: To find the median, the observations are arranged in ascending or descending order.  n  1 th (i) If the number of observations (n) is odd, then value of observation is the 2 median. (ii) If the number of observations (n) is even, then the mean of the values of n th th n  and   1 observations is the median. 2 2   Mode: The value of the observation that occurs most frequently is called mode. Mode is the value of observation whose frequency is maximum. Chapter 15: Probability  Experiment: An experiment is a situation involving chance or probability. For example, tossing a coin is an experiment.
  • 15.  Outcome: An outcome is the result of an experiment. For example, getting a head on tossing a coin is an outcome.  Sample space: The set of all possible outcomes of an experiment is called sample space. The sample space of the experiment of throwing a die is {1, 2, 3, 4, 5, 6}.  Event: An event is the set of one or more outcomes of an experiment. For example, in the experiment of throwing a die, the event of getting an even number is {2, 4, 6}.  Probability: The empirical (or experimental) probability of an event A is given by Number of favorable outcomes P  A  Total number of outcomes Example: When a coin is tossed 500 times and on the upper face of the coin tail comes up 280 times, what is the probability of getting head on the upper face of the coin? Solution: Let A be the event of getting head on the upper face of the coin. Total number of trials = 500 Number of trials in which tail comes up = 280 Number of trials in which head comes up = 500 – 280 = 220 220 11 P A   500 25  The probability of an event always lies between 0 and 1.