
Recomendados
Recomendados
Más contenido relacionado
Último
Último (20)
Destacado
Destacado (20)
Restaurant Booking Apps India - Consumer Preference
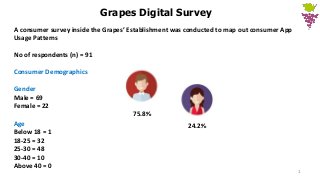
- 1. A consumer survey inside the Grapes’ Establishment was conducted to map out consumer App Usage Patterns No of respondents (n) = 91 Consumer Demographics Gender Male = 69 Female = 22 Age Below 18 = 1 18-25 = 32 25-30 = 48 30-40 = 10 Above 40 = 0 1 Grapes Digital Survey 24.2% 75.8%
- 2. 2 Which Apps do people prefer and how do they download them ? Restaurant & Casual Dining : Consumer Insights App Landscape App Discovery Sources Factors Influencing App Download
- 3. 3 RESTAURANT & CASUAL DINING : CONSUMER INSIGHTS
- 4. Consumer Dining Frequency Frequent restaurant visits evince bright prospects • 1 in every 3 respondent visits a Restaurant Weekly • 1 in every 3 respondents visits a Restaurant for dining every fortnight • Only around 10% of the people visit a restaurant once in 3 months GRAPES DIGITAL SURVEY Total Respondents (n = 91) Base Respondents for this Question (n = 91 ) Q3. How often do you go out for dining ?
- 5. GRAPES DIGITAL SURVEY Total Respondents (n = 91) Base Respondents for this Question (n = 91 ) Q5. What do you prioritize before going to a restaurant? • Restaurant reviews are sacrosanct. People rely more on Reviews rather than word of mouth • Distance from home comes before restaurant pricing for consumers Discounting is not Paramount ! ! ! 15.38% 36.26% 40.66% 54.95% 59.34% 0% 10% 20% 30% 40% 50% 60% 70% Available Discounts Word of Mouth Price Distance from Home Review Restaurant Booking Priority
- 6. Zomato is the go to App for Food Reviews GRAPES DIGITAL SURVEY Total Respondents (n = 91) Base Respondents for this Question (n = 91 ) Q11. Which food Review/Ordering App does your phone has? Q 12. Do you use any Apps or Websites for reviews or discounts before going to a restaurant? 2.20% 9.89% 27.47% 60.44% 0% 10% 20% 30% 40% 50% 60% 70% NightOwl Swiggy FoodPanda Zomato• 2 out of 3 people use restaurant/food reviews before going to a restaurant • Restaurant reviews are influential in terms of I-want-to-buy moments for customers • Foodpanda is gaining traction because of is heavy discounting and offers
- 8. GRAPES DIGITAL SURVEY Total Respondents (n = 91) Base Respondents for this Question (n = 91 ) Q8. Which Messaging Apps do you have? WhatsApp and Facebook Messenger have total monopoly • Every respondent used WhatsApp • 3 out of 4 users used Facebook Messenger 1.10% 3.30% 4.40% 7.69% 10.99% 73.63% 100.00% 0% 20% 40% 60% 80% 100% 120% Telegram Line WeChat Viber Hike Facebook Messenger WhatsApp
- 9. Private Bank Apps are popular than Government Bank Apps GRAPES DIGITAL SURVEY Total Respondents (n = 91) Base Respondents for this Question (n = 91 ) Q9. Which banking Apps do you have? 3.30% 3.30% 4.40% 8.79% 8.79% 9.89% 20.88% 46.15% 0% 10% 20% 30% 40% 50% Yes Bank IndusInd Citibank HDFC Axis ICICI SBI Kotak • Kotak is the most used Banking App • SBI is the only leading Government Banking App
- 10. Consumers say a big NO to Grocery Apps ! ! GRAPES DIGITAL SURVEY Total Respondents (n = 91) Base Respondents for this Question (n = 91 ) Q 12. Which Grocery Apps does you phone has? 9.89% 24.18% 59.34% 0% 10% 20% 30% 40% 50% 60% 70% Grofers Big Basket None • More than half of the users do not use any Food Grocery Apps • Only Big Basket has some prominence viz a viz other Food Grocery Apps
- 11. Consumers are hooked to Transportation Apps 2.20% 2.20% 61.54% 71.43% 0% 20% 40% 60% 80% Meru Ryde Uber Ola GRAPES DIGITAL SURVEY Total Respondents (n = 91) Base Respondents for this Question (n = 91 ) Q 14. Which Transportation Apps does your phone has? • 7 out of 10 respondents used a Transportation App • Ola and Uber share duopoly when it comes to Transportation Apps
- 12. GRAPES DIGITAL SURVEY Total Respondents (n = 91) Base Respondents for this Question (n = 91 ) Q 15. Which Music Apps does your phone has? YouTube is preferred for listening to music but. . 4.40% 14.29% 19.78% 27.47% 76.92% 0% 20% 40% 60% 80% 100% Hungama Wynk Saavan Gaana YouTube Huge Competition for 2nd Slot • Gaana, Savan and Wynk are almost neck to neck in terms of user preference for music streaming Apps
- 13. GRAPES DIGITAL SURVEY Total Respondents (n = 91) Base Respondents for this Question (n = 91 ) Q 16. Which Entertainment Apps does your phone have? Netflix is catching up with users in India . . 1.10% 1.10% 6.59% 10.99% 19.78% 71.43% 0% 20% 40% 60% 80% Fame Voot SonyLiv NetFlix HotStar YouTube • In conjunction with the global trends YouTube has the highest traction in India • HotStar has high penetration amongst users with 1 out of 5 respondent using the App • Netflix is also catching up with Indian users because of their content
- 14. GRAPES DIGITAL SURVEY Total Respondents (n = 91) Base Respondents for this Question (n = 91 ) Q 17. Which News Apps does your phone has? TOI is the leader in News Apps but. . 1.10% 2.20% 2.20% 2.20% 2.20% 4.40% 5.49% 6.59% 14.29% 23.08% 27.47% 35.16% 0% 10% 20% 30% 40% FirstPost NBT BBC News Huffington Post Livemint Hindu HT Economic Times NDTV Twitter Google News TOI • 23% of the users used Twitter for consuming News • Google News is the most followed App for news consumption after TOI • Inshorts a relatively new age content curated news provider is more popular than biggies like First Post, Huffington & ABP
- 15. GRAPES DIGITAL SURVEY Total Respondents (n = 91) Base Respondents for this Question (n = 91 ) Q 18. Which Bill payment Apps does your phone has? 0.00% 0.00% 2.20% 2.20% 3.30% 15.38% 17.58% 71.43% 0% 20% 40% 60% 80% Pockets Citrus Cash Pay Zap PayUMoney Oxigen Mobikwik Freecharge PAYTM • 7 out of 10 respondents used PAYTM as their Bill Payment App • 1 out of 6 respondents used Freecharge • Mobikwik is catching up with Freecharge in terms of penetration PAYTM is used for Bill Payments
- 17. 80.22% 40.66% 37.36% 28.57% 27.47% 17.58% 7.69% 4.40% 0.00% 10.00% 20.00% 30.00% 40.00% 50.00% 60.00% 70.00% 80.00% 90.00% “Word of Mouth“ is the most important source for App Awareness Offline Influences are the most important source of App Awareness Web based Digital Media influences play a crucial role in Mobile App discoverability App Store suggestions are also a prime source of App awareness App discovery is heavily influenced by a) Word of Mouth b) Social Media Ads c) Search Engine Ads d) App Store Suggestions
- 18. Apps are often discovered outside the App Store 80% 29% 40% 38% 28% Friends, Relatives & Colleagues Search Engine TV & Radio Social Media Ads App Store Suggestion GRAPES DIGITAL SURVEY Total Respondents (n = 91) Base Respondents for this Question (n = 91 ) Q 19. What are the sources of awareness of these apps?
- 19. 19 FACTORS INFLUENCING APP DOWNLOAD
- 20. Apps are downloaded because they Sound Fun & Interesting 56.04% 49.45% 43.96% 38.46% 0.00% 10.00% 20.00% 30.00% 40.00% 50.00% 60.00% Sounds Interesting & Fun Recommended by Others Discounts/ Rewards Familiarity with Brands GRAPES DIGITAL SURVEY Total Respondents (n = 91) Base Respondents for this Question (n = 91 ) Q 20. What are the Top reasons that you download these Apps?
- 21. Social Media & Search Ads are effective in driving App Downloads GRAPES DIGITAL SURVEY Total Respondents (n = 91) Base Respondents for this Question (n = 91 ) Q 21. What types of Ads prompt App Download ? 17.58% 29.67% 29.67% 32.97% 64.84% 0% 10% 20% 30% 40% 50% 60% 70% In App Notification Banner / Graphic Ads Video Ads Search Ads Social Media Ads • Social Media Ads are a primary source of App awareness and prompt App downloads • Search Ads are also an effective way to improve visibility for Apps • Video Ads are also a source that prompt App downloads for users
- 22. “Simplifying Life” is the major driver that Boosts App Usage 14.29% 19.78% 19.78% 20.88% 47.25% 73.63% 0% 20% 40% 60% 80% Brand Connect ( I love the brand ) Great Content Great Design & Aesthetics My friends-family connection Ease of Usage Makes my life/ task easier GRAPES DIGITAL SURVEY Total Respondents (n = 91) Base Respondents for this Question (n = 91 ) Q 22. What prompts you to use the App again & again? • An overwhelming 74% of the respondents feel that making their life simpler & helping them in doing their tasks is the most important reason why they use App again & again • Great content & App aesthetics take precedence over Brand Connect
- 23. • App content & App features have to be updated otherwise users lose interest in the App • Offers and Discounts are the least important reason for a user to switch their allegiance over to other Apps 58.24% 53.85% 42.86% 30.77% 0.00% 10.00% 20.00% 30.00% 40.00% 50.00% 60.00% 70.00% Found a Better App Found the App no longer useful Lost Interest No offer is there Better App displaces brand loyalty amongst Users GRAPES DIGITAL SURVEY Total Respondents (n = 91) Base Respondents for this Question (n = 91 ) Q 24. What are the top reasons for not using an app?