More Related Content Similar to Square Pharmaceuticals LTD. (20) 1. SQUARE PHARMACEUTICALS
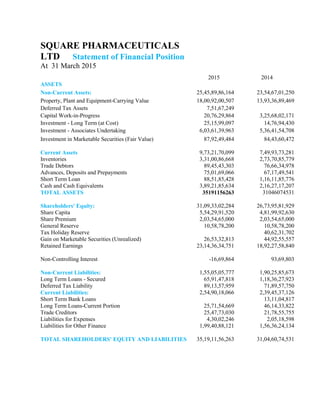
LTD Statement of Financial Position
At 31 March 2015
2015 2014
ASSETS
Non-Current Assets: 25,45,89,86,164 23,54,67,01,250
Property, Plant and Equipment-Carrying Value 18,00,92,00,507 13,93,36,89,469
Deferred Tax Assets 7,51,67,249
Capital Work-in-Progress 20,76,29,864 3,25,68,02,171
Investment - Long Term (at Cost) 25,15,99,097 14,76,94,430
Investment - Associates Undertaking 6,03,61,39,963 5,36,41,54,708
Investment in Marketable Securities (Fair Value) 87,92,49,484 84,43,60,472
Current Assets 9,73,21,70,099 7,49,93,73,281
Inventories 3,31,00,86,668 2,73,70,85,779
Trade Debtors 89,45,43,303 76,66,34,978
Advances, Deposits and Prepayments 75,01,69,066 67,17,49,541
Short Term Loan 88,51,85,428 1,16,11,85,776
Cash and Cash Equivalents 3,89,21,85,634 2,16,27,17,207
TOTAL ASSETS 35191156263 31046074531
Shareholders' Equity: 31,09,33,02,284 26,73,95,81,929
Share Capita 5,54,29,91,520 4,81,99,92,630
Share Premium 2,03,54,65,000 2,03,54,65,000
General Reserve 10,58,78,200 10,58,78,200
Tax Holiday Reserve 40,62,31,702
Gain on Marketable Securities (Unrealized) 26,53,32,813 44,92,55,557
Retained Earnings 23,14,36,34,751 18,92,27,58,840
Non-Controlling Interest -16,69,864 93,69,803
Non-Current Liabilities: 1,55,05,05,777 1,90,25,85,673
Long Term Loans - Secured 65,91,47,818 1,18,36,27,923
Deferred Tax Liability 89,13,57,959 71,89,57,750
Current Liabilities: 2,54,90,18,066 2,39,45,37,126
Short Term Bank Loans 13,11,04,817
Long Term Loans-Current Portion 25,71,54,669 46,14,33,822
Trade Creditors 25,47,73,030 21,78,55,755
Liabilities for Expenses 4,30,02,246 2,05,18,598
Liabilities for Other Finance 1,99,40,88,121 1,56,36,24,134
TOTAL SHAREHOLDERS' EQUITY AND LIABILITIES 35,19,11,56,263 31,04,60,74,531
2. AMOUNT PERCENT
1,91,22,84,914 8.12%
4,07,55,11,038 29.25%
7,51,67,249 0.00%
-3,04,91,72,307 -8.66%
10,39,04,667 0.30%
67,19,85,255 1.91%
3,48,89,012 0.10%
2,23,27,96,818 6.34%
57,30,00,889 1.63%
12,79,08,325 0.36%
7,84,19,525 0.22%
-27,60,00,348 -0.78%
1,72,94,68,427 4.91%
4,14,50,81,732 11.78%
4,35,37,20,355 12.37%
72,29,98,890 2.05%
0 0.00%
0 0.00%
-40,62,31,702 -1.15%
-18,39,22,744 -0.52%
4,22,08,75,911 11.99%
-1,10,39,667 -0.03%
-35,20,79,896 -1.00%
-52,44,80,105 -1.49%
17,24,00,209 0.49%
15,44,80,940 0.44%
-13,11,04,817 -0.37%
-20,42,79,153 -0.58%
3,69,17,275 0.10%
2,24,83,648 0.06%
43,04,63,987 1.22%
4,14,50,81,732 11.78%
Square Pharmaceuticals Ltd. Horizontal
Analysis of Balance Sheet
3. Amount Percent Amount Percent
25458986164 72.34% 23,54,67,01,250 75.84%
18009200507 51.18% 13,93,36,89,469 44.88%
75167249 0.21% 0 0.00%
207629864 0.59% 3,25,68,02,171 10.49%
25,15,99,097 0.71% 14,76,94,430 0.48%
6,03,61,39,963 17.15% 5,36,41,54,708 17.28%
87,92,49,484 2.50% 84,43,60,472 2.72%
9,73,21,70,099 27.66% 7,49,93,73,281 24.16%
3,31,00,86,668 9.41% 2,73,70,85,779 8.82%
89,45,43,303 2.54% 76,66,34,978 2.47%
75,01,69,066 2.13% 67,17,49,541 2.16%
88,51,85,428 2.52% 1,16,11,85,776 3.74%
3,89,21,85,634 11.06% 2,16,27,17,207 6.97%
35,19,11,56,263 100.00% 31,04,60,74,531 100.00%
31,09,33,02,284 88.36% 26,73,95,81,929 86.13%
5,54,29,91,520 15.75% 4,81,99,92,630 15.53%
2,03,54,65,000 5.78% 2,03,54,65,000 6.56%
10,58,78,200 0.30% 10,58,78,200 0.34%
0.00% 40,62,31,702 1.31%
26,53,32,813 0.75% 44,92,55,557 1.45%
23,14,36,34,751 65.77% 18,92,27,58,840 60.95%
-16,69,864 0.00% 93,69,803 0.03%
1,55,05,05,777 4.41% 1,90,25,85,673 6.13%
65,91,47,818 1.87% 1,18,36,27,923 3.81%
89,13,57,959 2.53% 71,89,57,750 2.32%
2,54,90,18,066 7.24% 2,39,45,37,126 7.71%
0.00% 13,11,04,817 0.42%
25,71,54,669 0.73% 46,14,33,822 1.49%
25,47,73,030 0.72% 21,78,55,755 0.70%
4,30,02,246 0.12% 2,05,18,598 0.07%
1,99,40,88,121 5.67% 1,56,36,24,134 5.04%
35,19,11,56,263 100.00% 31,04,60,74,531 100.00%
Square Pharmaceuticals Ltd. Vertical
Analysis of Balance sheet
2015 2014
4. Amount Percent
3,88,78,83,691 14.57%
47,17,23,792 1.77%
3,41,61,59,899 12.80%
-1,98,21,31,472 -7.43%
1,43,40,28,427 5.37%
-35,20,70,119 -1.32%
-32,59,00,147 -1.22%
-4,46,87,061 -0.17%
1,85,17,089 0.07%
1,08,19,58,308 4.05%
4,85,96,632 0.18%
1,13,05,54,940 4.24%
-7,93,56,220 -0.30%
1,05,11,98,720 3.94%
-16,10,75,802 -0.60%
-2,94,34,161 -0.11%
7,51,67,249 0.00%
93,58,56,006 3.51%
9,95,75,169 0.37%
1,03,54,31,175 3.88%
0
-31,96,46,077 -1.20%
71,57,85,098 2.68%
1,03,54,31,175 3.88%
1,03,92,51,291 3.89%
-38,20,116 -0.01%
71,57,85,098 2.68%
71,96,05,214 2.70%
-38,20,116 -0.01%
0
2 0.00%
0 0.00%
Square Pharmaceuticals Ltd. Horizontal
Analysis of Income statement
5. Amount Percent Amount Percent
30,83,35,71,248 115.55% 26,94,56,87,557 115.80%
4,14,89,98,132 15.55% 3,67,72,74,340 15.80%
26,68,45,73,116 100.00% 23,26,84,13,217 100.00%
-14,94,28,70,155 -56.00% -12,96,07,38,683 -55.70%
11,74,17,02,961 44.00% 10,30,76,74,534 44.30%
-4,69,20,91,383 -17.58% -4,34,00,21,264 -18.65%
-3,75,78,38,863 -14.08% -3,43,19,38,716 -14.75%
-77,56,38,213 -2.91% -73,09,51,152 -3.14%
-15,86,14,307 -0.59% -17,71,31,396 -0.76%
7,04,96,11,578 26.42% 5,96,76,53,270 25.65%
29,37,30,506 1.10% 24,51,33,874 1.05%
7,34,33,42,084 27.52% 6,21,27,87,144 26.70%
-37,97,95,062 -1.42% -30,04,38,842 -1.29%
6,96,35,47,022 26.10% 5,91,23,48,302 25.41%
-1,67,98,77,193 -6.30% -1,51,88,01,391 -6.53%
-17,24,00,209 -0.65% -14,29,66,048 -0.61%
7,51,67,249 0.28% 0 0.00%
5,18,64,36,869 19.44% 4,25,05,80,863 18.27%
79,51,99,468 2.98% 69,56,24,299 2.99%
5,98,16,36,337 22.42% 4,94,62,05,162 21.26%
0.00%
-183922744.00 -0.69% 13,57,23,333 0.58%
5,79,77,13,593 21.73% 5,08,19,28,495 21.84%
5,98,16,36,337 22.42% 4,94,62,05,162 21.26%
5,98,38,06,201 22.42% 4,94,45,54,910 21.25%
-21,69,864 -0.01% 16,50,252 0.01%
5,79,77,13,593 21.73% 5,08,19,28,495 21.84%
5,79,98,83,457 21.73% 5,08,02,78,243 21.83%
-21,69,864 -0.01% 16,50,252 0.01%
0.00% 0.00%
11 0.00% 9 0.00%
55,42,99,152 2.08% 55,42,99,152 2.38%
Square Pharmaceuticals Ltd. Vertical
Analysis of Income statement
6. Square Pharmaceuticals Limited
Ratio Analysis
Liquidity Ratio
Current Ratio
Current Ratio = Current Asset ÷ Current Liability
9,732,170,099 ÷ 2,549,018,066 = 3.818
Quick ratio or acid test Ratio
(Current asset- inventories)/Current liabilities
9732170099- 3,310,086,668 / 2,549,018,066 =2.519
Accounts Receivable Turnover
Net credit sales/Average net Accounts Receivable
26684573116/ 894,543,303+766,634,978 /2 = 17.44 20.65 days
Inventory Turnover
Cost of Goods Sold / Average Inventory
14942870155/3,310,086,668+2,737,085,779 /2 = 4.51 80.93 Days
Profitability Ratio
profit margin
Net Income/Net sales
5186436869/26,684,573,116*100 = 19.45%
Total asset turnover Ratio
Net Sales / Total asset
7. 26,684,573,116/ 35,191,156,263 = 75.83%
Return on asset Ratio
Net Income/Total Assets
5186436869/35,191,156,263= 14.738
total asset turnover Ratio
Net income / Common stockholders “equity
5186436869/31093302284 = 16.7%
Earnings Per Share
Net income /weighted average number of share outstanding
5186436869/4,819,992,630 + 5,542,991,520 /2 = 0.683
Price Earnings Ratio
Market price Per Share of Stock/Earning Per Share
270.3/0.683 = 395.754
payout Ratio
Cash dividend /Net Income
1,445,997,789/5186436869 = 27.88%
Solvency Ratios
Debt to Asset ratio:
Debt/Total Asset
4099523843/35,191,156,263 = 11.65%
Time Interest Earned :
Income before Income taxes and Interest Expense/ Interest Expense
7122161329/158614307 = 44.90 times