SlideShare una empresa de Scribd logo
1 de 12
Descargar para leer sin conexión
Research Journal of Finance and Accounting                                                    www.iiste.org
ISSN 2222-1697 (Paper) ISSN 2222-2847 (Online)
Vol 2, No 6, 2011

     Stock Prices and Microeconomic Variables: T-Y Granger
       Causal Evidence From Dhaka Stock Exchange (DSE)

                                         Mohammad Bayezid Ali
                            Department of Finance, Faculty of Business Studies
                                 Jagannath University, Dhaka, Bangladesh.
                         Tel: +88- 0171-5028151 E-mail: bayezid2001@gmail.com

Abstract:
This study examines the long-run equilibrium relationship and the direction of causality between stock
prices at Dhaka Stock Exchange (DSE) and a set of four stock market oriented factors technically can be
defined as microeconomic variables. Through utilizing the methods of Unit–Root tests, Johansen and
Juselius (1990) Cointegration test and the long–run Granger Causality test proposed by Toda and
Yamamoto (1995), we have investigated the long-run equilibrium relationship as well as causal
relationships between the DSE all share price index (DSI) and the four microeconomic variables (i.e.
market dividend yield, market price-earnings multiples, monthly average market capitalization and monthly
average trading volume) using monthly data from the period January 2000 to December 2010. Significant
findings include long-run equilibrium relationship among the variables under study. However, DSI, in any
way, do not granger cause dividend yield; but DSI has bi-directional causal relation with market price-
earning multiples and the first lag of the monthly average trading volume. On the other hand, unidirectional
causality is found from DSI to the first lag of monthly average market capitalization but no causality is
found from the opposite direction.

Keywords: Microeconomic Variables, Unit Root Test, Cointegration, T-Y Granger Causality

1. Introduction:

Many developing economies have attempted to develop capital markets, not only to raise capital rather
capital markets are expected to meet two basic requirements: it should support industrialization through
savings mobilization, investment funds allocation and maturity transformation. Besides, it must be safe and
efficient in discharging the aforesaid function. In emerging economies like Bangladesh, stock markets are
expected to function like a barometer of the financial performance of the organizations, efficiency of the
financial markets and an icon of the development of economic activity. But such conditions do not usually
exist due to prevalence of informal credit markets that tend to limit the capacity to mobilize financial
savings, a low degree of ownership-management separation associated with the drawbacks of informational
asymmetry and low level of accumulated of financial assets making maturity transformations difficult. Of
course, these conditions differ widely from country to country (Ahmed, M.F. 2002).
Investors invest in financial securities for competitive and satisfactory returns. They generally consider the
ex-post and ex-ante returns of the securities while making and investment decision. This is because the
investment in financial assets is always associated with different types of risks which are expected to be
driven partly by company oriented factors, partly by industry factors, partly by market oriented factors and
partly by macroeconomic factors. A clear knowledge about the volatility and sensitivity of each and every
factor with respect to behavior of the stock prices help an investor to enjoy a competitive advantage over
those who do not have such knowledge in the process of generating satisfactory return from investment in
financial assets. That’s why researchers and academicians from all over the world have given their effort to
identify those real factors that significantly contributes to the volatility of stock prices. They developed and
explained different theories and models to identify the factors truly responsible to the volatility of stock
prices. Their results also differ with respect to developed economy and those of emerging economy. This
study is an attempt to identify long run equilibrium relationship as well as causal relationship between
stock prices and a set of four market oriented variables which can be technically defined as microeconomic

1|Page
Research Journal of Finance and Accounting                                                 www.iiste.org
ISSN 2222-1697 (Paper) ISSN 2222-2847 (Online)
Vol 2, No 6, 2011
variables in an emerging economy like Bangladesh. Bangladesh stock markets are represented by two stock
exchanges, viz., Dhaka Stock Exchange (DSE) and Chittagong Stock Exchange (CSE). Both DSE and CSE
are corporate bodies under Companies Act 1994. Although DSE was first established in 1954, its activities
were suspended for a brief period from 1971 to 1976 due to introduction of a socialistic approach of
development during this period. DSE started functioning with 9 listed companies in 1976; however the
number has reached to 218 on 2010.
The purpose of this paper is to scrutinize the long run equilibrium relationship as well as causal relation
between the stock price and four market oriented variables technically known as microeconomic variables
(i.e. market dividend yield, market price-earnings multiples, monthly average market capitalization and
monthly average trading volume), in the context of the Bangladesh economy for the period from January
2000 to December 2010 (132 monthly observations) which also witnessed commencement of economic
liberalization. The analysis of the interrelationship runs in terms of Efficient Market Hypothesis. The
Efficient Market Hypothesis (semi-strong form), states that in a semi strong efficient market, everyone has
perfect knowledge of all publicly available information and these are fully reflected in stock prices.
Otherwise, the market participants are able to develop profitable trading rules and the stock market will not
channel financial resources to the most productive sectors.
The use of Granger Causality Test in examining market informational efficiency has recently been found
unable to capture many of the time series properties. This paper makes use of the most recently available
econometric technique, as proposed by Toda and Yamamoto (1995), which overcomes the technical
problems associated with the traditional Granger Causality test. The contribution of this paper lies first of
all, in focusing on stock market efficiency with respect to four stock market oriented variables commonly
known as microeconomic variables which acts like determinant factors of equity returns and secondly in
applying the Toda and Yamamoto causality technique which is superior to traditional Granger Causality
Test.
A survey of the existing literature including empirical evidences on the nature of causal relationships
between stock prices and stock market oriented variables has been discussed in Section 2.0; Section 3.0
discuses the methodology employed and presents the variables and data descriptions. Section 4.0 analyses
the empirical results followed by concluding observation in Section 5.0.

2. Review of Literature:

A good number of empirical evidence is found in developed economies to examine stock price behavior
and efficiency of the stock market. The evidence of stock price behavior and market efficiency using
fundamental factors, industry factors and macroeconomic factors are still not satisfactory. Numerous
empirical studies have been carried out to determine the stock market reactions to dividend announcements.
Aharony and Swary (1980), Kwan (1981), Eades (1982), and Woolridge (1982), have found a significant
positive association between announcement of dividend changes and the stock return, using the dividend
announcement made in isolation of other firm news report. Gordon (1962 and 1963) and Walter (1963)
support the dividend relevance doctrine. They suggest that dividend policy and investment policy are inter-
linked. Investment policy can not be separated from dividend policy and the choice of an appropriate
dividend policy affects the value of the firm.
The leading proponents of the bird-in-the-hand theory (Gordon, 1962; and Lintner, 1962) found that
stockholder value a dollar received in dividend more highly than dollar earnings retained. Therefore,
dividend policy is relevant to the value of shares. Miller and Scholes (1981) have argued that the observed
relationship between common stock returns and dividend yields as attributed to the favorable information
contained in the knowledge that a firm will actually declare any dividend. Dhillon and Jhonson (1994)
examine the stock and bond price reaction to dividend changes. The positive stock market response to
dividend increases has several potential explanations, two of the more commonly discussed being
information content and wealth redistribution between stockholders and bondholders. The evidence
presented by Dhillon and Jhonson (1994) support the wealth redistribution hypothesis but does not rule out
the information content hypothesis. Typically, Dhillon and Jhonson (1994) found that the bond price
reaction to announcement of large dividend changes is opposite to the stock price reaction. Their result


2|Page
Research Journal of Finance and Accounting                                                   www.iiste.org
ISSN 2222-1697 (Paper) ISSN 2222-2847 (Online)
Vol 2, No 6, 2011
differs from those of Handjinicolaou and Kalay (1984) who analyzed bond returns around dividend
changes, and reported that the bond prices are not affected by dividend increases but the bond prices react
negatively to divided reductions. Dhillon and Jhonson (1994) argue that their data supports the information
content hypothesis. In contrast, Jayaraman and Shastri (1988) find insignificantly negative bond price
reactions to dividend announcement.
Ahmed M. F., (1991) investigates the dividend policy of the enterprises listed on Dhaka Stock Exchange
(DSE) and to draw an analogy between that of Japanese and Bangladeshi enterprises. He comment that
both dividend and retained earnings convey a return to the stockholders but in Bangladesh dividend rate
demonstrate a declining trend while that of Japanese enterprises appears to be somewhat stable. Thus lower
dividend yield in Bangladesh is attributable to both lower dividend rate and higher market capitalization
while it is mostly due to higher market capitalization in Japan. He also found that dividend rate and yield in
Bangladesh is lower than time deposit interest rate whereas in Japan although dividend yield is lower than
interest rate but dividend rate is higher than that of. It is also found that companies paying regular dividend
have higher P/E ratio than those paying irregularly which ultimately implies that market regards regular
dividend policy and regular dividend stimulate the price.
Ahmed M. F., (2000) investigate the relative importance of dividend and retained earnings to explain the
stock price variation in Bangladesh. The findings reveal that both dividend and retained earnings influence
the stock price and they have their impact ignoring their usual expectation of stronger dividend impact on
non-growth industries and retained earnings impact on growth industries. In most cases, dividend
hypothesis appears to be stronger than the retained earnings hypothesis. Dividends convey valuable
information to the investors and it has been documented that the managers’ behavior also appears to be
consistent with this view thus supporting Dividend Relevance Theory (Linter, 1956). Although other
alternative exists through which managers can disseminate information but dividends are highly visible
compared to other announcements in addition to its credibility of cash signals.
Pu Shen (2000) examines the historical relationship between price-earnings ratios and subsequent stock
market performance. The author finds strong historical evidence that high price-earnings ratios have been
followed by disappointing stock market performance in the short and long term. Specifically, high price-
earnings ratios have been followed by slow long-run growth in stock prices. Moreover, when high price-
earnings ratios have reduced the earnings yield on stocks relative to returns on other investments, short-run
stock market performance has suffered as well.
Hamid and Chowdhury (2005) used two measures i.e. daily market- adjusted abnormal return (MARR) and
daily cumulative abnormal return (CAR) to study the impact of dividend announcement on shareholders’
value. They explained MARR as an indicator of the relative daily percentage price change in the dividend
paying stocks compared to the change in average market price. Whereas CAR has been defined as a
measure of the investors’ total return over a period starting from well before the announcement of dividend
to well after the dividend announcement day. They have taken 137 samples of dividend paying companies
listed on Dhaka Stock Exchange and found that MARR on the day of dividend announcement was not
statistically significant which entails that the market reacts earlier than the actual announcement of
dividend. On the other hand, the findings of CAR results that investors lost more value in the ex-dividend
period than the value gained in the pre-dividend period. These findings also suggest that dividend
announcement does not carry information about the future earnings and cash flows of the companies.
Anderson K. and Brooks C. (2006), found that P/E calculated from multiple years of earnings is a better
predictor of returns than the traditional one-year P/E.
Hossain. M. (2006) examined the determinants of stock price and return movements of listed companies of
Dhaka Stock Exchange (DSE). He used several factors like number of listed securities, number of initial
public offerings, earnings per share, dividend per share dividend pay out ratio and also used some
macroeconomic variables like gross domestic product (GDP), per capital income, savings, investment,
export, import, foreign exchange reserve, inflation rate, money supply, consumption, deposit interest rate,
advance interest rate as influential factors for determining the price of stock. He found a negative relation
in between dividend yield and the price of any stock.


3|Page
Research Journal of Finance and Accounting                                                     www.iiste.org
ISSN 2222-1697 (Paper) ISSN 2222-2847 (Online)
Vol 2, No 6, 2011
Rahman, Z. and Rahman, L. (2008) in their study of stock price behavior around ex-dividend date from
DSE found an increase of stock prices. They have made a conclusion that ex-dividend price increased
instead of dropped in DSE that implies a clear preference for capital gains without having any focus of
dividends by the stockholders.
Vorek M. (2009) examines that the investments into stocks with low price to earnings ratio achieved higher
than average returns. This paper focuses on the other side of that relation, whether the high price to earning
ratio predicts the future falls in stock prices and whether the price to earnings ratio could act as an indicator
of the coming bear market. The Author concluded that P/E ratio in a role of an indicator of the future stock
markets falls does not result in clear conclusion.
Ali M.B. and Chowdhury T.A, (2010) examined the impact of dividend announcement on stock market
prices of 25 listed commercial banks in Dhaka Stock Exchange (DSE). They have employed an standard
even study methodology to analyze the stock price reaction for dividend announcement and found 11 out of
25 banks’ stock price declines, 6 bank’s stock price raises and no change in 8 banks. Finally they agreed
with the dividend irrelevance theory and conclude that dividend announcement itself has no influence on
share price.
Ong, T.S., Yichen, Y.N., Teh, B.H., (2010) examine the capability of the average PE ratio to forecast future
stock market returns. They also test whether PE ratio can be used to predict future stock market declines
and whether PE ratio can serve as a parameter of the coming bear market in the Malaysian Equity Market.
Their investigation reveals that the null hypothesis of PE ratio as not a useful predictor of KLCI index was
rejected. A linear positive slope exists between the annualized return of the KLCI and PE ratio, thus
suggesting that an increase in PE ratio could have led to a subsequent rise in the KLCI. In this case, a
decline in PE ratio could have resulted in a subsequent fall in the KLCI, henceforth, serving as an indicator
of the coming bear market in Malaysia. In sum, the hypothesis that high levels of PE ratios will lead to
future decline
Ali M. B. (2011) investigates the impact of changes in selected microeconomic and macroeconomic
variables on stock returns at Dhaka Stock Exchange (DSE). A Multivariate Regression Model computed on
Standard OLS Formula has been used to estimate the relationship. Regression coefficient reveals that
inflation and foreign remittance have negative influence and industrial production index; market P/Es and
monthly percent average growth in market capitalization have positive influence on stock returns. All the
independent variables can jointly explain 44.48 percent variation in DSE all share price index. No
unidirectional Granger Causality is found between stock prices and all the predictor variables except one
unidirectional causal relation from stock price and market P/Es. Finally, lack of Granger causality between
stock price and selected micro and macro variables ultimately reveals the evidence of informationally
inefficient market.

3. Methodology:
3.1 Research Methods:

This study basically tries to examine the causal relationship between Dhaka Stock Exchange (DSE) all
share price index (DSI) and a set of 4 stock market oriented variables usually described as microeconomic
variables like market dividend yield (DY), market price earnings multiples (MKTPE), first lag of monthly
average market capitalization (MAMCAP(-1)) and first lag of monthly average trading volume (MATVM
(-1)). Market dividend yield and market price-earnings multiples are considered to be fundamental
parameter that significantly influence stock prices and which is also supported by different Finance
Theories and empirical evidence examined by different researchers and academicians. On the other hand,
(MAMCAP(-1)) and (MATVM (-1)) are expected to be influential behavioral factors that are also closely
associated with stock prices.
At the beginning, Granger causality (1988) test was thought to be the most appropriate test for this study.
To explain, in brief, a simple definition of Granger Causality, in the case of two time-series
variables, X and Y: "X is said to Granger-cause Y if Y can be better predicted using the histories of
both X and Y than it can by using the history of Y alone."


4|Page
Research Journal of Finance and Accounting                                                       www.iiste.org
ISSN 2222-1697 (Paper) ISSN 2222-2847 (Online)
Vol 2, No 6, 2011
We can test for the absence of Granger causality by estimating the following VAR model:

        Yt = a0 + a1Yt-1 + ..... + apYt-p + b1Xt-1 + ..... + bpXt-p + ut   (1)

        Xt = c0 + c1Xt-1 + ..... + cpXt-p + d1Yt-1 + ..... + dpYt-p + vt   (2)

Then, testing H0: b1 = b2 = ..... = bp = 0, against HA: 'Not H0', is a test that X does not Granger-cause Y.

Similarly, testing H0: d1 = d2 = ..... = dp = 0, against HA: 'Not H0', is a test that Y does not Granger-cause X.

In each case, a rejection of the null implies there is Granger causality. But later on we identify two major
drawbacks of using Granger Causality test when more than two variables are considered:
Granger Causality test consider only two variables to examine the causal relation between them. But it does
not consider the effects of other associated variables which are subject to possible specification bias. As
pointed out by Gujarati (1995), causality is sensitive to model specification and the number of lags. It
would reveal different results if any variable (s) was relevant and was not included in the model. Therefore
the empirical evidence of a two variable Granger-Causality is fragile because of this problem.
Time series data are often non-stationary. This situation could exemplify the problem of spurious
regression. Gujarati (1995) also said that when variables are integrated, the F-test procedure is not valid, as
the test statistics don’t have a standard distribution. Although researchers can still test the significance of
individual coefficients with t-statistics, one may not able to use F-statistics to jointly test the Granger-
Causality. Enders (2004) proved that in some special cases, using F-statistics to jointly test first differential
VAR is permissible. First differential VAR also has its limitations, which can not be employed universally.
To sum up, because of the probable shortcomings of specification bias and spurious regression, this study
does not carry out traditional Granger-Causality procedure to test the relationship between more than two
variables. Later on we have decided to use Toda- Yamamoto (1995) procedure to examine the causal
relation for our selected variables. Toda and Yamamoto (1995) proposed a simple procedure requiring the
estimation of an ‘augmented’ VAR, even when there is cointegration, which guarantees the asymptotic
distribution of the MWald statistic. This method is applicable “whether the VAR’s may be stationary
(around a deterministic trend), integrated of an arbitrary order, or cointegrated of an arbitrary order” (Toda
and Yamamoto: Journal of Econometrics 66, 1995, pp. 227). This procedure has two important advantages
over the standard causality tests. First, it conducts Granger causality tests with allowance for the long-run
information often ignored in systems that requires first differencing and pre-whitening.2 Secondly, this
methodology is useful because it bypasses the need for potentially biased pre-tests for unit roots and
cointegration, common to other formulations such as the vector error correction model (VECM).

Toda and Yamamoto (1995) procedure involve a modified Wald (MWALD) test in an augmented VAR
model, and do not require pretesting for cointegration properties of the system. The idea underlying the
Toda–Yamamoto (TY) test is to artificially augment the true lag length (say, p) of the VAR model by the
maximal order of integration (dmax) that might occur in the process. Then, one can estimate the VAR model
with a (p + dmax) order, ignoring the coefficients of the last dmax lagged vectors, and test the linear or
nonlinear restrictions on the first k coefficient matrices by the standard Wald test. Toda and Yamamoto
(1995) prove that the Wald statistic used in this setting converges in distribution to a χ random variable,
                                                                                             2

no matter whether the process is stationary or nonstationary. The preliminary unit root and cointegration
tests are not necessary to implement the DL test, since the testing procedure is robust to the integration and
cointegration properties of the process.

Consider the following VAR( p) model:
Yt = γ + A1Yt −1 + ............ + ApYt − p + ε


5|Page
Research Journal of Finance and Accounting                                               www.iiste.org
ISSN 2222-1697 (Paper) ISSN 2222-2847 (Online)
Vol 2, No 6, 2011
where, yt, c, and et ~(0, Ω ) are n-dimensional vectors and Ak is an nxn matrix of parameters for lag k. To
implement the T-Y test the following augmented VAR( p +d) model to be utilized for the test of causality is
estimated,
                                                  ∧                  ∧
       ∧          ∧
                                              ∧                ∧                ∧
Yt =   γ   +   AY t −1   + .......... ... +
                                              A p Yt − p   +
                                                               A p Yt − p − d + ε

where the circumflex above a variable denotes its ordinary least squares (OLS) estimate. The order p of the
process is assumed to be known, and d is the maximal order of integration of the variables. Since the true
lag length p is rarely known in practice, it can be estimated by some consistent lag selection criteria. Note
that if the maximal order of integration d =1, then the T-Y test becomes similar to the DL test. The jth
element of Yt does not Granger-cause the ith element of Yt, if the following null hypothesis is not
rejected:

H0 : the row i; column j element in Ak equals zero for k = 1,…….., p

The null hypothesis is tested by a Wald test which is termed as modified Wald (MWALD) test in case of
the augmented VAR outlined above.

3.2 Data and Data Sources:
This study concentrates on investigating the Granger Causal Relation proposed by Toda-Yamamoto (1995)
between Dhaka Stock Exchange (DSE) all share price index and a set of 4 stock market oriented variables
usually defined as micro economic variables (i.e. market dividend yield, market price earnings multiples,
the first lag of the monthly average market capitalization and first lag of monthly average trading volume).
For the purpose of this study DSE all share price index (DSI) data was collected for the period from
January 2000 to December 2010 (132 monthly observations). The data source of DSE all share price index
is the ‘Monthly Review’ publication issued by Dhaka Stock Exchange (DSE). Monthly data for the set of
selected microeconomic variables for the same period were collected from same source of ‘Monthly
Review’ published by DSE. But it is very important to mention that the market variables used in this study
are absolutely total market oriented secondary data regardless of any specific industry. These entire market
oriented microeconomic variables are selected to ensure conformity with the DSE all share price index
which also works like an indicator of stock market price movement.

4. Empirical Result:

4.1 Unit Root Test:
T-Y procedure of Granger Causality proposes to test the order of integration in all the variables under each
investigation. In the econometrics literature, there have been a variety of unit root test that can be used for
identifying the order of integration (for example Dickey and Fuller, 1979; Sargan and Bhargava, 1983;
Phillips and Parron, 1988; Kwiatkowski, Phillips, Schmidt, and Shin, 1992 among the others) and each has
been widely used in the applied economics literature. In this study Augmented Dickey-Fuller (ADF) Test,
Phillips and Parron Test (P-P) test and Kwiatkowski, Phillips, Schmidt, and Shin (KPSS) test has been used
to identify the order of integration in each and every variable. ADF and P-P test assumes the identical null
hypothesis of nonstationary data series against an alternative hypothesis of stationary data series. On the
other hand, KPSS assumes stationery data series as null hypothesis and nonstationary data series in the
alternative hypothesis. The basic reason for selecting this three types of unit root test is to ensure a cross
check in estimating the order of integration in each variables. Table-1 presents the test result of the order
integration under ADF test, P-P test and KPSS test. Test result reveals that, under ADF test DSI, DY,
MKTPE, and MATVM (-1) all are first order integrated data series and MAMCAP (-1) is the only second
oder integrated data series. Under P-P test, we have found that all the data series under study hold the order
of integration one. Whereas, KPSS test result shows that same output about the order of integration in each
of the variables. So, in terms of test result ADF and KPSS reveals the same output but P-P shows slightly
different result which is very insignificant. Similarity in the order of integration is significant in T-Y
Granger Causality procedure because it is expected that when variables are integrated of the same order,

6|Page
Research Journal of Finance and Accounting                                                         www.iiste.org
ISSN 2222-1697 (Paper) ISSN 2222-2847 (Online)
Vol 2, No 6, 2011
they must have a cointegration relation that also contribute to have Granger Causal relation among the
variables.

4.2 Selection of Lag length by Information Criteria:
When we know that 4 out of total 5 variables are I (1) then we set up a VAR Inverse Roots of AR Characteristic Polynomial
model using all the variables regardless of the order of integration in the 1.5
time series. In this case, an optimum lag length is selected based on VAR 1.0
lag order selection criteria which are presented in Table 2. According to this
                                                                               0.5
estimated presented on table: 2, sequential modified LR test statistic (LR),
final prediction error (FPE) and Akaike information criterion (AIC) shows 0.0
that optimal lag length is 7 but Schwarz information criterion (SC) and -0.5
Hannan-Quinn information criterion (HQ) shows that optimal lag length is -1.0
1 and 3 respectively. After considering majority we finally proceed with
optimal lag length 7. We also test the VAR model in respect of serial -1.5-1.5 -1.0 -0.5 0.0 0.5 1.0 1.5
correlation with lag order 7. Table: 3 presents VAR residual serial correlation LM test result which also
show that at lag order 7 the VAR model is not affected by serial correlation problem. At this level, the
VAR with lag order 7 is found to be is found to be dynamically stable presented above.

4.3 Johansen-Juselius Cointegration Test
The Johansen method applies the maximum likelihood procedure to determine the presence of
cointegrating vectors in non-stationary time series as a vector autoregressive (VAR). Consider a VAR of
order p
                   Yt = A1Yt −1 + A2Yt −2 + ............. + ApYt − p + BX t + ε
where Yt is a k-vector of non-stationary l(1) variables, Xt is a d vector of deterministic variables, and e1 is
a vector of innovations. We can rewrite the VAR as:
                                            p −1
                         ∆Yt = ∏ Z t −1 + ∑ Γ∆Yt −1 + BX t + ε
                                            i =1
Where
                             p                                   p
                      Π = ∑ At − 1          and        Πi =    ∑A        j
                            i =1                               j =i +1
Here Yt is a vector of nonstationary variables. The information on the coefficient matrix between the levels
of the series Π is decomposed as Π = αβ ′ where the relevant elements of the α matrix are adjustment
coefficients and the β matrix contains the cointegrating vectors. Johansen and Juselius (1990) specify two
likelihood ratio test statistics to test for the number of cointegrating vectors' The first likelihood ratio
statistics for the null of exactly r cointegrating vectors against the alternative of r+1 vectors is the maximum
eigen value statistic. The second statistic for the hypothesis of at most r cointegrating- vectors against the
alternative is the trace statistic. Critical values for both test statistics are tabulated in Johansen and Juselius
(1990). The number of lags applied in the cointegration tests is based on the information provided by the
SC and HQ information criteria.

The test of cointegration based on Johansen and Juselius (1990) has been performed assuming a linear
deterministic trend with an optimum lag length 7. At first, the unrestricted cointegration rank among the
variables under study is examined through the use of trace statistics and eigenvalue statistics. Trace
statistics test the null hypothesis of r = 0 or r ≤ 1 against alternative hypothesis of r ≥1 or r = 2. On the
other hand maximum eigen value statistics test the null hypothesis of r = 0 or r = 1 against alternative
hypothesis of r = 1 or r = 2. Table -4 reveals that trace statistics reject the null hypothesis of no
cointegrating relationship among the variables. An examination of trace statistics with that of critical value
at 5 percent indicates that there are three cointegrating equation among the variables. Another important
test to identify the number of cointegrating vectors is examination of maximum eigen value. This test (see
Table: 4) also reveals the identical result that there is three cointegrating equation among the variables.

7|Page
Research Journal of Finance and Accounting                                                www.iiste.org
ISSN 2222-1697 (Paper) ISSN 2222-2847 (Online)
Vol 2, No 6, 2011

However, 4 out of 5 variables are stationary at first difference. This means that dmax = 1. So, the study
estimate a system of VAR at levels with a total of k+dmax= 7+1 = 8 lags in the model. Now a VAR model
has been estimated with lag 7 for each and every endogenous variables and additional one lag (i.e. due to
dmax =1) is used for all the variables as exogenous variables.

4.4 T-Y Granger Causality Test
The empirical results of Granger Causality test based on Toda and Yamamoto (1995) methodology is
estimated through MWALD test and reported in Table: 5. The estimates of MWALD test shows that the
test result follows the chi-square distribution with 7 degrees of freedom in accordance with the appropriate
lag length along with their associated probability.
According to this estimates DSI, in any way, has no causal relation with DY. This finding supports
“Dividend Irrelevance Theory” which theorizes that the dividend itself has no influence over stock return.
This finding is supported by other empirical evidence [Black and Scholes (1974), Hamid and Chowdhury
(2005), Ali M. B. and Chowdhury T.A. (2010) etc.]. The test estimates also shows that DSI has bi-
directional causal relation with MKTPE. This findings is also supported by another study by Pu Shen
(2000), Vorek M. (2009), Ong, T.S., Yichen, Y.N., Teh, B.H., (2010), Ali M. B. (2011) etc. On the other
hand T-Y granger causal relation is found from DSI to MAMCAP(-1) but no causal relation from
MAMCAP(-1) to DSI which simply implies that investors at Dhaka Stock Exchange (DSE) are influenced
by the lagged performance of the monthly stock market capitalization. Finally, DSI has bi-directional
causality with MATVM (-1) which is an evident that lagged value of the trading volume contributes to
upcoming stock prices and stock prices could be a parameter to estimate lagged trading volume.

5. Conclusion:

This paper applies unit-root test based on ADF, PP and KPSS and Johansen and Juselius Cointegration test
(1990) and VAR based Granger Causality Test proposed by Toda-Yamamoto (1995) to investigate long run
equilibrium relationship and granger causality between DSE all share price index and a set of four
macroeconomic variables from January 2000 to December 2010. It is found that the variables under study
have long-run equilibrium relationship among themselves. Stock returns in Bangladesh are, therefore,
predictable using past information. After then, Granger Causality among the variables are tested based on
T-Y methodology and test result reveals that stock prices, in any direction, doesn’t granger cause market
dividend yield. Bi-directional granger causality has been found between stock index and market price-
earnings multiples and the first lag of the monthly average treading volume. At the same time
unidirectional granger causality is also found from stock index to the first lag of the monthly average
market capitalization. All the test result found here is highly supported by Finance Theories, Behavioral
Finance and empirical evidence. Moreover, with the liberalization of the market, foreign investors with
their domestic counterparts may influence the prices usually at their advantage. The relative small size of
the stock market and the limited number of literate market participants are likely to constrain the free
market play and thereby impacting the usual price behavior of the market and economic growth in
Bangladesh.

Reference:

Ahmed M.F., (1991), “Dividend Policy: A Study of Enterprises Registered With the Dhaka Stock
Exchange (DSE)”, Dhaka University Journal of Business Studies, 12 (2), 107-121.
Ahmed M.F., (2000), “Impact of Dividend and Retained Earnings on Stock Prices in Bangladesh: An
Empirical Investigation”, Savings and Development, XXIV (1), 5-30.
Ahmed M.F., (1998), “Equity Market Performance in Bangladesh: An Evaluation”, Savings And
Development, XXII (1), 67-93.


8|Page
Research Journal of Finance and Accounting                                              www.iiste.org
ISSN 2222-1697 (Paper) ISSN 2222-2847 (Online)
Vol 2, No 6, 2011
Ahmed M.F. (2000), “Emerging Stock Market and the Economy”, South East Asian              Studies Series,
Nagasaki University, Japan.
Ahmed M.F. (2002), “Market Efficiency in Emerging Stock Markets: The Case of Dhaka Stock
Exchange”, Savings And Development, XXVI (1), 49-68.
Ali M. B. and Chowdhury T.A. (2010),“Effect of Dividend on Stock Price in Emerging Stock Market: A
Study on the Listed Private Commercial Banks in DSE ”, International Journal of Economics and Finance,
2(4), 52-64.
Ali M.B., (2011), “Impact of Micro and Macroeconomic Variables on Emerging Stock Return: A Case on
Dhaka Stock Exchange (DSE).” Interdisciplinary Journal of Research in Business, 1(5), 08-16.
Anderson K. and Brooks C. (2006), “The Long-Term Price-Earning Ratio”, Journal of Business Finance
and Accounting, 37(7 &8), 1063-1083.
Arahony, J. and I. Swary (1980), “Quarterly Dividend and Earnings Announcements and Stockholders
Returns: An Empirical Analysis”, Journal of Finance, 35, 1-12.
Black, F. and M. S. Scholes, (1974), “The Effect of Dividend Yield and Dividend Policy on Common
Stock Prices and Return”, Journal of Financial Economics, 1, 1-22.
Dhillon, U., and H. Johnson (1994),“The Effect of Dividend Changes on Stock and Bond Prices”, Journal
of Finance, 49, 281-289.
Dickey, D. A. and W.A. Fuller, (1981), "Likelihood Ratio Statistics for Autoregressive Time Series with a
Unit Root", Econometrica 48, 1057-1072
Eades, K. (1982), “Empirical Evidence on Dividends as a Signal of Firm Value”, Journal of Financial and
Quantitative Analysis, 17 471-500.
Enders W. (2004), Advanced Econometric Time Series (Second Edition), New York: Willey.
Engle, R.F and C.W.J. Granger, (1987), "Cointegration and Error correction: Representation, Estimation
and resting", Econimetrica, 55(2), 251-276.
Fama, E.F.,(1981), "stock Returns, Real Activity, Inflation and Money", American Economic Review 71,
545-565.
Fama, E.F. (1990), "Stock Returns, Expected Returns, and Real Activity", Journal of Finance 45, 1089-1
108.
Gordon, M. J.(1963), “Optimum Investment and Financing Policy”, Journal of Finance, 18, 264-272.
Handjinicolaon, G., and A. Kalay (1984), “Wealth Redistributions or Changes in Firm Value: An Analysis
of Returns to Bondholders and Stockholders around Dividend Announcements”, Journal of Financial
Economics, 13, 35-63.
lmam, M. Osman, and A.S. M.M. Amin, (2004), "Volatility in the stock Return: Evidence from Dhaka
Stock Exchange", Journal of the Institute of Bankers Bangladesh, 51(1), 01-08.
lmam, M. Osman, (2000), "Capital Market Development: Problems and Prospects”, Portfolio, Chittagong
Stock Exchange, Oct-Dec, 43-56.
Jayaraman, N. and K. Shastri (1988), “The Valuation of Specially Designed Dividends”, Journal of
Financial and Qualitative Analysis, 23, 301-312.
Johansen, S.(1991), "Estimation and Hypothesis Testing of Cointegrating Vectors in Gaussian Vector
Autoregressive Models", Econometrica 59, 1551-1580.
Johansen, S. and K. Juselius, (1990), "Maximum Likelihood Estimation and Inference on Cointegration-
With Application to the Demand for Money", Oxford Bulletin of Economics and Statistics 52, 169-210.


9|Page
Research Journal of Finance and Accounting                                               www.iiste.org
ISSN 2222-1697 (Paper) ISSN 2222-2847 (Online)
Vol 2, No 6, 2011
Linter, J.,(1956), “Distribution of Income of Corporations among Dividends, Earnings and Taxes.”
American Economic Review, 46(2), pp. 97-113.
Miller, M., and M. Scholes (1981), “Dividends and Taxes: Empirical Evidence”, CRSP Working Paper,
University of Chicago.
Mohiuddin, M. Rahman M.L. and Uddin, J. (2009), “Test of Efficiency in Emerging Stock Market:
Evidence From Bangladesh”, Journal of Business Administration, 35(1& 2), 1-20.
Mollah, A.S. Rahman, M.Z. and Islam, M. S., (2005), “Return behavior of the DSE-20: An Empirical
Investigation on the Dhaka Stock Exchange”, Journal of Business Studies, XXVI (2), pp. 25-38.
Mollah, A.S., Mobarek A.and Islam R. (2007), “Market Response to Dividend Increases and Changes in
Payout Ratios: An Empirical Investigation on the Dhaka Stock Exchange Listed Textile Sector
Companies”, Journal of Banking and Financial Services, 1(1&2).
Pu Shen, (2000), “Economic Review”, Federal Reserve Bank of Kansas City, Fourth Quarter, pp. 23- 36.
Ong, T.S., Yichen, Y.N., The, B.H., (2010),“Can High Price Earnings Ratio Act As An Indicator Of the
Coming Bear Market In The Malaysia?” International Journal of Business and Social Science, 1(1), pp.
196-213.
Rahman, Z. and Rahman, L. (2008), “Stock Price Behavior Around Ex-dividend Day: Evidence from
Dhaka stock Exchange”, Journal of Business Administration, 34, 127-144.
Seddighi, H.R., Lawler, K.A., and Katos, (2000), A.V, Econometrics: A Practical Approach (First Edition),
Routledge.
Uddin M. H., and Chowdhury G. M. (2005), “Effect of Dividend Announcement on Shareholders’ Value:
Evidence from Dhaka Stock Exchange”, Journal of Business Research, 1.
Vorek M. (2009), “Does High Price earnings Ratio Predict Future Falls of Stock Price?”, Faculty of finance
and accounting, University of Economics in Prague, pp. 1-22
Woolridge, J.R. (1982),“The Information Content of Dividend Changes”. Journal of Financial Research, 5,
237-247.


10 | P a g e
Research Journal of Finance and Accounting                                                                               www.iiste.org
ISSN 2222-1697 (Paper) ISSN 2222-2847 (Online)
Vol 2, No 6, 2011
                                              Table – 1 : Test of Order of Integration
                 Augmented Dickey-Fuller Test                         Phillips-Parron Test                          KPSS Test

                          ADF Test Stat                                  P-P Test Stat                                 I(1)
                                                                                                            I(0)                I(2)   Critic
Variabl      I(0)              I(1)            I(2)          I(0)              I(1)              I(2)                                   al
  es       t-       pro      t-       pro    t-       pro    Adj     pro Adj t-     pro      A      pro                                Value
          stat       b      stat       b    stat       b    t-stat    b    stat      b       dj       b                         LM     @1%
                                                                                                            LM         LM
                                                                                             t-                                 Stat
                                                                                                            Stat.      Stat.
                                                                                             sta                                 .
                                                                                             t
DSI       2.12      1.0      -        0.0                   1.73     1.0     -      0.0                     0.22       0.16
           2         0     8.68        0                     58       0    8.676     0                       40         49
                             7                                               1
DY          -       0.6      -        0.0                     -      0.6     -      0.0                     0.11       0.09
          1.80       9     10.0        0                    1.97      1    10.09     0                       97         33
           2                8                                07             42
MKTPE       -       0.3      -        0.0                     -      0.1     -      0.0                     0.10       0.03
                                                                                                                                       0.2160
          2.53       1     10.3        0                    2.82      9    10.35     0                       54         48
                                                                                                                                         00
           4                2                                36             71
MAMC      2.87      1.0      -        0.9   0.99      0.0   7.21     1.0     -      0.0                     0.29       0.23     0.16
AP (-1)    5         0     0.05        9     5         2     44       0    5.410     0                       15         83       2
                             2                                              07
MATV      3.76      1.0      -        0.0                   2.73     1.0     -      0.0                     0.32       0.16
M (-1)     1         0     12.8        0                     48       0    12.88     0                       37         35
                            8                                               01


                             Table 2: VAR Lag Order Selection Criteria
Endogenous variables: DSI DY MKTPE MAMCAP(-1) MATVM(-1)
   Lag        LogL             LR           FPE             AIC                                             SC                    HQ
    0      -6965.464          NA          1.15e+43       113.3409                                         113.4552              113.3873
    1      -6209.902        1437.410      7.98e+37       101.4618                                         102.1477*             101.7404
    2      -6170.841        71.13549      6.36e+37       101.2332                                         102.4907              101.7440
    3      -6129.243        72.37335      4.88e+37       100.9633                                         102.7924              101.7063*
    4      -6101.540        45.94643      4.72e+37       100.9194                                         103.3200              101.8945
    5      -6053.447        75.85373      3.29e+37       100.5439                                         103.5161              101.7512
    6      -6025.583        41.68369      3.21e+37       100.4973                                         104.0411              101.9368
    7      -5990.210        50.03936*     2.81e+37*      100.3286*                                        104.4440              102.0003
    8      -5973.336        22.49892      3.35e+37       100.4607                                         105.1477              102.3646


11 | P a g e
Research Journal of Finance and Accounting                                                  www.iiste.org
ISSN 2222-1697 (Paper) ISSN 2222-2847 (Online)
Vol 2, No 6, 2011
                                Table 3: VAR Residual Serial Correlation LM Tests
                               Null Hypothesis: no serial correlation at lag order h
                                 Lags        LM-Stat                      Prob
                                    1        56.78838                   0.0003
                                    2        74.87943                   0.0000
                                    3        32.52651                   0.1433
                                    4        58.81361                   0.0002
                                    5        75.28658                   0.0000
                                    6        74.50472                   0.0000
                                    7        26.84967                   0.3634
                                    8        43.85127                   0.0113
                                    9        29.59949                   0.2396
                                   10        52.47458                   0.0010
                                   11        43.14681                   0.0135
                                   12        45.68855                   0.0070


           Table- 4 : Unrestricted Cointegration Rank Test (Trace) and (Maximum Eigenvalue)
                                                    0.05              Max-Eigen        0.05
  Hypothesized No. of CE(s)    Trace Statistic                Prob.**                              Prob.**
                                               Critical Value           Statistic Critical Value
           None *                148.0925        69.81889     0.0000 61.06181       33.87687       0.0000
        At most 1 *              87.03072        47.85613     0.0000 41.14278       27.58434       0.0005
        At most 2 *              45.88794        29.79707     0.0003 31.94995       21.13162       0.0010
         At most 3               13.93798        15.49471     0.0847 13.88762       14.26460       0.0573
         At most 4               0.050363        3.841466     0.8224 0.050363       3.841466       0.8224


                                  Table 5 :T-Y Granger Causality Test
                          Direction of Causality             df.      Chi-sq.           Prob.
                DSI                 ~       DY                       11.81580          0.1068
                DY                          DSI               7
                                    ~                                3.534857          0.8315
                DSI                 →       MKTPE                    15.41360          0.0310
                MKTPE                       DSI               7
                                    →                                17.40174          0.0150
                DSI                 →       MAMCAP(-1)               19.10271          0.0079
                MAMCAP(-1)                  DSI               7
                                    ~                                10.11659          0.1821
                DSI                 →       MATVM(-1)                44.02571          0.0000
                MATVM(-1)                   DSI               7
                                    →                                20.17998          0.0052
                * sig. at 5 percent level


12 | P a g e

Más contenido relacionado

La actualidad más candente

An empirical study of macroeconomic factors and stock market an indian persp...
An empirical study of macroeconomic factors and stock market  an indian persp...An empirical study of macroeconomic factors and stock market  an indian persp...
An empirical study of macroeconomic factors and stock market an indian persp...Saurabh Yadav
 
Determinants of stock prices in dhaka stock exchange (dse),
Determinants of stock prices in dhaka stock exchange (dse),Determinants of stock prices in dhaka stock exchange (dse),
Determinants of stock prices in dhaka stock exchange (dse),Alexander Decker
 
IMPACT OF LEVERAGE ON FIRM’S INVESTMENT DECISION OF FOOD - BEVERAGE INDUSTRY.
IMPACT OF LEVERAGE ON FIRM’S INVESTMENT DECISION  OF FOOD - BEVERAGE INDUSTRY.IMPACT OF LEVERAGE ON FIRM’S INVESTMENT DECISION  OF FOOD - BEVERAGE INDUSTRY.
IMPACT OF LEVERAGE ON FIRM’S INVESTMENT DECISION OF FOOD - BEVERAGE INDUSTRY.Nghiên Cứu Định Lượng
 
A study regarding analyzing recessionary impact on fundamental determinants o...
A study regarding analyzing recessionary impact on fundamental determinants o...A study regarding analyzing recessionary impact on fundamental determinants o...
A study regarding analyzing recessionary impact on fundamental determinants o...Alexander Decker
 
11.a causal relationship between stock indices and exchange rates empirical e...
11.a causal relationship between stock indices and exchange rates empirical e...11.a causal relationship between stock indices and exchange rates empirical e...
11.a causal relationship between stock indices and exchange rates empirical e...Alexander Decker
 
A causal relationship between stock indices and exchange rates empirical evid...
A causal relationship between stock indices and exchange rates empirical evid...A causal relationship between stock indices and exchange rates empirical evid...
A causal relationship between stock indices and exchange rates empirical evid...Alexander Decker
 
Macroeconomic effects on the stock market
Macroeconomic effects on the stock marketMacroeconomic effects on the stock market
Macroeconomic effects on the stock marketWINGFEI CHAN
 
Dividend policy and share price volatility in kenya
Dividend policy and share price volatility in kenyaDividend policy and share price volatility in kenya
Dividend policy and share price volatility in kenyaAlexander Decker
 
11.[28 38]distribution of risk and return a statistical test of normality on ...
11.[28 38]distribution of risk and return a statistical test of normality on ...11.[28 38]distribution of risk and return a statistical test of normality on ...
11.[28 38]distribution of risk and return a statistical test of normality on ...Alexander Decker
 
Impact of profitability, bank and macroeconomic factors on the market capital...
Impact of profitability, bank and macroeconomic factors on the market capital...Impact of profitability, bank and macroeconomic factors on the market capital...
Impact of profitability, bank and macroeconomic factors on the market capital...inventionjournals
 
Determinants of Share Prices of listed Commercial Banks in Pakistan
Determinants of Share Prices of listed Commercial Banks in PakistanDeterminants of Share Prices of listed Commercial Banks in Pakistan
Determinants of Share Prices of listed Commercial Banks in Pakistaniosrjce
 
11.exchange rate volatility and stock market behaviour the nigerian experience
11.exchange rate volatility and stock market behaviour the nigerian experience11.exchange rate volatility and stock market behaviour the nigerian experience
11.exchange rate volatility and stock market behaviour the nigerian experienceAlexander Decker
 
11.the impact of macroeconomic indicators on stock prices in nigeria
11.the impact of macroeconomic indicators on stock prices in nigeria11.the impact of macroeconomic indicators on stock prices in nigeria
11.the impact of macroeconomic indicators on stock prices in nigeriaAlexander Decker
 
1.[1 14]the impact of macroeconomic indicators on stock prices in nigeria
1.[1 14]the impact of macroeconomic indicators on stock prices in nigeria1.[1 14]the impact of macroeconomic indicators on stock prices in nigeria
1.[1 14]the impact of macroeconomic indicators on stock prices in nigeriaAlexander Decker
 
48 variable macroeconomics on stock return 25 ags 2019
48  variable macroeconomics on stock return 25 ags 201948  variable macroeconomics on stock return 25 ags 2019
48 variable macroeconomics on stock return 25 ags 2019Aminullah Assagaf
 
Final report
Final reportFinal report
Final reportroshan a
 

La actualidad más candente (18)

An empirical study of macroeconomic factors and stock market an indian persp...
An empirical study of macroeconomic factors and stock market  an indian persp...An empirical study of macroeconomic factors and stock market  an indian persp...
An empirical study of macroeconomic factors and stock market an indian persp...
 
Determinants of stock prices in dhaka stock exchange (dse),
Determinants of stock prices in dhaka stock exchange (dse),Determinants of stock prices in dhaka stock exchange (dse),
Determinants of stock prices in dhaka stock exchange (dse),
 
IMPACT OF LEVERAGE ON FIRM’S INVESTMENT DECISION OF FOOD - BEVERAGE INDUSTRY.
IMPACT OF LEVERAGE ON FIRM’S INVESTMENT DECISION  OF FOOD - BEVERAGE INDUSTRY.IMPACT OF LEVERAGE ON FIRM’S INVESTMENT DECISION  OF FOOD - BEVERAGE INDUSTRY.
IMPACT OF LEVERAGE ON FIRM’S INVESTMENT DECISION OF FOOD - BEVERAGE INDUSTRY.
 
Chinh sach tien te va gia chung khoan
Chinh sach tien te va gia chung khoanChinh sach tien te va gia chung khoan
Chinh sach tien te va gia chung khoan
 
A study regarding analyzing recessionary impact on fundamental determinants o...
A study regarding analyzing recessionary impact on fundamental determinants o...A study regarding analyzing recessionary impact on fundamental determinants o...
A study regarding analyzing recessionary impact on fundamental determinants o...
 
11.a causal relationship between stock indices and exchange rates empirical e...
11.a causal relationship between stock indices and exchange rates empirical e...11.a causal relationship between stock indices and exchange rates empirical e...
11.a causal relationship between stock indices and exchange rates empirical e...
 
A causal relationship between stock indices and exchange rates empirical evid...
A causal relationship between stock indices and exchange rates empirical evid...A causal relationship between stock indices and exchange rates empirical evid...
A causal relationship between stock indices and exchange rates empirical evid...
 
Macroeconomic effects on the stock market
Macroeconomic effects on the stock marketMacroeconomic effects on the stock market
Macroeconomic effects on the stock market
 
Dividend policy and share price volatility in kenya
Dividend policy and share price volatility in kenyaDividend policy and share price volatility in kenya
Dividend policy and share price volatility in kenya
 
11.[28 38]distribution of risk and return a statistical test of normality on ...
11.[28 38]distribution of risk and return a statistical test of normality on ...11.[28 38]distribution of risk and return a statistical test of normality on ...
11.[28 38]distribution of risk and return a statistical test of normality on ...
 
Impact of profitability, bank and macroeconomic factors on the market capital...
Impact of profitability, bank and macroeconomic factors on the market capital...Impact of profitability, bank and macroeconomic factors on the market capital...
Impact of profitability, bank and macroeconomic factors on the market capital...
 
Determinants of Share Prices of listed Commercial Banks in Pakistan
Determinants of Share Prices of listed Commercial Banks in PakistanDeterminants of Share Prices of listed Commercial Banks in Pakistan
Determinants of Share Prices of listed Commercial Banks in Pakistan
 
11.exchange rate volatility and stock market behaviour the nigerian experience
11.exchange rate volatility and stock market behaviour the nigerian experience11.exchange rate volatility and stock market behaviour the nigerian experience
11.exchange rate volatility and stock market behaviour the nigerian experience
 
11.the impact of macroeconomic indicators on stock prices in nigeria
11.the impact of macroeconomic indicators on stock prices in nigeria11.the impact of macroeconomic indicators on stock prices in nigeria
11.the impact of macroeconomic indicators on stock prices in nigeria
 
1.[1 14]the impact of macroeconomic indicators on stock prices in nigeria
1.[1 14]the impact of macroeconomic indicators on stock prices in nigeria1.[1 14]the impact of macroeconomic indicators on stock prices in nigeria
1.[1 14]the impact of macroeconomic indicators on stock prices in nigeria
 
The Influences of Company's Internal Factors and Macroeconomics against the S...
The Influences of Company's Internal Factors and Macroeconomics against the S...The Influences of Company's Internal Factors and Macroeconomics against the S...
The Influences of Company's Internal Factors and Macroeconomics against the S...
 
48 variable macroeconomics on stock return 25 ags 2019
48  variable macroeconomics on stock return 25 ags 201948  variable macroeconomics on stock return 25 ags 2019
48 variable macroeconomics on stock return 25 ags 2019
 
Final report
Final reportFinal report
Final report
 

Destacado

Economic indicators and stock market performance an empirical case of india
Economic indicators and stock market performance an empirical case of indiaEconomic indicators and stock market performance an empirical case of india
Economic indicators and stock market performance an empirical case of indiaIAEME Publication
 
Impact of MacroEconomic Variables on National Stock Exchange
Impact of MacroEconomic  Variables on National Stock ExchangeImpact of MacroEconomic  Variables on National Stock Exchange
Impact of MacroEconomic Variables on National Stock ExchangeWaquar Khan
 
Impact of macroeconomic variables on stock returns
Impact of macroeconomic variables on stock returnsImpact of macroeconomic variables on stock returns
Impact of macroeconomic variables on stock returnsMuhammad Mansoor
 
Sharpe’s single index model
Sharpe’s single index modelSharpe’s single index model
Sharpe’s single index modelRavi kumar
 
Portfolio theory-sharpe-index-model 1
Portfolio theory-sharpe-index-model 1Portfolio theory-sharpe-index-model 1
Portfolio theory-sharpe-index-model 1abhishek rane
 
3. sharpe index model
3. sharpe  index model3. sharpe  index model
3. sharpe index modelAkash Bakshi
 
Markowitz - sharpes and CAPM
Markowitz - sharpes and CAPMMarkowitz - sharpes and CAPM
Markowitz - sharpes and CAPMDeepika S.R.
 
Sharpe index model
Sharpe index modelSharpe index model
Sharpe index modelAshwini Das
 

Destacado (8)

Economic indicators and stock market performance an empirical case of india
Economic indicators and stock market performance an empirical case of indiaEconomic indicators and stock market performance an empirical case of india
Economic indicators and stock market performance an empirical case of india
 
Impact of MacroEconomic Variables on National Stock Exchange
Impact of MacroEconomic  Variables on National Stock ExchangeImpact of MacroEconomic  Variables on National Stock Exchange
Impact of MacroEconomic Variables on National Stock Exchange
 
Impact of macroeconomic variables on stock returns
Impact of macroeconomic variables on stock returnsImpact of macroeconomic variables on stock returns
Impact of macroeconomic variables on stock returns
 
Sharpe’s single index model
Sharpe’s single index modelSharpe’s single index model
Sharpe’s single index model
 
Portfolio theory-sharpe-index-model 1
Portfolio theory-sharpe-index-model 1Portfolio theory-sharpe-index-model 1
Portfolio theory-sharpe-index-model 1
 
3. sharpe index model
3. sharpe  index model3. sharpe  index model
3. sharpe index model
 
Markowitz - sharpes and CAPM
Markowitz - sharpes and CAPMMarkowitz - sharpes and CAPM
Markowitz - sharpes and CAPM
 
Sharpe index model
Sharpe index modelSharpe index model
Sharpe index model
 

Similar a 1.[1 12]stock prices and microeconomic variables

4. 37 52 the stock price paper
4.  37 52 the stock price paper4.  37 52 the stock price paper
4. 37 52 the stock price paperAlexander Decker
 
1415-Article Text-5928-1-10-20220222.pdf
1415-Article Text-5928-1-10-20220222.pdf1415-Article Text-5928-1-10-20220222.pdf
1415-Article Text-5928-1-10-20220222.pdfDR BHADRAPPA HARALAYYA
 
Dividend_Announcement_and_Share_Prices_A-7.pdf
Dividend_Announcement_and_Share_Prices_A-7.pdfDividend_Announcement_and_Share_Prices_A-7.pdf
Dividend_Announcement_and_Share_Prices_A-7.pdfssuser9755371
 
An empirical study on the relationship between stock market index and the nat...
An empirical study on the relationship between stock market index and the nat...An empirical study on the relationship between stock market index and the nat...
An empirical study on the relationship between stock market index and the nat...Alexander Decker
 
Relationships between indian and other south east stock markets
Relationships between indian and other south east stock marketsRelationships between indian and other south east stock markets
Relationships between indian and other south east stock marketsAlexander Decker
 
11.relationships between indian and other south east stock markets
11.relationships between indian and other south east stock markets11.relationships between indian and other south east stock markets
11.relationships between indian and other south east stock marketsAlexander Decker
 
Macroeconomic and Institutional Determinants of Capital Market Performance in...
Macroeconomic and Institutional Determinants of Capital Market Performance in...Macroeconomic and Institutional Determinants of Capital Market Performance in...
Macroeconomic and Institutional Determinants of Capital Market Performance in...Fakir Tajul Islam
 
A study regarding analyzing recessionary impact on fundamental determinants o...
A study regarding analyzing recessionary impact on fundamental determinants o...A study regarding analyzing recessionary impact on fundamental determinants o...
A study regarding analyzing recessionary impact on fundamental determinants o...Alexander Decker
 
11.relationships between indian and other south east stock markets
11.relationships between indian and other south east stock markets11.relationships between indian and other south east stock markets
11.relationships between indian and other south east stock marketsAlexander Decker
 
Economic indicators and stock market performance an empirical case of india
Economic indicators and stock market performance an empirical case of indiaEconomic indicators and stock market performance an empirical case of india
Economic indicators and stock market performance an empirical case of indiaIAEME Publication
 
Determinants of equity share prices of the listed company in dhaka stock exch...
Determinants of equity share prices of the listed company in dhaka stock exch...Determinants of equity share prices of the listed company in dhaka stock exch...
Determinants of equity share prices of the listed company in dhaka stock exch...MD. Walid Hossain
 
Impact on select macro economic variables on the movement of bse sensex
Impact on select macro economic variables on the movement of bse sensexImpact on select macro economic variables on the movement of bse sensex
Impact on select macro economic variables on the movement of bse sensexMAMPIYACHANDRA
 
Analysis of Fundamental Factors, Foreign Exchange and Interest Rate on Stock ...
Analysis of Fundamental Factors, Foreign Exchange and Interest Rate on Stock ...Analysis of Fundamental Factors, Foreign Exchange and Interest Rate on Stock ...
Analysis of Fundamental Factors, Foreign Exchange and Interest Rate on Stock ...inventionjournals
 
Inter Linkage between Macroeconomic Variables and Stock Indices Using Granger...
Inter Linkage between Macroeconomic Variables and Stock Indices Using Granger...Inter Linkage between Macroeconomic Variables and Stock Indices Using Granger...
Inter Linkage between Macroeconomic Variables and Stock Indices Using Granger...ijtsrd
 
Empirical analysis of the relationship between stock market returns and macro...
Empirical analysis of the relationship between stock market returns and macro...Empirical analysis of the relationship between stock market returns and macro...
Empirical analysis of the relationship between stock market returns and macro...Alexander Decker
 

Similar a 1.[1 12]stock prices and microeconomic variables (20)

4. 37 52 the stock price paper
4.  37 52 the stock price paper4.  37 52 the stock price paper
4. 37 52 the stock price paper
 
B331321.pdf
B331321.pdfB331321.pdf
B331321.pdf
 
B331321.pdf
B331321.pdfB331321.pdf
B331321.pdf
 
1415-Article Text-5928-1-10-20220222.pdf
1415-Article Text-5928-1-10-20220222.pdf1415-Article Text-5928-1-10-20220222.pdf
1415-Article Text-5928-1-10-20220222.pdf
 
Dividend_Announcement_and_Share_Prices_A-7.pdf
Dividend_Announcement_and_Share_Prices_A-7.pdfDividend_Announcement_and_Share_Prices_A-7.pdf
Dividend_Announcement_and_Share_Prices_A-7.pdf
 
An empirical study on the relationship between stock market index and the nat...
An empirical study on the relationship between stock market index and the nat...An empirical study on the relationship between stock market index and the nat...
An empirical study on the relationship between stock market index and the nat...
 
Relationships between indian and other south east stock markets
Relationships between indian and other south east stock marketsRelationships between indian and other south east stock markets
Relationships between indian and other south east stock markets
 
11.relationships between indian and other south east stock markets
11.relationships between indian and other south east stock markets11.relationships between indian and other south east stock markets
11.relationships between indian and other south east stock markets
 
Macroeconomic and Institutional Determinants of Capital Market Performance in...
Macroeconomic and Institutional Determinants of Capital Market Performance in...Macroeconomic and Institutional Determinants of Capital Market Performance in...
Macroeconomic and Institutional Determinants of Capital Market Performance in...
 
Scope book (1)
Scope book (1)Scope book (1)
Scope book (1)
 
Scope book
Scope bookScope book
Scope book
 
A study regarding analyzing recessionary impact on fundamental determinants o...
A study regarding analyzing recessionary impact on fundamental determinants o...A study regarding analyzing recessionary impact on fundamental determinants o...
A study regarding analyzing recessionary impact on fundamental determinants o...
 
11.relationships between indian and other south east stock markets
11.relationships between indian and other south east stock markets11.relationships between indian and other south east stock markets
11.relationships between indian and other south east stock markets
 
Economic indicators and stock market performance an empirical case of india
Economic indicators and stock market performance an empirical case of indiaEconomic indicators and stock market performance an empirical case of india
Economic indicators and stock market performance an empirical case of india
 
Determinants of equity share prices of the listed company in dhaka stock exch...
Determinants of equity share prices of the listed company in dhaka stock exch...Determinants of equity share prices of the listed company in dhaka stock exch...
Determinants of equity share prices of the listed company in dhaka stock exch...
 
Impact on select macro economic variables on the movement of bse sensex
Impact on select macro economic variables on the movement of bse sensexImpact on select macro economic variables on the movement of bse sensex
Impact on select macro economic variables on the movement of bse sensex
 
Analysis of Fundamental Factors, Foreign Exchange and Interest Rate on Stock ...
Analysis of Fundamental Factors, Foreign Exchange and Interest Rate on Stock ...Analysis of Fundamental Factors, Foreign Exchange and Interest Rate on Stock ...
Analysis of Fundamental Factors, Foreign Exchange and Interest Rate on Stock ...
 
Inter Linkage between Macroeconomic Variables and Stock Indices Using Granger...
Inter Linkage between Macroeconomic Variables and Stock Indices Using Granger...Inter Linkage between Macroeconomic Variables and Stock Indices Using Granger...
Inter Linkage between Macroeconomic Variables and Stock Indices Using Granger...
 
Empirical analysis of the relationship between stock market returns and macro...
Empirical analysis of the relationship between stock market returns and macro...Empirical analysis of the relationship between stock market returns and macro...
Empirical analysis of the relationship between stock market returns and macro...
 
Interplay Between Macroeconomic Factors and Equity Premium: Evidence Pakistan...
Interplay Between Macroeconomic Factors and Equity Premium: Evidence Pakistan...Interplay Between Macroeconomic Factors and Equity Premium: Evidence Pakistan...
Interplay Between Macroeconomic Factors and Equity Premium: Evidence Pakistan...
 

Más de Alexander Decker

Abnormalities of hormones and inflammatory cytokines in women affected with p...
Abnormalities of hormones and inflammatory cytokines in women affected with p...Abnormalities of hormones and inflammatory cytokines in women affected with p...
Abnormalities of hormones and inflammatory cytokines in women affected with p...Alexander Decker
 
A validation of the adverse childhood experiences scale in
A validation of the adverse childhood experiences scale inA validation of the adverse childhood experiences scale in
A validation of the adverse childhood experiences scale inAlexander Decker
 
A usability evaluation framework for b2 c e commerce websites
A usability evaluation framework for b2 c e commerce websitesA usability evaluation framework for b2 c e commerce websites
A usability evaluation framework for b2 c e commerce websitesAlexander Decker
 
A universal model for managing the marketing executives in nigerian banks
A universal model for managing the marketing executives in nigerian banksA universal model for managing the marketing executives in nigerian banks
A universal model for managing the marketing executives in nigerian banksAlexander Decker
 
A unique common fixed point theorems in generalized d
A unique common fixed point theorems in generalized dA unique common fixed point theorems in generalized d
A unique common fixed point theorems in generalized dAlexander Decker
 
A trends of salmonella and antibiotic resistance
A trends of salmonella and antibiotic resistanceA trends of salmonella and antibiotic resistance
A trends of salmonella and antibiotic resistanceAlexander Decker
 
A transformational generative approach towards understanding al-istifham
A transformational  generative approach towards understanding al-istifhamA transformational  generative approach towards understanding al-istifham
A transformational generative approach towards understanding al-istifhamAlexander Decker
 
A time series analysis of the determinants of savings in namibia
A time series analysis of the determinants of savings in namibiaA time series analysis of the determinants of savings in namibia
A time series analysis of the determinants of savings in namibiaAlexander Decker
 
A therapy for physical and mental fitness of school children
A therapy for physical and mental fitness of school childrenA therapy for physical and mental fitness of school children
A therapy for physical and mental fitness of school childrenAlexander Decker
 
A theory of efficiency for managing the marketing executives in nigerian banks
A theory of efficiency for managing the marketing executives in nigerian banksA theory of efficiency for managing the marketing executives in nigerian banks
A theory of efficiency for managing the marketing executives in nigerian banksAlexander Decker
 
A systematic evaluation of link budget for
A systematic evaluation of link budget forA systematic evaluation of link budget for
A systematic evaluation of link budget forAlexander Decker
 
A synthetic review of contraceptive supplies in punjab
A synthetic review of contraceptive supplies in punjabA synthetic review of contraceptive supplies in punjab
A synthetic review of contraceptive supplies in punjabAlexander Decker
 
A synthesis of taylor’s and fayol’s management approaches for managing market...
A synthesis of taylor’s and fayol’s management approaches for managing market...A synthesis of taylor’s and fayol’s management approaches for managing market...
A synthesis of taylor’s and fayol’s management approaches for managing market...Alexander Decker
 
A survey paper on sequence pattern mining with incremental
A survey paper on sequence pattern mining with incrementalA survey paper on sequence pattern mining with incremental
A survey paper on sequence pattern mining with incrementalAlexander Decker
 
A survey on live virtual machine migrations and its techniques
A survey on live virtual machine migrations and its techniquesA survey on live virtual machine migrations and its techniques
A survey on live virtual machine migrations and its techniquesAlexander Decker
 
A survey on data mining and analysis in hadoop and mongo db
A survey on data mining and analysis in hadoop and mongo dbA survey on data mining and analysis in hadoop and mongo db
A survey on data mining and analysis in hadoop and mongo dbAlexander Decker
 
A survey on challenges to the media cloud
A survey on challenges to the media cloudA survey on challenges to the media cloud
A survey on challenges to the media cloudAlexander Decker
 
A survey of provenance leveraged
A survey of provenance leveragedA survey of provenance leveraged
A survey of provenance leveragedAlexander Decker
 
A survey of private equity investments in kenya
A survey of private equity investments in kenyaA survey of private equity investments in kenya
A survey of private equity investments in kenyaAlexander Decker
 
A study to measures the financial health of
A study to measures the financial health ofA study to measures the financial health of
A study to measures the financial health ofAlexander Decker
 

Más de Alexander Decker (20)

Abnormalities of hormones and inflammatory cytokines in women affected with p...
Abnormalities of hormones and inflammatory cytokines in women affected with p...Abnormalities of hormones and inflammatory cytokines in women affected with p...
Abnormalities of hormones and inflammatory cytokines in women affected with p...
 
A validation of the adverse childhood experiences scale in
A validation of the adverse childhood experiences scale inA validation of the adverse childhood experiences scale in
A validation of the adverse childhood experiences scale in
 
A usability evaluation framework for b2 c e commerce websites
A usability evaluation framework for b2 c e commerce websitesA usability evaluation framework for b2 c e commerce websites
A usability evaluation framework for b2 c e commerce websites
 
A universal model for managing the marketing executives in nigerian banks
A universal model for managing the marketing executives in nigerian banksA universal model for managing the marketing executives in nigerian banks
A universal model for managing the marketing executives in nigerian banks
 
A unique common fixed point theorems in generalized d
A unique common fixed point theorems in generalized dA unique common fixed point theorems in generalized d
A unique common fixed point theorems in generalized d
 
A trends of salmonella and antibiotic resistance
A trends of salmonella and antibiotic resistanceA trends of salmonella and antibiotic resistance
A trends of salmonella and antibiotic resistance
 
A transformational generative approach towards understanding al-istifham
A transformational  generative approach towards understanding al-istifhamA transformational  generative approach towards understanding al-istifham
A transformational generative approach towards understanding al-istifham
 
A time series analysis of the determinants of savings in namibia
A time series analysis of the determinants of savings in namibiaA time series analysis of the determinants of savings in namibia
A time series analysis of the determinants of savings in namibia
 
A therapy for physical and mental fitness of school children
A therapy for physical and mental fitness of school childrenA therapy for physical and mental fitness of school children
A therapy for physical and mental fitness of school children
 
A theory of efficiency for managing the marketing executives in nigerian banks
A theory of efficiency for managing the marketing executives in nigerian banksA theory of efficiency for managing the marketing executives in nigerian banks
A theory of efficiency for managing the marketing executives in nigerian banks
 
A systematic evaluation of link budget for
A systematic evaluation of link budget forA systematic evaluation of link budget for
A systematic evaluation of link budget for
 
A synthetic review of contraceptive supplies in punjab
A synthetic review of contraceptive supplies in punjabA synthetic review of contraceptive supplies in punjab
A synthetic review of contraceptive supplies in punjab
 
A synthesis of taylor’s and fayol’s management approaches for managing market...
A synthesis of taylor’s and fayol’s management approaches for managing market...A synthesis of taylor’s and fayol’s management approaches for managing market...
A synthesis of taylor’s and fayol’s management approaches for managing market...
 
A survey paper on sequence pattern mining with incremental
A survey paper on sequence pattern mining with incrementalA survey paper on sequence pattern mining with incremental
A survey paper on sequence pattern mining with incremental
 
A survey on live virtual machine migrations and its techniques
A survey on live virtual machine migrations and its techniquesA survey on live virtual machine migrations and its techniques
A survey on live virtual machine migrations and its techniques
 
A survey on data mining and analysis in hadoop and mongo db
A survey on data mining and analysis in hadoop and mongo dbA survey on data mining and analysis in hadoop and mongo db
A survey on data mining and analysis in hadoop and mongo db
 
A survey on challenges to the media cloud
A survey on challenges to the media cloudA survey on challenges to the media cloud
A survey on challenges to the media cloud
 
A survey of provenance leveraged
A survey of provenance leveragedA survey of provenance leveraged
A survey of provenance leveraged
 
A survey of private equity investments in kenya
A survey of private equity investments in kenyaA survey of private equity investments in kenya
A survey of private equity investments in kenya
 
A study to measures the financial health of
A study to measures the financial health ofA study to measures the financial health of
A study to measures the financial health of
 

Último

Welding Electrode Making Machine By Deccan Dynamics
Welding Electrode Making Machine By Deccan DynamicsWelding Electrode Making Machine By Deccan Dynamics
Welding Electrode Making Machine By Deccan DynamicsIndiaMART InterMESH Limited
 
Fordham -How effective decision-making is within the IT department - Analysis...
Fordham -How effective decision-making is within the IT department - Analysis...Fordham -How effective decision-making is within the IT department - Analysis...
Fordham -How effective decision-making is within the IT department - Analysis...Peter Ward
 
PSCC - Capability Statement Presentation
PSCC - Capability Statement PresentationPSCC - Capability Statement Presentation
PSCC - Capability Statement PresentationAnamaria Contreras
 
Memorándum de Entendimiento (MoU) entre Codelco y SQM
Memorándum de Entendimiento (MoU) entre Codelco y SQMMemorándum de Entendimiento (MoU) entre Codelco y SQM
Memorándum de Entendimiento (MoU) entre Codelco y SQMVoces Mineras
 
Onemonitar Android Spy App Features: Explore Advanced Monitoring Capabilities
Onemonitar Android Spy App Features: Explore Advanced Monitoring CapabilitiesOnemonitar Android Spy App Features: Explore Advanced Monitoring Capabilities
Onemonitar Android Spy App Features: Explore Advanced Monitoring CapabilitiesOne Monitar
 
How To Simplify Your Scheduling with AI Calendarfly The Hassle-Free Online Bo...
How To Simplify Your Scheduling with AI Calendarfly The Hassle-Free Online Bo...How To Simplify Your Scheduling with AI Calendarfly The Hassle-Free Online Bo...
How To Simplify Your Scheduling with AI Calendarfly The Hassle-Free Online Bo...SOFTTECHHUB
 
TriStar Gold Corporate Presentation - April 2024
TriStar Gold Corporate Presentation - April 2024TriStar Gold Corporate Presentation - April 2024
TriStar Gold Corporate Presentation - April 2024Adnet Communications
 
How Generative AI Is Transforming Your Business | Byond Growth Insights | Apr...
How Generative AI Is Transforming Your Business | Byond Growth Insights | Apr...How Generative AI Is Transforming Your Business | Byond Growth Insights | Apr...
How Generative AI Is Transforming Your Business | Byond Growth Insights | Apr...Hector Del Castillo, CPM, CPMM
 
Planetary and Vedic Yagyas Bring Positive Impacts in Life
Planetary and Vedic Yagyas Bring Positive Impacts in LifePlanetary and Vedic Yagyas Bring Positive Impacts in Life
Planetary and Vedic Yagyas Bring Positive Impacts in LifeBhavana Pujan Kendra
 
Guide Complete Set of Residential Architectural Drawings PDF
Guide Complete Set of Residential Architectural Drawings PDFGuide Complete Set of Residential Architectural Drawings PDF
Guide Complete Set of Residential Architectural Drawings PDFChandresh Chudasama
 
trending-flavors-and-ingredients-in-salty-snacks-us-2024_Redacted-V2.pdf
trending-flavors-and-ingredients-in-salty-snacks-us-2024_Redacted-V2.pdftrending-flavors-and-ingredients-in-salty-snacks-us-2024_Redacted-V2.pdf
trending-flavors-and-ingredients-in-salty-snacks-us-2024_Redacted-V2.pdfMintel Group
 
Types of Cyberattacks - ASG I.T. Consulting.pdf
Types of Cyberattacks - ASG I.T. Consulting.pdfTypes of Cyberattacks - ASG I.T. Consulting.pdf
Types of Cyberattacks - ASG I.T. Consulting.pdfASGITConsulting
 
Strategic Project Finance Essentials: A Project Manager’s Guide to Financial ...
Strategic Project Finance Essentials: A Project Manager’s Guide to Financial ...Strategic Project Finance Essentials: A Project Manager’s Guide to Financial ...
Strategic Project Finance Essentials: A Project Manager’s Guide to Financial ...Aggregage
 
Darshan Hiranandani [News About Next CEO].pdf
Darshan Hiranandani [News About Next CEO].pdfDarshan Hiranandani [News About Next CEO].pdf
Darshan Hiranandani [News About Next CEO].pdfShashank Mehta
 
20200128 Ethical by Design - Whitepaper.pdf
20200128 Ethical by Design - Whitepaper.pdf20200128 Ethical by Design - Whitepaper.pdf
20200128 Ethical by Design - Whitepaper.pdfChris Skinner
 
WSMM Media and Entertainment Feb_March_Final.pdf
WSMM Media and Entertainment Feb_March_Final.pdfWSMM Media and Entertainment Feb_March_Final.pdf
WSMM Media and Entertainment Feb_March_Final.pdfJamesConcepcion7
 
Healthcare Feb. & Mar. Healthcare Newsletter
Healthcare Feb. & Mar. Healthcare NewsletterHealthcare Feb. & Mar. Healthcare Newsletter
Healthcare Feb. & Mar. Healthcare NewsletterJamesConcepcion7
 
Traction part 2 - EOS Model JAX Bridges.
Traction part 2 - EOS Model JAX Bridges.Traction part 2 - EOS Model JAX Bridges.
Traction part 2 - EOS Model JAX Bridges.Anamaria Contreras
 
1911 Gold Corporate Presentation Apr 2024.pdf
1911 Gold Corporate Presentation Apr 2024.pdf1911 Gold Corporate Presentation Apr 2024.pdf
1911 Gold Corporate Presentation Apr 2024.pdfShaun Heinrichs
 

Último (20)

Welding Electrode Making Machine By Deccan Dynamics
Welding Electrode Making Machine By Deccan DynamicsWelding Electrode Making Machine By Deccan Dynamics
Welding Electrode Making Machine By Deccan Dynamics
 
Fordham -How effective decision-making is within the IT department - Analysis...
Fordham -How effective decision-making is within the IT department - Analysis...Fordham -How effective decision-making is within the IT department - Analysis...
Fordham -How effective decision-making is within the IT department - Analysis...
 
PSCC - Capability Statement Presentation
PSCC - Capability Statement PresentationPSCC - Capability Statement Presentation
PSCC - Capability Statement Presentation
 
Memorándum de Entendimiento (MoU) entre Codelco y SQM
Memorándum de Entendimiento (MoU) entre Codelco y SQMMemorándum de Entendimiento (MoU) entre Codelco y SQM
Memorándum de Entendimiento (MoU) entre Codelco y SQM
 
Onemonitar Android Spy App Features: Explore Advanced Monitoring Capabilities
Onemonitar Android Spy App Features: Explore Advanced Monitoring CapabilitiesOnemonitar Android Spy App Features: Explore Advanced Monitoring Capabilities
Onemonitar Android Spy App Features: Explore Advanced Monitoring Capabilities
 
How To Simplify Your Scheduling with AI Calendarfly The Hassle-Free Online Bo...
How To Simplify Your Scheduling with AI Calendarfly The Hassle-Free Online Bo...How To Simplify Your Scheduling with AI Calendarfly The Hassle-Free Online Bo...
How To Simplify Your Scheduling with AI Calendarfly The Hassle-Free Online Bo...
 
TriStar Gold Corporate Presentation - April 2024
TriStar Gold Corporate Presentation - April 2024TriStar Gold Corporate Presentation - April 2024
TriStar Gold Corporate Presentation - April 2024
 
How Generative AI Is Transforming Your Business | Byond Growth Insights | Apr...
How Generative AI Is Transforming Your Business | Byond Growth Insights | Apr...How Generative AI Is Transforming Your Business | Byond Growth Insights | Apr...
How Generative AI Is Transforming Your Business | Byond Growth Insights | Apr...
 
Planetary and Vedic Yagyas Bring Positive Impacts in Life
Planetary and Vedic Yagyas Bring Positive Impacts in LifePlanetary and Vedic Yagyas Bring Positive Impacts in Life
Planetary and Vedic Yagyas Bring Positive Impacts in Life
 
Guide Complete Set of Residential Architectural Drawings PDF
Guide Complete Set of Residential Architectural Drawings PDFGuide Complete Set of Residential Architectural Drawings PDF
Guide Complete Set of Residential Architectural Drawings PDF
 
trending-flavors-and-ingredients-in-salty-snacks-us-2024_Redacted-V2.pdf
trending-flavors-and-ingredients-in-salty-snacks-us-2024_Redacted-V2.pdftrending-flavors-and-ingredients-in-salty-snacks-us-2024_Redacted-V2.pdf
trending-flavors-and-ingredients-in-salty-snacks-us-2024_Redacted-V2.pdf
 
Types of Cyberattacks - ASG I.T. Consulting.pdf
Types of Cyberattacks - ASG I.T. Consulting.pdfTypes of Cyberattacks - ASG I.T. Consulting.pdf
Types of Cyberattacks - ASG I.T. Consulting.pdf
 
Strategic Project Finance Essentials: A Project Manager’s Guide to Financial ...
Strategic Project Finance Essentials: A Project Manager’s Guide to Financial ...Strategic Project Finance Essentials: A Project Manager’s Guide to Financial ...
Strategic Project Finance Essentials: A Project Manager’s Guide to Financial ...
 
Darshan Hiranandani [News About Next CEO].pdf
Darshan Hiranandani [News About Next CEO].pdfDarshan Hiranandani [News About Next CEO].pdf
Darshan Hiranandani [News About Next CEO].pdf
 
20200128 Ethical by Design - Whitepaper.pdf
20200128 Ethical by Design - Whitepaper.pdf20200128 Ethical by Design - Whitepaper.pdf
20200128 Ethical by Design - Whitepaper.pdf
 
WSMM Media and Entertainment Feb_March_Final.pdf
WSMM Media and Entertainment Feb_March_Final.pdfWSMM Media and Entertainment Feb_March_Final.pdf
WSMM Media and Entertainment Feb_March_Final.pdf
 
The Bizz Quiz-E-Summit-E-Cell-IITPatna.pptx
The Bizz Quiz-E-Summit-E-Cell-IITPatna.pptxThe Bizz Quiz-E-Summit-E-Cell-IITPatna.pptx
The Bizz Quiz-E-Summit-E-Cell-IITPatna.pptx
 
Healthcare Feb. & Mar. Healthcare Newsletter
Healthcare Feb. & Mar. Healthcare NewsletterHealthcare Feb. & Mar. Healthcare Newsletter
Healthcare Feb. & Mar. Healthcare Newsletter
 
Traction part 2 - EOS Model JAX Bridges.
Traction part 2 - EOS Model JAX Bridges.Traction part 2 - EOS Model JAX Bridges.
Traction part 2 - EOS Model JAX Bridges.
 
1911 Gold Corporate Presentation Apr 2024.pdf
1911 Gold Corporate Presentation Apr 2024.pdf1911 Gold Corporate Presentation Apr 2024.pdf
1911 Gold Corporate Presentation Apr 2024.pdf
 

1.[1 12]stock prices and microeconomic variables

  • 1. Research Journal of Finance and Accounting www.iiste.org ISSN 2222-1697 (Paper) ISSN 2222-2847 (Online) Vol 2, No 6, 2011 Stock Prices and Microeconomic Variables: T-Y Granger Causal Evidence From Dhaka Stock Exchange (DSE) Mohammad Bayezid Ali Department of Finance, Faculty of Business Studies Jagannath University, Dhaka, Bangladesh. Tel: +88- 0171-5028151 E-mail: bayezid2001@gmail.com Abstract: This study examines the long-run equilibrium relationship and the direction of causality between stock prices at Dhaka Stock Exchange (DSE) and a set of four stock market oriented factors technically can be defined as microeconomic variables. Through utilizing the methods of Unit–Root tests, Johansen and Juselius (1990) Cointegration test and the long–run Granger Causality test proposed by Toda and Yamamoto (1995), we have investigated the long-run equilibrium relationship as well as causal relationships between the DSE all share price index (DSI) and the four microeconomic variables (i.e. market dividend yield, market price-earnings multiples, monthly average market capitalization and monthly average trading volume) using monthly data from the period January 2000 to December 2010. Significant findings include long-run equilibrium relationship among the variables under study. However, DSI, in any way, do not granger cause dividend yield; but DSI has bi-directional causal relation with market price- earning multiples and the first lag of the monthly average trading volume. On the other hand, unidirectional causality is found from DSI to the first lag of monthly average market capitalization but no causality is found from the opposite direction. Keywords: Microeconomic Variables, Unit Root Test, Cointegration, T-Y Granger Causality 1. Introduction: Many developing economies have attempted to develop capital markets, not only to raise capital rather capital markets are expected to meet two basic requirements: it should support industrialization through savings mobilization, investment funds allocation and maturity transformation. Besides, it must be safe and efficient in discharging the aforesaid function. In emerging economies like Bangladesh, stock markets are expected to function like a barometer of the financial performance of the organizations, efficiency of the financial markets and an icon of the development of economic activity. But such conditions do not usually exist due to prevalence of informal credit markets that tend to limit the capacity to mobilize financial savings, a low degree of ownership-management separation associated with the drawbacks of informational asymmetry and low level of accumulated of financial assets making maturity transformations difficult. Of course, these conditions differ widely from country to country (Ahmed, M.F. 2002). Investors invest in financial securities for competitive and satisfactory returns. They generally consider the ex-post and ex-ante returns of the securities while making and investment decision. This is because the investment in financial assets is always associated with different types of risks which are expected to be driven partly by company oriented factors, partly by industry factors, partly by market oriented factors and partly by macroeconomic factors. A clear knowledge about the volatility and sensitivity of each and every factor with respect to behavior of the stock prices help an investor to enjoy a competitive advantage over those who do not have such knowledge in the process of generating satisfactory return from investment in financial assets. That’s why researchers and academicians from all over the world have given their effort to identify those real factors that significantly contributes to the volatility of stock prices. They developed and explained different theories and models to identify the factors truly responsible to the volatility of stock prices. Their results also differ with respect to developed economy and those of emerging economy. This study is an attempt to identify long run equilibrium relationship as well as causal relationship between stock prices and a set of four market oriented variables which can be technically defined as microeconomic 1|Page
  • 2. Research Journal of Finance and Accounting www.iiste.org ISSN 2222-1697 (Paper) ISSN 2222-2847 (Online) Vol 2, No 6, 2011 variables in an emerging economy like Bangladesh. Bangladesh stock markets are represented by two stock exchanges, viz., Dhaka Stock Exchange (DSE) and Chittagong Stock Exchange (CSE). Both DSE and CSE are corporate bodies under Companies Act 1994. Although DSE was first established in 1954, its activities were suspended for a brief period from 1971 to 1976 due to introduction of a socialistic approach of development during this period. DSE started functioning with 9 listed companies in 1976; however the number has reached to 218 on 2010. The purpose of this paper is to scrutinize the long run equilibrium relationship as well as causal relation between the stock price and four market oriented variables technically known as microeconomic variables (i.e. market dividend yield, market price-earnings multiples, monthly average market capitalization and monthly average trading volume), in the context of the Bangladesh economy for the period from January 2000 to December 2010 (132 monthly observations) which also witnessed commencement of economic liberalization. The analysis of the interrelationship runs in terms of Efficient Market Hypothesis. The Efficient Market Hypothesis (semi-strong form), states that in a semi strong efficient market, everyone has perfect knowledge of all publicly available information and these are fully reflected in stock prices. Otherwise, the market participants are able to develop profitable trading rules and the stock market will not channel financial resources to the most productive sectors. The use of Granger Causality Test in examining market informational efficiency has recently been found unable to capture many of the time series properties. This paper makes use of the most recently available econometric technique, as proposed by Toda and Yamamoto (1995), which overcomes the technical problems associated with the traditional Granger Causality test. The contribution of this paper lies first of all, in focusing on stock market efficiency with respect to four stock market oriented variables commonly known as microeconomic variables which acts like determinant factors of equity returns and secondly in applying the Toda and Yamamoto causality technique which is superior to traditional Granger Causality Test. A survey of the existing literature including empirical evidences on the nature of causal relationships between stock prices and stock market oriented variables has been discussed in Section 2.0; Section 3.0 discuses the methodology employed and presents the variables and data descriptions. Section 4.0 analyses the empirical results followed by concluding observation in Section 5.0. 2. Review of Literature: A good number of empirical evidence is found in developed economies to examine stock price behavior and efficiency of the stock market. The evidence of stock price behavior and market efficiency using fundamental factors, industry factors and macroeconomic factors are still not satisfactory. Numerous empirical studies have been carried out to determine the stock market reactions to dividend announcements. Aharony and Swary (1980), Kwan (1981), Eades (1982), and Woolridge (1982), have found a significant positive association between announcement of dividend changes and the stock return, using the dividend announcement made in isolation of other firm news report. Gordon (1962 and 1963) and Walter (1963) support the dividend relevance doctrine. They suggest that dividend policy and investment policy are inter- linked. Investment policy can not be separated from dividend policy and the choice of an appropriate dividend policy affects the value of the firm. The leading proponents of the bird-in-the-hand theory (Gordon, 1962; and Lintner, 1962) found that stockholder value a dollar received in dividend more highly than dollar earnings retained. Therefore, dividend policy is relevant to the value of shares. Miller and Scholes (1981) have argued that the observed relationship between common stock returns and dividend yields as attributed to the favorable information contained in the knowledge that a firm will actually declare any dividend. Dhillon and Jhonson (1994) examine the stock and bond price reaction to dividend changes. The positive stock market response to dividend increases has several potential explanations, two of the more commonly discussed being information content and wealth redistribution between stockholders and bondholders. The evidence presented by Dhillon and Jhonson (1994) support the wealth redistribution hypothesis but does not rule out the information content hypothesis. Typically, Dhillon and Jhonson (1994) found that the bond price reaction to announcement of large dividend changes is opposite to the stock price reaction. Their result 2|Page
  • 3. Research Journal of Finance and Accounting www.iiste.org ISSN 2222-1697 (Paper) ISSN 2222-2847 (Online) Vol 2, No 6, 2011 differs from those of Handjinicolaou and Kalay (1984) who analyzed bond returns around dividend changes, and reported that the bond prices are not affected by dividend increases but the bond prices react negatively to divided reductions. Dhillon and Jhonson (1994) argue that their data supports the information content hypothesis. In contrast, Jayaraman and Shastri (1988) find insignificantly negative bond price reactions to dividend announcement. Ahmed M. F., (1991) investigates the dividend policy of the enterprises listed on Dhaka Stock Exchange (DSE) and to draw an analogy between that of Japanese and Bangladeshi enterprises. He comment that both dividend and retained earnings convey a return to the stockholders but in Bangladesh dividend rate demonstrate a declining trend while that of Japanese enterprises appears to be somewhat stable. Thus lower dividend yield in Bangladesh is attributable to both lower dividend rate and higher market capitalization while it is mostly due to higher market capitalization in Japan. He also found that dividend rate and yield in Bangladesh is lower than time deposit interest rate whereas in Japan although dividend yield is lower than interest rate but dividend rate is higher than that of. It is also found that companies paying regular dividend have higher P/E ratio than those paying irregularly which ultimately implies that market regards regular dividend policy and regular dividend stimulate the price. Ahmed M. F., (2000) investigate the relative importance of dividend and retained earnings to explain the stock price variation in Bangladesh. The findings reveal that both dividend and retained earnings influence the stock price and they have their impact ignoring their usual expectation of stronger dividend impact on non-growth industries and retained earnings impact on growth industries. In most cases, dividend hypothesis appears to be stronger than the retained earnings hypothesis. Dividends convey valuable information to the investors and it has been documented that the managers’ behavior also appears to be consistent with this view thus supporting Dividend Relevance Theory (Linter, 1956). Although other alternative exists through which managers can disseminate information but dividends are highly visible compared to other announcements in addition to its credibility of cash signals. Pu Shen (2000) examines the historical relationship between price-earnings ratios and subsequent stock market performance. The author finds strong historical evidence that high price-earnings ratios have been followed by disappointing stock market performance in the short and long term. Specifically, high price- earnings ratios have been followed by slow long-run growth in stock prices. Moreover, when high price- earnings ratios have reduced the earnings yield on stocks relative to returns on other investments, short-run stock market performance has suffered as well. Hamid and Chowdhury (2005) used two measures i.e. daily market- adjusted abnormal return (MARR) and daily cumulative abnormal return (CAR) to study the impact of dividend announcement on shareholders’ value. They explained MARR as an indicator of the relative daily percentage price change in the dividend paying stocks compared to the change in average market price. Whereas CAR has been defined as a measure of the investors’ total return over a period starting from well before the announcement of dividend to well after the dividend announcement day. They have taken 137 samples of dividend paying companies listed on Dhaka Stock Exchange and found that MARR on the day of dividend announcement was not statistically significant which entails that the market reacts earlier than the actual announcement of dividend. On the other hand, the findings of CAR results that investors lost more value in the ex-dividend period than the value gained in the pre-dividend period. These findings also suggest that dividend announcement does not carry information about the future earnings and cash flows of the companies. Anderson K. and Brooks C. (2006), found that P/E calculated from multiple years of earnings is a better predictor of returns than the traditional one-year P/E. Hossain. M. (2006) examined the determinants of stock price and return movements of listed companies of Dhaka Stock Exchange (DSE). He used several factors like number of listed securities, number of initial public offerings, earnings per share, dividend per share dividend pay out ratio and also used some macroeconomic variables like gross domestic product (GDP), per capital income, savings, investment, export, import, foreign exchange reserve, inflation rate, money supply, consumption, deposit interest rate, advance interest rate as influential factors for determining the price of stock. He found a negative relation in between dividend yield and the price of any stock. 3|Page
  • 4. Research Journal of Finance and Accounting www.iiste.org ISSN 2222-1697 (Paper) ISSN 2222-2847 (Online) Vol 2, No 6, 2011 Rahman, Z. and Rahman, L. (2008) in their study of stock price behavior around ex-dividend date from DSE found an increase of stock prices. They have made a conclusion that ex-dividend price increased instead of dropped in DSE that implies a clear preference for capital gains without having any focus of dividends by the stockholders. Vorek M. (2009) examines that the investments into stocks with low price to earnings ratio achieved higher than average returns. This paper focuses on the other side of that relation, whether the high price to earning ratio predicts the future falls in stock prices and whether the price to earnings ratio could act as an indicator of the coming bear market. The Author concluded that P/E ratio in a role of an indicator of the future stock markets falls does not result in clear conclusion. Ali M.B. and Chowdhury T.A, (2010) examined the impact of dividend announcement on stock market prices of 25 listed commercial banks in Dhaka Stock Exchange (DSE). They have employed an standard even study methodology to analyze the stock price reaction for dividend announcement and found 11 out of 25 banks’ stock price declines, 6 bank’s stock price raises and no change in 8 banks. Finally they agreed with the dividend irrelevance theory and conclude that dividend announcement itself has no influence on share price. Ong, T.S., Yichen, Y.N., Teh, B.H., (2010) examine the capability of the average PE ratio to forecast future stock market returns. They also test whether PE ratio can be used to predict future stock market declines and whether PE ratio can serve as a parameter of the coming bear market in the Malaysian Equity Market. Their investigation reveals that the null hypothesis of PE ratio as not a useful predictor of KLCI index was rejected. A linear positive slope exists between the annualized return of the KLCI and PE ratio, thus suggesting that an increase in PE ratio could have led to a subsequent rise in the KLCI. In this case, a decline in PE ratio could have resulted in a subsequent fall in the KLCI, henceforth, serving as an indicator of the coming bear market in Malaysia. In sum, the hypothesis that high levels of PE ratios will lead to future decline Ali M. B. (2011) investigates the impact of changes in selected microeconomic and macroeconomic variables on stock returns at Dhaka Stock Exchange (DSE). A Multivariate Regression Model computed on Standard OLS Formula has been used to estimate the relationship. Regression coefficient reveals that inflation and foreign remittance have negative influence and industrial production index; market P/Es and monthly percent average growth in market capitalization have positive influence on stock returns. All the independent variables can jointly explain 44.48 percent variation in DSE all share price index. No unidirectional Granger Causality is found between stock prices and all the predictor variables except one unidirectional causal relation from stock price and market P/Es. Finally, lack of Granger causality between stock price and selected micro and macro variables ultimately reveals the evidence of informationally inefficient market. 3. Methodology: 3.1 Research Methods: This study basically tries to examine the causal relationship between Dhaka Stock Exchange (DSE) all share price index (DSI) and a set of 4 stock market oriented variables usually described as microeconomic variables like market dividend yield (DY), market price earnings multiples (MKTPE), first lag of monthly average market capitalization (MAMCAP(-1)) and first lag of monthly average trading volume (MATVM (-1)). Market dividend yield and market price-earnings multiples are considered to be fundamental parameter that significantly influence stock prices and which is also supported by different Finance Theories and empirical evidence examined by different researchers and academicians. On the other hand, (MAMCAP(-1)) and (MATVM (-1)) are expected to be influential behavioral factors that are also closely associated with stock prices. At the beginning, Granger causality (1988) test was thought to be the most appropriate test for this study. To explain, in brief, a simple definition of Granger Causality, in the case of two time-series variables, X and Y: "X is said to Granger-cause Y if Y can be better predicted using the histories of both X and Y than it can by using the history of Y alone." 4|Page
  • 5. Research Journal of Finance and Accounting www.iiste.org ISSN 2222-1697 (Paper) ISSN 2222-2847 (Online) Vol 2, No 6, 2011 We can test for the absence of Granger causality by estimating the following VAR model: Yt = a0 + a1Yt-1 + ..... + apYt-p + b1Xt-1 + ..... + bpXt-p + ut (1) Xt = c0 + c1Xt-1 + ..... + cpXt-p + d1Yt-1 + ..... + dpYt-p + vt (2) Then, testing H0: b1 = b2 = ..... = bp = 0, against HA: 'Not H0', is a test that X does not Granger-cause Y. Similarly, testing H0: d1 = d2 = ..... = dp = 0, against HA: 'Not H0', is a test that Y does not Granger-cause X. In each case, a rejection of the null implies there is Granger causality. But later on we identify two major drawbacks of using Granger Causality test when more than two variables are considered: Granger Causality test consider only two variables to examine the causal relation between them. But it does not consider the effects of other associated variables which are subject to possible specification bias. As pointed out by Gujarati (1995), causality is sensitive to model specification and the number of lags. It would reveal different results if any variable (s) was relevant and was not included in the model. Therefore the empirical evidence of a two variable Granger-Causality is fragile because of this problem. Time series data are often non-stationary. This situation could exemplify the problem of spurious regression. Gujarati (1995) also said that when variables are integrated, the F-test procedure is not valid, as the test statistics don’t have a standard distribution. Although researchers can still test the significance of individual coefficients with t-statistics, one may not able to use F-statistics to jointly test the Granger- Causality. Enders (2004) proved that in some special cases, using F-statistics to jointly test first differential VAR is permissible. First differential VAR also has its limitations, which can not be employed universally. To sum up, because of the probable shortcomings of specification bias and spurious regression, this study does not carry out traditional Granger-Causality procedure to test the relationship between more than two variables. Later on we have decided to use Toda- Yamamoto (1995) procedure to examine the causal relation for our selected variables. Toda and Yamamoto (1995) proposed a simple procedure requiring the estimation of an ‘augmented’ VAR, even when there is cointegration, which guarantees the asymptotic distribution of the MWald statistic. This method is applicable “whether the VAR’s may be stationary (around a deterministic trend), integrated of an arbitrary order, or cointegrated of an arbitrary order” (Toda and Yamamoto: Journal of Econometrics 66, 1995, pp. 227). This procedure has two important advantages over the standard causality tests. First, it conducts Granger causality tests with allowance for the long-run information often ignored in systems that requires first differencing and pre-whitening.2 Secondly, this methodology is useful because it bypasses the need for potentially biased pre-tests for unit roots and cointegration, common to other formulations such as the vector error correction model (VECM). Toda and Yamamoto (1995) procedure involve a modified Wald (MWALD) test in an augmented VAR model, and do not require pretesting for cointegration properties of the system. The idea underlying the Toda–Yamamoto (TY) test is to artificially augment the true lag length (say, p) of the VAR model by the maximal order of integration (dmax) that might occur in the process. Then, one can estimate the VAR model with a (p + dmax) order, ignoring the coefficients of the last dmax lagged vectors, and test the linear or nonlinear restrictions on the first k coefficient matrices by the standard Wald test. Toda and Yamamoto (1995) prove that the Wald statistic used in this setting converges in distribution to a χ random variable, 2 no matter whether the process is stationary or nonstationary. The preliminary unit root and cointegration tests are not necessary to implement the DL test, since the testing procedure is robust to the integration and cointegration properties of the process. Consider the following VAR( p) model: Yt = γ + A1Yt −1 + ............ + ApYt − p + ε 5|Page
  • 6. Research Journal of Finance and Accounting www.iiste.org ISSN 2222-1697 (Paper) ISSN 2222-2847 (Online) Vol 2, No 6, 2011 where, yt, c, and et ~(0, Ω ) are n-dimensional vectors and Ak is an nxn matrix of parameters for lag k. To implement the T-Y test the following augmented VAR( p +d) model to be utilized for the test of causality is estimated, ∧ ∧ ∧ ∧ ∧ ∧ ∧ Yt = γ + AY t −1 + .......... ... + A p Yt − p + A p Yt − p − d + ε where the circumflex above a variable denotes its ordinary least squares (OLS) estimate. The order p of the process is assumed to be known, and d is the maximal order of integration of the variables. Since the true lag length p is rarely known in practice, it can be estimated by some consistent lag selection criteria. Note that if the maximal order of integration d =1, then the T-Y test becomes similar to the DL test. The jth element of Yt does not Granger-cause the ith element of Yt, if the following null hypothesis is not rejected: H0 : the row i; column j element in Ak equals zero for k = 1,…….., p The null hypothesis is tested by a Wald test which is termed as modified Wald (MWALD) test in case of the augmented VAR outlined above. 3.2 Data and Data Sources: This study concentrates on investigating the Granger Causal Relation proposed by Toda-Yamamoto (1995) between Dhaka Stock Exchange (DSE) all share price index and a set of 4 stock market oriented variables usually defined as micro economic variables (i.e. market dividend yield, market price earnings multiples, the first lag of the monthly average market capitalization and first lag of monthly average trading volume). For the purpose of this study DSE all share price index (DSI) data was collected for the period from January 2000 to December 2010 (132 monthly observations). The data source of DSE all share price index is the ‘Monthly Review’ publication issued by Dhaka Stock Exchange (DSE). Monthly data for the set of selected microeconomic variables for the same period were collected from same source of ‘Monthly Review’ published by DSE. But it is very important to mention that the market variables used in this study are absolutely total market oriented secondary data regardless of any specific industry. These entire market oriented microeconomic variables are selected to ensure conformity with the DSE all share price index which also works like an indicator of stock market price movement. 4. Empirical Result: 4.1 Unit Root Test: T-Y procedure of Granger Causality proposes to test the order of integration in all the variables under each investigation. In the econometrics literature, there have been a variety of unit root test that can be used for identifying the order of integration (for example Dickey and Fuller, 1979; Sargan and Bhargava, 1983; Phillips and Parron, 1988; Kwiatkowski, Phillips, Schmidt, and Shin, 1992 among the others) and each has been widely used in the applied economics literature. In this study Augmented Dickey-Fuller (ADF) Test, Phillips and Parron Test (P-P) test and Kwiatkowski, Phillips, Schmidt, and Shin (KPSS) test has been used to identify the order of integration in each and every variable. ADF and P-P test assumes the identical null hypothesis of nonstationary data series against an alternative hypothesis of stationary data series. On the other hand, KPSS assumes stationery data series as null hypothesis and nonstationary data series in the alternative hypothesis. The basic reason for selecting this three types of unit root test is to ensure a cross check in estimating the order of integration in each variables. Table-1 presents the test result of the order integration under ADF test, P-P test and KPSS test. Test result reveals that, under ADF test DSI, DY, MKTPE, and MATVM (-1) all are first order integrated data series and MAMCAP (-1) is the only second oder integrated data series. Under P-P test, we have found that all the data series under study hold the order of integration one. Whereas, KPSS test result shows that same output about the order of integration in each of the variables. So, in terms of test result ADF and KPSS reveals the same output but P-P shows slightly different result which is very insignificant. Similarity in the order of integration is significant in T-Y Granger Causality procedure because it is expected that when variables are integrated of the same order, 6|Page
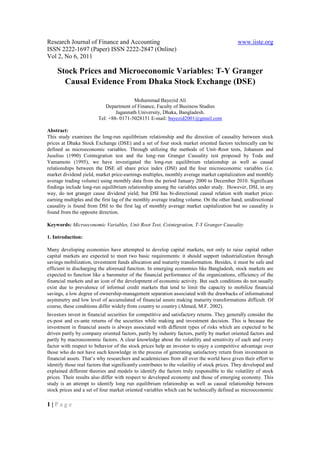
  • 7. Research Journal of Finance and Accounting www.iiste.org ISSN 2222-1697 (Paper) ISSN 2222-2847 (Online) Vol 2, No 6, 2011 they must have a cointegration relation that also contribute to have Granger Causal relation among the variables. 4.2 Selection of Lag length by Information Criteria: When we know that 4 out of total 5 variables are I (1) then we set up a VAR Inverse Roots of AR Characteristic Polynomial model using all the variables regardless of the order of integration in the 1.5 time series. In this case, an optimum lag length is selected based on VAR 1.0 lag order selection criteria which are presented in Table 2. According to this 0.5 estimated presented on table: 2, sequential modified LR test statistic (LR), final prediction error (FPE) and Akaike information criterion (AIC) shows 0.0 that optimal lag length is 7 but Schwarz information criterion (SC) and -0.5 Hannan-Quinn information criterion (HQ) shows that optimal lag length is -1.0 1 and 3 respectively. After considering majority we finally proceed with optimal lag length 7. We also test the VAR model in respect of serial -1.5-1.5 -1.0 -0.5 0.0 0.5 1.0 1.5 correlation with lag order 7. Table: 3 presents VAR residual serial correlation LM test result which also show that at lag order 7 the VAR model is not affected by serial correlation problem. At this level, the VAR with lag order 7 is found to be is found to be dynamically stable presented above. 4.3 Johansen-Juselius Cointegration Test The Johansen method applies the maximum likelihood procedure to determine the presence of cointegrating vectors in non-stationary time series as a vector autoregressive (VAR). Consider a VAR of order p Yt = A1Yt −1 + A2Yt −2 + ............. + ApYt − p + BX t + ε where Yt is a k-vector of non-stationary l(1) variables, Xt is a d vector of deterministic variables, and e1 is a vector of innovations. We can rewrite the VAR as: p −1 ∆Yt = ∏ Z t −1 + ∑ Γ∆Yt −1 + BX t + ε i =1 Where p p Π = ∑ At − 1 and Πi = ∑A j i =1 j =i +1 Here Yt is a vector of nonstationary variables. The information on the coefficient matrix between the levels of the series Π is decomposed as Π = αβ ′ where the relevant elements of the α matrix are adjustment coefficients and the β matrix contains the cointegrating vectors. Johansen and Juselius (1990) specify two likelihood ratio test statistics to test for the number of cointegrating vectors' The first likelihood ratio statistics for the null of exactly r cointegrating vectors against the alternative of r+1 vectors is the maximum eigen value statistic. The second statistic for the hypothesis of at most r cointegrating- vectors against the alternative is the trace statistic. Critical values for both test statistics are tabulated in Johansen and Juselius (1990). The number of lags applied in the cointegration tests is based on the information provided by the SC and HQ information criteria. The test of cointegration based on Johansen and Juselius (1990) has been performed assuming a linear deterministic trend with an optimum lag length 7. At first, the unrestricted cointegration rank among the variables under study is examined through the use of trace statistics and eigenvalue statistics. Trace statistics test the null hypothesis of r = 0 or r ≤ 1 against alternative hypothesis of r ≥1 or r = 2. On the other hand maximum eigen value statistics test the null hypothesis of r = 0 or r = 1 against alternative hypothesis of r = 1 or r = 2. Table -4 reveals that trace statistics reject the null hypothesis of no cointegrating relationship among the variables. An examination of trace statistics with that of critical value at 5 percent indicates that there are three cointegrating equation among the variables. Another important test to identify the number of cointegrating vectors is examination of maximum eigen value. This test (see Table: 4) also reveals the identical result that there is three cointegrating equation among the variables. 7|Page
  • 8. Research Journal of Finance and Accounting www.iiste.org ISSN 2222-1697 (Paper) ISSN 2222-2847 (Online) Vol 2, No 6, 2011 However, 4 out of 5 variables are stationary at first difference. This means that dmax = 1. So, the study estimate a system of VAR at levels with a total of k+dmax= 7+1 = 8 lags in the model. Now a VAR model has been estimated with lag 7 for each and every endogenous variables and additional one lag (i.e. due to dmax =1) is used for all the variables as exogenous variables. 4.4 T-Y Granger Causality Test The empirical results of Granger Causality test based on Toda and Yamamoto (1995) methodology is estimated through MWALD test and reported in Table: 5. The estimates of MWALD test shows that the test result follows the chi-square distribution with 7 degrees of freedom in accordance with the appropriate lag length along with their associated probability. According to this estimates DSI, in any way, has no causal relation with DY. This finding supports “Dividend Irrelevance Theory” which theorizes that the dividend itself has no influence over stock return. This finding is supported by other empirical evidence [Black and Scholes (1974), Hamid and Chowdhury (2005), Ali M. B. and Chowdhury T.A. (2010) etc.]. The test estimates also shows that DSI has bi- directional causal relation with MKTPE. This findings is also supported by another study by Pu Shen (2000), Vorek M. (2009), Ong, T.S., Yichen, Y.N., Teh, B.H., (2010), Ali M. B. (2011) etc. On the other hand T-Y granger causal relation is found from DSI to MAMCAP(-1) but no causal relation from MAMCAP(-1) to DSI which simply implies that investors at Dhaka Stock Exchange (DSE) are influenced by the lagged performance of the monthly stock market capitalization. Finally, DSI has bi-directional causality with MATVM (-1) which is an evident that lagged value of the trading volume contributes to upcoming stock prices and stock prices could be a parameter to estimate lagged trading volume. 5. Conclusion: This paper applies unit-root test based on ADF, PP and KPSS and Johansen and Juselius Cointegration test (1990) and VAR based Granger Causality Test proposed by Toda-Yamamoto (1995) to investigate long run equilibrium relationship and granger causality between DSE all share price index and a set of four macroeconomic variables from January 2000 to December 2010. It is found that the variables under study have long-run equilibrium relationship among themselves. Stock returns in Bangladesh are, therefore, predictable using past information. After then, Granger Causality among the variables are tested based on T-Y methodology and test result reveals that stock prices, in any direction, doesn’t granger cause market dividend yield. Bi-directional granger causality has been found between stock index and market price- earnings multiples and the first lag of the monthly average treading volume. At the same time unidirectional granger causality is also found from stock index to the first lag of the monthly average market capitalization. All the test result found here is highly supported by Finance Theories, Behavioral Finance and empirical evidence. Moreover, with the liberalization of the market, foreign investors with their domestic counterparts may influence the prices usually at their advantage. The relative small size of the stock market and the limited number of literate market participants are likely to constrain the free market play and thereby impacting the usual price behavior of the market and economic growth in Bangladesh. Reference: Ahmed M.F., (1991), “Dividend Policy: A Study of Enterprises Registered With the Dhaka Stock Exchange (DSE)”, Dhaka University Journal of Business Studies, 12 (2), 107-121. Ahmed M.F., (2000), “Impact of Dividend and Retained Earnings on Stock Prices in Bangladesh: An Empirical Investigation”, Savings and Development, XXIV (1), 5-30. Ahmed M.F., (1998), “Equity Market Performance in Bangladesh: An Evaluation”, Savings And Development, XXII (1), 67-93. 8|Page
  • 9. Research Journal of Finance and Accounting www.iiste.org ISSN 2222-1697 (Paper) ISSN 2222-2847 (Online) Vol 2, No 6, 2011 Ahmed M.F. (2000), “Emerging Stock Market and the Economy”, South East Asian Studies Series, Nagasaki University, Japan. Ahmed M.F. (2002), “Market Efficiency in Emerging Stock Markets: The Case of Dhaka Stock Exchange”, Savings And Development, XXVI (1), 49-68. Ali M. B. and Chowdhury T.A. (2010),“Effect of Dividend on Stock Price in Emerging Stock Market: A Study on the Listed Private Commercial Banks in DSE ”, International Journal of Economics and Finance, 2(4), 52-64. Ali M.B., (2011), “Impact of Micro and Macroeconomic Variables on Emerging Stock Return: A Case on Dhaka Stock Exchange (DSE).” Interdisciplinary Journal of Research in Business, 1(5), 08-16. Anderson K. and Brooks C. (2006), “The Long-Term Price-Earning Ratio”, Journal of Business Finance and Accounting, 37(7 &8), 1063-1083. Arahony, J. and I. Swary (1980), “Quarterly Dividend and Earnings Announcements and Stockholders Returns: An Empirical Analysis”, Journal of Finance, 35, 1-12. Black, F. and M. S. Scholes, (1974), “The Effect of Dividend Yield and Dividend Policy on Common Stock Prices and Return”, Journal of Financial Economics, 1, 1-22. Dhillon, U., and H. Johnson (1994),“The Effect of Dividend Changes on Stock and Bond Prices”, Journal of Finance, 49, 281-289. Dickey, D. A. and W.A. Fuller, (1981), "Likelihood Ratio Statistics for Autoregressive Time Series with a Unit Root", Econometrica 48, 1057-1072 Eades, K. (1982), “Empirical Evidence on Dividends as a Signal of Firm Value”, Journal of Financial and Quantitative Analysis, 17 471-500. Enders W. (2004), Advanced Econometric Time Series (Second Edition), New York: Willey. Engle, R.F and C.W.J. Granger, (1987), "Cointegration and Error correction: Representation, Estimation and resting", Econimetrica, 55(2), 251-276. Fama, E.F.,(1981), "stock Returns, Real Activity, Inflation and Money", American Economic Review 71, 545-565. Fama, E.F. (1990), "Stock Returns, Expected Returns, and Real Activity", Journal of Finance 45, 1089-1 108. Gordon, M. J.(1963), “Optimum Investment and Financing Policy”, Journal of Finance, 18, 264-272. Handjinicolaon, G., and A. Kalay (1984), “Wealth Redistributions or Changes in Firm Value: An Analysis of Returns to Bondholders and Stockholders around Dividend Announcements”, Journal of Financial Economics, 13, 35-63. lmam, M. Osman, and A.S. M.M. Amin, (2004), "Volatility in the stock Return: Evidence from Dhaka Stock Exchange", Journal of the Institute of Bankers Bangladesh, 51(1), 01-08. lmam, M. Osman, (2000), "Capital Market Development: Problems and Prospects”, Portfolio, Chittagong Stock Exchange, Oct-Dec, 43-56. Jayaraman, N. and K. Shastri (1988), “The Valuation of Specially Designed Dividends”, Journal of Financial and Qualitative Analysis, 23, 301-312. Johansen, S.(1991), "Estimation and Hypothesis Testing of Cointegrating Vectors in Gaussian Vector Autoregressive Models", Econometrica 59, 1551-1580. Johansen, S. and K. Juselius, (1990), "Maximum Likelihood Estimation and Inference on Cointegration- With Application to the Demand for Money", Oxford Bulletin of Economics and Statistics 52, 169-210. 9|Page
  • 10. Research Journal of Finance and Accounting www.iiste.org ISSN 2222-1697 (Paper) ISSN 2222-2847 (Online) Vol 2, No 6, 2011 Linter, J.,(1956), “Distribution of Income of Corporations among Dividends, Earnings and Taxes.” American Economic Review, 46(2), pp. 97-113. Miller, M., and M. Scholes (1981), “Dividends and Taxes: Empirical Evidence”, CRSP Working Paper, University of Chicago. Mohiuddin, M. Rahman M.L. and Uddin, J. (2009), “Test of Efficiency in Emerging Stock Market: Evidence From Bangladesh”, Journal of Business Administration, 35(1& 2), 1-20. Mollah, A.S. Rahman, M.Z. and Islam, M. S., (2005), “Return behavior of the DSE-20: An Empirical Investigation on the Dhaka Stock Exchange”, Journal of Business Studies, XXVI (2), pp. 25-38. Mollah, A.S., Mobarek A.and Islam R. (2007), “Market Response to Dividend Increases and Changes in Payout Ratios: An Empirical Investigation on the Dhaka Stock Exchange Listed Textile Sector Companies”, Journal of Banking and Financial Services, 1(1&2). Pu Shen, (2000), “Economic Review”, Federal Reserve Bank of Kansas City, Fourth Quarter, pp. 23- 36. Ong, T.S., Yichen, Y.N., The, B.H., (2010),“Can High Price Earnings Ratio Act As An Indicator Of the Coming Bear Market In The Malaysia?” International Journal of Business and Social Science, 1(1), pp. 196-213. Rahman, Z. and Rahman, L. (2008), “Stock Price Behavior Around Ex-dividend Day: Evidence from Dhaka stock Exchange”, Journal of Business Administration, 34, 127-144. Seddighi, H.R., Lawler, K.A., and Katos, (2000), A.V, Econometrics: A Practical Approach (First Edition), Routledge. Uddin M. H., and Chowdhury G. M. (2005), “Effect of Dividend Announcement on Shareholders’ Value: Evidence from Dhaka Stock Exchange”, Journal of Business Research, 1. Vorek M. (2009), “Does High Price earnings Ratio Predict Future Falls of Stock Price?”, Faculty of finance and accounting, University of Economics in Prague, pp. 1-22 Woolridge, J.R. (1982),“The Information Content of Dividend Changes”. Journal of Financial Research, 5, 237-247. 10 | P a g e
  • 11. Research Journal of Finance and Accounting www.iiste.org ISSN 2222-1697 (Paper) ISSN 2222-2847 (Online) Vol 2, No 6, 2011 Table – 1 : Test of Order of Integration Augmented Dickey-Fuller Test Phillips-Parron Test KPSS Test ADF Test Stat P-P Test Stat I(1) I(0) I(2) Critic Variabl I(0) I(1) I(2) I(0) I(1) I(2) al es t- pro t- pro t- pro Adj pro Adj t- pro A pro Value stat b stat b stat b t-stat b stat b dj b LM @1% LM LM t- Stat Stat. Stat. sta . t DSI 2.12 1.0 - 0.0 1.73 1.0 - 0.0 0.22 0.16 2 0 8.68 0 58 0 8.676 0 40 49 7 1 DY - 0.6 - 0.0 - 0.6 - 0.0 0.11 0.09 1.80 9 10.0 0 1.97 1 10.09 0 97 33 2 8 07 42 MKTPE - 0.3 - 0.0 - 0.1 - 0.0 0.10 0.03 0.2160 2.53 1 10.3 0 2.82 9 10.35 0 54 48 00 4 2 36 71 MAMC 2.87 1.0 - 0.9 0.99 0.0 7.21 1.0 - 0.0 0.29 0.23 0.16 AP (-1) 5 0 0.05 9 5 2 44 0 5.410 0 15 83 2 2 07 MATV 3.76 1.0 - 0.0 2.73 1.0 - 0.0 0.32 0.16 M (-1) 1 0 12.8 0 48 0 12.88 0 37 35 8 01 Table 2: VAR Lag Order Selection Criteria Endogenous variables: DSI DY MKTPE MAMCAP(-1) MATVM(-1) Lag LogL LR FPE AIC SC HQ 0 -6965.464 NA 1.15e+43 113.3409 113.4552 113.3873 1 -6209.902 1437.410 7.98e+37 101.4618 102.1477* 101.7404 2 -6170.841 71.13549 6.36e+37 101.2332 102.4907 101.7440 3 -6129.243 72.37335 4.88e+37 100.9633 102.7924 101.7063* 4 -6101.540 45.94643 4.72e+37 100.9194 103.3200 101.8945 5 -6053.447 75.85373 3.29e+37 100.5439 103.5161 101.7512 6 -6025.583 41.68369 3.21e+37 100.4973 104.0411 101.9368 7 -5990.210 50.03936* 2.81e+37* 100.3286* 104.4440 102.0003 8 -5973.336 22.49892 3.35e+37 100.4607 105.1477 102.3646 11 | P a g e
  • 12. Research Journal of Finance and Accounting www.iiste.org ISSN 2222-1697 (Paper) ISSN 2222-2847 (Online) Vol 2, No 6, 2011 Table 3: VAR Residual Serial Correlation LM Tests Null Hypothesis: no serial correlation at lag order h Lags LM-Stat Prob 1 56.78838 0.0003 2 74.87943 0.0000 3 32.52651 0.1433 4 58.81361 0.0002 5 75.28658 0.0000 6 74.50472 0.0000 7 26.84967 0.3634 8 43.85127 0.0113 9 29.59949 0.2396 10 52.47458 0.0010 11 43.14681 0.0135 12 45.68855 0.0070 Table- 4 : Unrestricted Cointegration Rank Test (Trace) and (Maximum Eigenvalue) 0.05 Max-Eigen 0.05 Hypothesized No. of CE(s) Trace Statistic Prob.** Prob.** Critical Value Statistic Critical Value None * 148.0925 69.81889 0.0000 61.06181 33.87687 0.0000 At most 1 * 87.03072 47.85613 0.0000 41.14278 27.58434 0.0005 At most 2 * 45.88794 29.79707 0.0003 31.94995 21.13162 0.0010 At most 3 13.93798 15.49471 0.0847 13.88762 14.26460 0.0573 At most 4 0.050363 3.841466 0.8224 0.050363 3.841466 0.8224 Table 5 :T-Y Granger Causality Test Direction of Causality df. Chi-sq. Prob. DSI ~ DY 11.81580 0.1068 DY DSI 7 ~ 3.534857 0.8315 DSI → MKTPE 15.41360 0.0310 MKTPE DSI 7 → 17.40174 0.0150 DSI → MAMCAP(-1) 19.10271 0.0079 MAMCAP(-1) DSI 7 ~ 10.11659 0.1821 DSI → MATVM(-1) 44.02571 0.0000 MATVM(-1) DSI 7 → 20.17998 0.0052 * sig. at 5 percent level 12 | P a g e