Determinants of Declining Child Sex Ratio in Rajasthan
1. Journal of Economics and Sustainable Development www.iiste.org
ISSN 2222-1700 (Paper) ISSN 2222-2855 (Online)
Vol.3, No.1, 2012
Determinants of Declining Child Sex Ratio in Rajasthan
M.R.Singariya*
Government College Jaitaran. Distt. Pali. Pin 306302 Rajasthan, India.
* Email of corresponding author: mr.singariya@gmail.com
Abstract
The recent provisional census figures for Rajasthan show an alarming drop in sex ratio in the 0 – 6 age
group from 909 in 2001 to 883 in 2011. While it was 916 in 1991, a fall of 7 points (0.76%) in previous
decade and a much higher decline of 26 points (2.86%) in present decade are indicative of a clear bias
against girl child in Rajasthan. Using Pooled OLS and Quantile Regression estimates for the last three
decennial censuses, the paper is an attempt to examine the determinants of declining child sex ratio in
Rajasthan. A key result we obtained in pooled OLS, suggests that one percentage point increase in male
literacy has reducing effect on the juvenile sex ratio by on and average 0.14 percent in the districts of
Rajasthan during 1991-2011. This finding is robust and successively increasing in all single decadal year
OLS estimates. This means that with an increasing level of male literacy, strong son preference attitude and
use of ultrasound machines for female foeticide have been flourishing freely in the state since last two
decades The revealing Quantile Regression results indicate that the male literacy rate has an insignificant
effect at the 0.05 quantile and it turns significant and increasingly negative at successively higher quantiles,
while the female literacy and other infrastructural facilities like safe drinking water have positive and
significant effect on the upper tail of juvenile sex ratios. The most public intervention such as strengthening
female education and availability of safe drinking water facilities are essential to increase the juvenile sex
ratio in the state but not sufficient. Strict enforcement of PCPNDT Act and laws to provide women the right
to inherit ancestral property are an utmost need for balancing child sex ratio in the state.
Key words: juvenile sex ratio, Pooled OLS, male and female literacy, infrastructural facilities, decennial
census.
1. Introduction
The recent 2011 Provisional Census figures for Rajasthan show an alarming drop in sex ratio in 0-6 age
group from 909 in 2001 to 883 in 2011, while it was 916 in 1991, a fall of 7 points (0.76%) in previous
decade and a decline of 26 points (2.86%) in 2001-2011 are indicative of a clear bias against the relative
life chances of girl child in the state. Thirty three points decline in last two decade is a matter of grave
policy concern, not only because it violates the human rights of unborn and infant girls but also because it
deprives the state of the potential economic and social contribution of these “missing women.” Though, the
child sex ratio in India also stands at a dismal 914, down from 927 in 2001. The Provisional Census figures
show that in 27 states/Union Territories of India, the child sex ratio has shown a decline over census 2001.
But the decadal decline in child sex ratio at national level is less steep from that of the previous decade
(1991 to 2001). In 1991, it was 945 and fell to 927 in 2001, a fall of 18 points (1.9%). This time, it has
fallen to 914, a fall of 13 points (1.4%). Highest decline in the child sex ratio was noted in Jammu &
Kashmir (-8.71%) followed by Dadra & Nagar Haveli (-5.62%), Lakshadweep (-5.32%), Maharashtra (-
3.29%) and Rajasthan (-2.86%) (TNN Apr 5, 2011). The problem is most pronounced in Rajasthan, which
has lowest child sex ratio amongst EAG states. While the neighbouring state’s like Punjab and Haryana,
which have traditionally seen low sex ratio, have recorded an increasing trend in child sex ratio but
Rajasthan is still showing sharper declining trend in the current provisional census report. Despite
considerable pressure from civil society groups to implement the Pre-Conception and Pre-Natal Diagnostic
Techniques (Prohibition of Sex Selection) Act, the pernicious trend of elimination of girls has continued
(Mathur & Rajagopal 2011).
9
2. Journal of Economics and Sustainable Development www.iiste.org
ISSN 2222-1700 (Paper) ISSN 2222-2855 (Online)
Vol.3, No.1, 2012
The use of ultrasound technology to reject the unwanted girl child has become widespread in the state. This
came in to light in 2006 when a sting operation carried out by the Sahara television channel captured on
camera over a hundred doctors violating the law. More cases of female foeticide have been unearthed since
then in various parts of the state. After the sting operation, the Rajasthan Medical Council (RMC)
temporarily suspended the registration of four gynecologists and three sonologists and the license to the
practice medical termination of pregnancy (MTP) and ultra sonology of 29 other doctors. More than 30
doctors violating the pre-Natal Diagnostic Techniques (Prohibition of sex selection) (PCPNDT) act, 1994
were restrained from practice by the RMC on prima facie grounds of violating the code of professional
conduct, etiquette and ethics as laid down by the law (Singh & Srivastava 2008). Added to the studies by
independent agencies have shown that the two-child norm in Rajasthan for contesting election in
panchayati raj bodies in the state have also adversely affected the sex ratio in children. Rajasthan
introduced the two-child norm in 1992 and it bars people with more than two children from standing for
elections or holding any position in panchayati raj institutions and urban local bodies (TNN Apr 1, 2011).
To combat this scourge, policy makers need to have a better understanding of the socio-economic
determinants of juvenile sex ratios. Our paper contributes to the existing literature on gender imbalance in
several ways. Most existing studies at the national level have used data from 1991 or the 2001 census,
aggregated to either the state or the district level. Since juvenile sex ratios have changed dramatically in the
last three decades. The aim of this paper is to examine the trends and determinants of cross district
variations in the relative life chances of girl child in the districts of Rajasthan since last two decades.
2. Review of Literature
Much of the literature in Indian sex ratios has focused on a North-South dichotomy in sex ratios (Dyson &
Moore 1983, Agarwal 1986 and Sen 2003). This literature has argued that the northern and western regions
of the country not only have more rigid norms of female seclusion, particularly related to participation in
economic activities outside the home, but also have marriage customs such as large dowry payments that
make girls an economic burden on the family. In contrast, women in the South and East enjoy greater
autonomy and higher social status within the family. These cultural differences manifest themselves in the
form of lower sex ratios at birth in the northern and western states than in the southern and eastern states.
Sex selective abortions and son preference attitude are also identified as determinants of declining sex ratio
in certain studies related to Asian countries (D’Souza & Chen 1980; Park & Cho 1995; Kynch & Sen 1983
and Das & Gupta 1987). These studies attributed excess female mortality to a general preference for sons,
which in turn traced it to either higher expected return to the labour of male over female children or
anticipated old-age support from sons within the patrilineal kinship system (Berik & Bilginsoy 2000).
Visariya (1969) also claimed that ‘excess female literacy’ is the basic reason for declining sex ratio and
excess female mortality in turn is the result of female infanticide, female foeticide, neglect of females and
maternal mortality. Barbara Diane Miller (1989) examined the changes in the regional patterns of juvenile
sex ratio in rural India from the censuses of 1961 and 1971. It was found that while sex differentials in
childhood mortality were substantial and widely distributed in India at the time of the 1961 Census, they
were even more so by the time of the 1971 census. Yet another recent study of spatial variations in sex ratio
in the context of India is Klasen and Claudia (2003), where they found labour force participation rate and
literacy rate of women significant in lessening sex ratio; while increasing recourse to sex selective
abortions worsen it. Chakraborty & Sinha (2008) examined the determinants of declining child sex ratio in
India; the study uses fixed effects model four decennial census data (1971-2001) across fifteen major states
found that the child sex ratio is inversely related to the spatial socio-economic characteristics, in particular,
female literacy rate and female economic activity rate; with relatively higher elasticity coefficients for
urban India.
3. Trends
The overall sex ratio is determined by several factors such as age-specific differences in mortality and
migration rates across males and females. For this reason, sex ratios for infants and children are better
10
3. Journal of Economics and Sustainable Development www.iiste.org
ISSN 2222-1700 (Paper) ISSN 2222-2855 (Online)
Vol.3, No.1, 2012
measures of the differential treatment of males and females in a society. Although the overall sex ratio in
Rajasthan has improved to 926 in census 2011 by sixteen points compared to that of 1991, this is highest
recorded sex ratio for the state since 1901, when it was 905 though it continuous to be below the national
average of 940. The only reason for that is that life expectancy of women has gone up. This means, that
there are older women in the population that there were 10 years ago but the main concern remains the poor
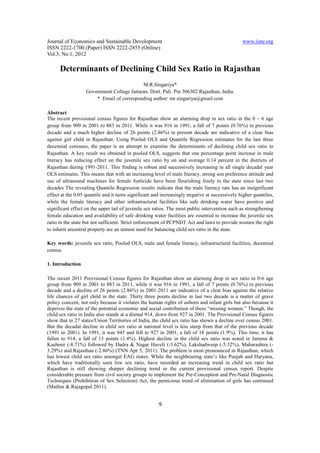
child sex ratio (TNN Apr 01, 2011). Figure 1 plot that the level of child sex ratio has been in free fall
since1981, when it stood 954. It also explores that up to1991 the level of child sex ratio was higher than
overall sex ratio and after that it is falling, even in decades when the overall sex ratio increased slightly
(1991-2001 and 2001-2011), the juvenile sex ratio continued to fall. These trends probably result from
three factors: sex – selective abortions (Feticide) based on prenatal ultrasounds, excess female (relative to
male) infant and child mortality, and differential contraceptive use depending upon the sex composition of
existing children. All three in reflect a strong cultural preference for sons over daughters (Deolalikar et al.
2009).
4. Inter-District Differences
The latest census reflects the dismal child sex ratio in the state, with only 9 districts reporting the ratio
above 900, compared to the 2001 census which had 23 districts above this mark. Figure 2 shows the
juvenile sex ratio for thirty two districts of the state at three points of time: 1991, 2001 and 2011. It was that
Jaisalmer, Bharatpur, Alwar, Karauli, Sikar and Jhunjhunu consistently had the lowest juvenile sex ratio of
any district in Rajasthan over this entire period. Bikaner, Barmer, Churu and Sawai Madhopur had
improved juvenile sex ratio in the state with little change over the period 1991-2001. Districts such as
Dholpur, Jaipur, Ganganagar and Hanumangarh, which has more balanced child sex ratios in 1991, have
seen larger declines between 1991 and 2001. Figure 3 show that Jhunjhunu, the highest literate district of
the state has recorded the sharpest decline in the child sex ratio (about 7.5%) of any district in the state
during 1991-2011. Indeed twenty six districts, other than Barmer, Bikaner,Udaipur, Churu, Jaisalmer and
Sawai Madhopur showing declining juvenile sex ratio between 1991-2011.
The declining child sex ratio in the state may be a pointer to rampant foeticide in the state. Foeticide is a
rampant practice, especially in western Rajasthan where girls are considered unwanted. Though through
help of NGOs the practice of breaking a pot when a girl child is born, signifying sorrow is changing fast but
there are still villages where there is negligible presence of girl child. The districts of Jaisalmer, Barmer,
Pali, Chittorgarh, Ganganagar and Jhunjhunu are known for the killing of girl child. Figures in the Census
2011 report point out that the child sex ratio has been on a slide in the state since 1981 and, barring
Ganganagar, all districts in the state have reported a fall in the child sex ratio. The districts that have seen
the biggest fall in the child sex ratio include Dungarpur, Jaipur, Sikar, Rajsamand and Tonk. The fall in
Dungarpur district, a predominantly tribal area, merits a closer inquiry as it shows a drop in child sex ratio
by 39 points in the last decade. Three districts, i.e, Jaipur, Jhunjhunu and Sikar are also known for high
literacy rates denoting little correlation between higher literacy rates and mindsets which allow girls a
right to be born and live with dignity (Mathur, 2011). Other districts that shown a similar decline are
mainly located in eastern Rajasthan and include Jhunjhunu, Alwar, Dausa, Bharatpur, Karauli, Tonk, Sawai
Madhopur besides Ganganagar, Hanumangarh and Jaisalmer.
5. Data & Methodology
The present paper is primarily based on secondary data collected from decennial census Reports (1991,
2001 & 2011), Government of India, Rajasthan Human Development Report, 2008 and District-Level
Household Survey 2 & 3, covering Child sex ratio, overall sex ratio, literacy rate, decadal population
growth rate and household access facilities like safe drinking water, toilet facility and electricity. Pooled
OLS, fixed-effects and random-effects panel regression models have been used to find conclusions in this
paper. As it is well known, the quantile regression technique is a means of allowing estimated marginal
effects to differ at different points of the conditional distribution of the dependent variable. Quantile
regressions were initially developed as a robust regression technique that would allow for estimation where
11
4. Journal of Economics and Sustainable Development www.iiste.org
ISSN 2222-1700 (Paper) ISSN 2222-2855 (Online)
Vol.3, No.1, 2012
the typical assumption of normality of the error term might not be strictly satisfied (Koenker & Bassett
1978). However, they are now used extensively to analyze the relationship between dependant and
independent variables over the entire distribution of the dependant variable-not just at the conditional mean
(Buchinsky & Eide 1994). Appropriate diagnostic tests have also been performed in checking accuracy of
the models. SPSS vs. 17 and gretl vs. 1.9.5 software were used for database, figure constructions and
regression analysis. Based on the findings, some policy recommendations have also been suggested for
balancing the juvenile sex ratio in districts of Rajasthan.
6. Empirical Results
The objective of the paper is to detect the relationship between the shortfall of girls and socio-economic
characteristics of districts. The unit of analysis of the study is district, which are not behavioural units, but
aggregates of behavioural units (such as household or individuals). The dependant variable in the model is
the juvenile sex ratio of age cohort 0-6 years. The conditioning set includes two types of important
variables that measure educational attainment as well as intra-household resources including safe drinking
water, sanitation and electricity facilities. To begin our analysis, single regression models of juvenile sex
ratio were run against each of our chosen economic and social indicators to obtain a graphical
representation of how well each variable could explain variances in child sex ratio. These regression plots
can be found in figures 4-9. The only variable that held a positive relationship with child sex ratio were safe
drinking water facility and decadal population growth rate.
All the variables are taken in natural logarithms because the dependant variable is a ratio and therefore
asymmetric around the reference value. With logarithmic transformation, a deviation from a reference point
becomes equidistant in either direction (Fossett & Kiecolt 1991). The regression coefficients are then
elasticities of the juvenile sex ratio with respect to explanatory variables. The results of ordinary least
square estimations of juvenile sex ratio across districts of Rajasthan are reported in Table 1. As a
comparison, we also reported pooled (over 1991, 2001 and 2011) ordinary least squares (OLS) estimates as
well as OLS estimates for each of three census years. Since the OLS estimates are likely to be biased as
high (0.80) correlation between two variables and Variance Inflation Factor (VIF) tests indicated that there
is little multicollinearity problem in male and female literacy and that’s why it is not our preferred
estimates, but there is little point in discussing them. The most noteworthy finding in the OLS estimates is
that any increase in male literacy in districts of Rajasthan serves to decrease the juvenile sex ratio and its
negative effect on juvenile sex ratio is increasing decade by decade, i.e. its negative elasticity was 0.11 in
1991 had increased 0.36 in 2001 and now it has become 0.40 in the last decade 2011. This means that with
an increasing level of male literacy, strong son preference attitude and use of ultrasound machines for
female foeticide have been flourishing freely and fairly in the state since last two decades. It also shows
that PCPNDT Act has not been properly enforced and no sincere effort has been made to stop ultrasound
machines from being used for sex determination and hence sex determination continues to be practiced
robustly and rampantly in the state.
Table 1: OLS Regressions of the Log Juvenile Sex Ratio in districts of Rajasthan,1991-2011
Independent OLS- 1991 OLS- 2001 OLS- 2011 Pooled OLS
Variables Coef. t-ratio Coef. t-ratio Coef. t-ratio Coef. t-ratio
const 7.099 37.78 7.718 18.09 8.409 23.50 7.048 0.148
l_LRM -0.11 -2.24 -0.36 -2.493 -0.402 -3.516 -0.144 0.047
l_LRF 0.026 1.215 0.033 0.5818 0.071 1.272 0.013 0.020
l_HAE 0.013 0.664 0.015 0.7368 0.025 1.219 0.0017 0.013
l_HASDW 0.046 2.094 0.112 2.447 -0.07 -1.857 0.0647 0.015
l_DPGR -0.04 -2.462 -0.003 -0.090 0.02 1.347 0.0102 0.011
R-squared 0.54 0.49 0.54 0.35
Adjusted R-squared 0.45 0.39 0.46 0.31
Figures in bold indicate statistical significance of the estimated coefficient at the 10% or lower level
OLS = Ordinary Least Squares, Coef. = Coefficient
12
5. Journal of Economics and Sustainable Development www.iiste.org
ISSN 2222-1700 (Paper) ISSN 2222-2855 (Online)
Vol.3, No.1, 2012
Though, female literacy rate and Households access electricity facility has influenced positively to juvenile
sex ratio in last two decades but the result is statistically insignificant. In contrast, the availability of safe
drinking water had a positive effect on juvenile sex ratio in 1991 and 2001 but turned to effect negatively in
2011. Pooled OLS estimation suggests that on an average one percentage point increase in male literacy
had reduced juvenile sex ratio by 0.14 percent during 1991- 2011 in the districts of Rajasthan. However,
interestingly, household access safe drinking water facility has significant and positive effect on juvenile
sex ratio in the study period. While the estimated effect of female literacy, population growth rate and
general infrastructure facility (electricity) has positive but insignificant association with juvenile sex ratio.
The quantile regression results (Table 3) are revealing. They indicate that the male literacy rate in districts
has significant and large negative effect on the juvenile sex ratio at the 0.25 and its upper quantiles. At the
0.05 quantile, the estimated effect is insignificant, and turns increasingly negative at successively higher
quantiles, while the effect of female literacy and other infrastructural facility like safe drinking water have
positive and significant effect on the upper tail of juvenile sex ratios in the districts of Rajasthan. The one
odd empirical result of this finding is that the local availability of electricity reduces juvenile sex ratio in
the higher quantiles but increases them in the lower quantiles. Another interesting, although not
unexpected, finding is that, ceteris paribus, districts with larger population growth rates have higher
juvenile sex ratios. The relationship between lower decadal population growth rate and a lower juvenile sex
ratio is observed in districts of Rajasthan. The imbalance in the juvenile sex ratio is realized through several
different parental actions, such as prenatal sex determination using ultrasound technology and sex –
selective abortions (female feticide), female infanticide, parental neglect of female children (leading to their
lower rate of survival relative to male children), and differential contraceptive use depending upon the sex
composition of existing children (with women who bear daughters early in their reproductive years
continuing child-bearing while those who bear sons early halting their child-bearing).
Table 2: Quantile Regressions of the Juvenile Sex Ratio for districts of Rajasthan, 1991-2011
Quantiles Const. l_LRM l_LRF l_HAE l_HASDW l_DPGR
0.050 6.66 -0.0452 -0.0465 0.0337 0.0523614 0.0291
(31.38) (-0.45) (-1.07) (1.232) (1.642) (1.188)
0.250 6.95 -0.1485 -0.0083 0.0254 0.0738327 0.0191
(31.64) (-2.11) (-0.27) (1.320) (3.282) (1.105)
0.500 6.94 -0.1099 -0.0013 0.0012 0.0722592 0.0036
(39.42) (-1.95) (-0.05) (0.082) (4.011) (0.266)
0.750 7.10 -0.1348 0.01494 -0.008 0.0609665 0.0011
(71.57) (-4.24) (1.078) (-0.948) (6.005) (0.149)
0.950 7.33 -0.2089 0.04308 -0.010 0.0653482 -0.003
(50.80) (-4.52) (2.136) (-0.798) (4.245) (-0.343)
Figures in bold indicate statistical significance of the estimated coefficient at the 10% or lower level
t-ratios are shown in the parentheses brackets
Thus, the quantile regression results are consistent with the least –squares results for male and female
literacy as well as for household facilities and decadal population growth rate. But there are few
discrepancies with the model, as it is indicated that there is multicollinearity problem with male and female
literacy rate. It seems from the above analysis that electricity facility or decadal population growth rate
does not have significant influence on juvenile sex ratio. The data exploration across districts also revealed
that not only does juvenile sex ratio worsen as one moves from southern district such as Banswara,
Dungarpur and Udaipur to northern or northern-eastern districts such as Ganganagar, Hanumangarh,
Jhunjhunu, Sikar, Alwar, Bharatpur, Karauli and Dholpur, but there is also some clustering of the child sex
ratio such that low child sex ratio districts tends to have similar neighbouring districts or even neighbouring
states. It is clear indication that low child sex ratio tendency of Indian states such as Punjab, Hariyana and
13
6. Journal of Economics and Sustainable Development www.iiste.org
ISSN 2222-1700 (Paper) ISSN 2222-2855 (Online)
Vol.3, No.1, 2012
Himachal Pradesh can be easily seen in the neighboring districts of Rajasthan like Ganganagar, Dholpur
and Hanumangarh. Econometrically, this problem can be solved by an introduction of dummy variables
(Chakraborty & Sinha 2008).
Finally, it was decided to refine this model by two ways. First, total literacy was substituted to get rid from
the multicollinearity problem between male and female literacy. Second, regional (Administratively
division) dummy variables were included to find the clusters respond on juvenile sex ratio in Rajasthan.
Therefore seven regions (Divisions) are Ajmer (4), Bharatpur (4), Bikaner (4), Jaipur (5), Jodhpur (6), Kota
(4) and Udaipur (6). Setting 1 and 0, one’s are given to districts of concerning division and 0 otherwise; for
instance if the selected region is Ajmer, one’s were given to four districts of Ajmer division such as Ajmer,
Bhilwara, Nagaur and Tonk and zero’s were given to rest of all districts. The process is repeatedly used for
another six regions. And lastly, to investigate does the higher female literacy or higher human development
indices have a significant influence upon juvenile sex ratio in the districts of Rajasthan for the last three
decades, two dummies of ‘High Female Literacy’ (DHFL) and ‘High Human Development Index’ (DHDI)
were included. One’s were given to those districts who have higher female literacy than 50% as per Census
of India, 2011 and higher HDI value than 0.6 in accordance to Rajasthan Human Development Report, (An
update 2008).
Table 3: Panel Estimation for Juvenile Sex Ratio in districts of Rajasthan, 1991-2011
Independent Pooled OLS Fixed-effects Random-effects
Variables Coef. t-ratio Coef. t-ratio Coef. t-ratio
const 6.7622 115.7 6.6623 118.5 6.74396 119.0
l_LR -0.055 -3.96 -0.0124 -0.774 -0.0447 -3.187
l_HAE 0.0094 0.675 -0.0423 -2.451 -0.0046 -0.321
l_HASDW 0.0370 2.857 0.03134 2.564 0.03600 2.947
l_HATF -0.001 -0.17 0.02386 2.156 0.00597 0.6396
l_DPGR 0.0297 2.883 0.04502 3.950 0.03382 3.257
DHFL 0.0005 0.079 - - -0.0008 -0.092
DHDI -0.012 -1.30 - - -0.0151 -1.332
DBharatpur -0.051 -3.46 - - -0.0546 -2.945
DJaipur -0.038 -2.36 - - -0.0370 -1.816
DAjmer -0.010 -0.70 - - -0.0112 -0.611
DBikaner -0.027 -1.55 - - -0.0311 -1.431
DJodhpur -0.031 -2.28 - - -0.0327 -1.892
DKota -0.010 -0.72 - - -0.0090 -0.493
DUdaipur 0.0003 0.021 - - 0.00145 0.0814
R-squared 0.627 0.81 -
Adjusted R-squared 0.56 0.70 -
Akaike criterion -450.028 -472.664 -447.6311
Schwarz criterion -411.563 -377.783 -409.1659
Hannan-Quinn -434.480 -434.312 -432.0828
Figures in bold indicate statistical significance of the estimated coefficient at the 10% or lower level
OLS = Ordinary Least Squares, Coef. = Coefficient
The final regression model produces a good fit, with an adjusted R2 value of 0.56. This adjusted R2 is
slightly higher from our preliminary OLS model. The significant indicators of final OLS model seem
reasonable and the sign of coefficients are further clues as to logical interpretations of the variables and
dummy variables. For instance, literacy rate exhibits a negative influence on juvenile sex ratio and decadal
population growth rate has positive influence on juvenile sex ratio, these two variables collectively
validates that higher the level of literacy lower the level of fertility and ultimately lower level of population
14
7. Journal of Economics and Sustainable Development www.iiste.org
ISSN 2222-1700 (Paper) ISSN 2222-2855 (Online)
Vol.3, No.1, 2012
growth rate and fertility decline is typically associated with lower juvenile sex ratios. There is a large
literature that shows that literacy is one of the strongest determinants of fertility decline in India
(Rosenzweig & Evenson 1977, Dreze & Murthi 2001, IIPS 2007, Basu 1999 and Jha et al. 2006).
The estimated coefficients on the regional dummy variables are also of interest. Table 3 shows that three
divisional dummy had significant and negative association with juvenile sex ratio in the state but two
another dummies of high HDI and High female literacy had not found even significant association with
juvenile sex ratio. These points to hypothesis that economic growth and human development seldom move
together, when it comes to improving gender relations. The results also indicate that the divisions of
Bharatpur, Jaipur and Jodhpur have experienced the largest ceteris paribus declines in the juvenile sex ratio
during 1991-2011, while Ajmer and Kota divisions have experienced smallest ceteris paribus declines. In
particular, Udaipur, one among all divisions of Rajasthan has shown steep rise yet insignificant, comes out
looking much better and Bharatpur much worst division in terms of its performance on in juvenile sex ratio
between 1991 and 2011. Another interesting, although not unexpected, finding is that, ceteris paribus,
districts with higher human development indices and higher level of female literacy have witnessed lower
juvenile sex ratios in the districts of Rajasthan during 1991-2001, as it is indicated in random effects panel
estimation.
7. Conclusions
In this paper, we have used district-level data from 1991 to 2011, censuses to analyze the policy
determinants of juvenile sex ratios in Rajasthan. In particular, we have focused on literacy rate, population
growth rate and the availability of household facilities like safe drinking water, electricity and toilet
facilities. The most noteworthy finding in the OLS estimates is that any increase in male literacy in districts
of Rajasthan serves to decrease the juvenile sex ratio and its negative effect on juvenile sex ratio is
increasing decade by decade. In contrast, the availability of safe drinking water had a positive effect on
juvenile sex ratio in 1991 and 2001 but turned to influence negatively in 2011. Though, female literacy rate
and Household access electricity facility had influenced positively. Pooled OLS estimation suggests that on
an average one percentage point increase in male literacy had reduced juvenile sex ratio by 0.14 percent
during 1991- 2011 in the districts of Rajasthan. However, interestingly, household access safe drinking
water facility had significant and positive effect on juvenile sex ratio during the study period. While the
estimated effect of female literacy, population growth rate and general infrastructure facility (electricity)
have positive yet insignificant influence on juvenile sex ratio.
The revealing quantile regression estimates also indicated that the male literacy rate in districts has
significant and large negative effect on the juvenile sex ratio at the 0.25 and its upper quantiles, while the
effect of female literacy and other infrastructural facility like safe drinking water have positive and
significant association on the upper tail of juvenile sex ratios in the districts of Rajasthan. The results of
regional dummy indicated that Udaipur, one among all divisions of Rajasthan has shown steep rise yet
insignificant, comes out looking much better and Bharatpur much worst division in terms of its
performance on in juvenile sex ratio between 1991 and 2011.
8. Suggestions
From a public policy perspective, it is reassuring to find that in districts where the juvenile sex ratio is
especially imbalanced i.e. districts of Bharatpur and Jaipur division, most public health interventions, such
as increased availability of safe drinking water, electricity and sanitation facilities increase the juvenile sex
ratio. Moreover, since policy makers ought to be primarily concerned about districts a the lower tail of the
juvenile sex ratio distribution, our results suggest a stronger need to target policies combating imbalanced
sex ratios to districts such as Jhunjhunu, Sikar and Jaipur. While outlawing prenatal sex determination tests
and sex-selective abortions could be considered an obvious policy response, this has already been
accomplished in India. Sex selection tests have been illegal in India under the 1994 Pre-conception and pre-
natal Diagnostic Techniques Act. Unfortunately, this has done little to stop sex selection abortions from
15
8. Journal of Economics and Sustainable Development www.iiste.org
ISSN 2222-1700 (Paper) ISSN 2222-2855 (Online)
Vol.3, No.1, 2012
taking place in Rajasthan. Enforcement of the law is weak, and there are loopholes in the law that allows
clinics and doctors to continue to perform sex determination tests. Strict enforcement of PCPNDT act is
essential for balancing child sex ratio in districts of Rajasthan.
Other than the public facilities we have focused on here, what could such imbalanced sex ratio-combating
policies be? A typical response may be to increase female literacy, as quantile regression shows that female
literacy had influenced positively in the upper tail of juvenile sex ratio. But an unusual, yet robust finding
of empirical framework is that higher male literacy rates in districts have a strong effect on juvenile sex
ratios. A possible explanation has to do with strong son-preference culture. As noted throughout this paper,
the root cause of imbalanced sex ratio is the strong preference for sons among Indian parents. While there
are many reasons for this, one is that, historically, inheritance laws in the country, especially among
Hindus, have favoured sons over daughters. Hindu inheritance customs were codified into law in a bill
enacted in 1956 that provided the right of inheriting ancestral property only to males. It is widely believed
that some of the worst manifestations of gender discrimination in India, such as female feticide and dowry,
can be traced to biased inheritance laws favouring sons. There may also be an economic reason for the
strong preference for sons among Indian parents. Son preference may be driven by the higher perceived
value (by parents) of male relative to female children. Given marriage systems and cultural traditions, sons
and not daughters are responsible for the care and upkeep of their parents in old age. One way in which
policy can respond is by providing old age benefits to couples that have instituted such schemes, albeit on a
very small scale. Evaluation of such programs presents a good area for future research.
During the last three decades, a few stalwart states, such as Andhra Pradesh, Karnataka, Maharashtra, and
Tamil Nadu, have changed their laws to provide women the right to inherit ancestral property (Kerala was
the first state to change its inheritance law in 1975). In 2004, the Indian parliament introduced and passed
the Hindu Succession (Amendment) Bill, which removed the discriminatory provisions of the 1956 Act and
allowed parents to bequeath their property to their daughters.
References
Agarwal, B. (1986), “Women, Poverty and Agriculture Growth in India” Journal of Peasant Studies,
13(4):165-220.
Basu, A.M. (1999), “Fertility Decline and Increasing Gender Imbalance in India, including a possible South
Indian Turnaround” Development and Change 30(2):237-63.
Berik, G. & Bilginsoy, C. (2000), “Type of work Matters: Wommen’s Labour force Participation and Child
Sex ratio in Turkkey”, World Development, Vol. 28, NO.5, pp. 861-878.
Buchinsky, M. 1994), “Changes in the U.S. Wage Structure 1963-1987: Application of Quantile
Regression.” Econometrica 62:405-27-58.
Census of India (2011), “Provisional Population Totals, Rajasthan”,Directorate of Census Operations,
Jaipur, Rajasthan.
Chakraborty, L. S. & Sinha D. (2008), “Determinants of Declining Child Sex Ratio in India: An Empirical
Investigation” Online at http://mpra.ub.uni-MUENCHEN.DE/7602
Dasgupta, M. & P.N.Mari Bhat. (1997), “Fertility Decline and Increased Manifestation of Sex Bias in
India.” Population Studies 51(3):307-15
Deolalikar, Anil B., Hasan R, & Somanathan, R.(2009), “Public Goods Access and Juvenile Sex Ratios in
Rural India: Evidence from the 1991 and 2001, Village Census Data” ADB Economics Working
Paper Series No. 167.
Dreze, J. & M. Murthi. (2001), “Fertility Education and Development: Evidence from India.” population
and Development Review 27(1):33-63.
D’Souza, S. & Lincoln C. Chen (1980), “Sex Differences in Mortality in Rural Bangladesh”, Population
and Development Review, Vol6, pp. 257-270.
Dyson, T. & M. Moore. (1983), “On Kinship Structure, Female autonomy and Demographic Balance”,
Population and Development Review 9:35-60
Elde, E. & Showalter, M.H. (1997), “Factors Affecting The Transmission of Earnings across Generations:
A Quantile Regression Approach”, Journal of Human Resources 34(2): 253-67.
16
9. Journal of Economics and Sustainable Development www.iiste.org
ISSN 2222-1700 (Paper) ISSN 2222-2855 (Online)
Vol.3, No.1, 2012
Fossett, M.A. & Kiecolt, K.J. (1991), “A Methodological review of the sex ratio ; alternatives for
comparative research”, Journal of marriage and family, Vol. 53, No. 4, pp.941-957.
Govt. of India (2006), “Rajasthan Development report” Planning commission, New Delhi.
Gujarati, D.N. (2003), “Basic Econometrics”, 4th Edition, McGraw-Hill International Edition
Hatti, N. & Shekhar, T. V. (2004), “Lives at Risk: Declining Child Sex Ratios in India.” Project lives at
Risk: Discrimination of Female Children in Modern India, Funded by the Swedish Research
Council. Mimeo.
International Institute for Population Sciences. (2007), “National Family Health Survey, India 2005-06.”
Jha,P., kumar, R., Vasa, P., Dhingra, N., Thiruchelvam, D. and Moineddin, R. (2006), “Low Male-To
Female Sex Ratio of Children Born in India: National Survey of 1.1 Million Households.” The
Lancet 367:211-8.
Klasen, S. and Wink. C. (2003). “Missing Women; Revisiting the Debate”. Feminist Economics, Vol.9(2-
3), PP.263-299.
Koenker, R. & Bassett, G. (1978), “Regression Quantiles.” Econometrica 46:33-50.
Kynch, J. & Sen, A. (1983), “Indian Women: Well being and Survival”, Cambridge Journal of Economics,
Vol. 7 (3-4), PP.363-380.
Mathur, K. & Rajagopal, S. (2011), “No Right To Be Born in Rajasthan” Economic and Political Weekly,
June 18, Volume XLVI NO 25.
Miller, B.D. (1989), “Changing patterns of Juvenile Sex Ratios in Rural India, 1961 to 1971”, Economic
and Political Weekly, PP. 1229-1236.
Park, C.B. & Cho, N. (1995), “Consequences of Son Preference in a Low Fertility Society; Imbalance of
the Sex Ratio at Birth in Korea”, Population and Development Review, Vol.21, NO.1 PP 59-84.
The Hindu (2011), “Decline in Sex ratio Shocking, Disgraceful Women Groups”, 3rd April.
The Times of India (2011), “India biased against girls, Child Sex ratio is lowest since1947”, 1st April.
The Times of India (2011), “Child Sex ratio in Rajasthan Shocking: Say NGOs”, 5th April.
Report (2008), “Human development report Rajasthan (An update 2008)”, Published by Institute of
development studies,Jaipur.
Rosenzweig, M.R. & Evenson, R. (1977), “Fertility Schooling and the Economic Contribution of Children
of Rural India: An Econometric Analysis.” Econometrica 45(5):1065-79.
Sen, A.K. (2003), “Missing Women - Revised.” British Medical Journal 327:1297-8.
Visaria, P.M. (1969), “The Sex Ratio of the Population of India”, Census of India 1961,1, Monograph
No.10, Office of the Registrar General, India, New Delhi.
Figure 1: Aggregate and Juvenile Sex Ratio in Rajasthan, 1901-2011
960
954
940
932
926
920 921 919 921
916
908 908 911 910 909
905 907 906
900 896
880 Sex Ratio 883
JSR
860
840
1901 1911 1921 1931 1941 1951 1961 1971 1981 1991 2001 2011
Sources: Directorate of census operations Rajasthan.
17
10. Journal of Economics and Sustainable Development www.iiste.org
ISSN 2222-1700 (Paper) ISSN 2222-2855 (Online)
Vol.3, No.1, 2012
Figur e 2: Juve nile (0-6 ye ar a) Se x Ratio, by Dis tr ict, 1991-2011
Bansw ara
Udaipur
Dungarpur
Bhilw ara
Jhalaw ar
Chittorgarh
Bikaner
Baran
Barmer
Churu
Pali
A jmer
Rajs amand
Jalore
Sirohi
Jodhpur
Kota
Nagaur
Bundi
RA JA STHA N
Tonk
Hanumangarh
Jaisalmer 2011
Saw ai Madhopur 2001
Bharatpur 1991
A lw ar
Jaipur
Dausa
Ganganagar
Dholpur
Karauli
Sikar
Jhunjhunu
750 800 850 900 950 1000
Source: http://rajcensus.gov.in/
F i g u r e 3 : P e r c e n t a g e C h a n g e i n C h i l d S e x R a t i o i n D i st r i c t s
of R a j a st h a n , 19 9 1- 2 0 11
B ar mer
B ikaner
Ud aip ur
Churu
Jaisalmer
Sawai M ad ho p ur
B hilwara
B aran
B har at p ur
A lwar
Jo d hp ur
Dung arp ur
Pali
Ko t a
Rajsamand
Karauli
Nag aur
A jmer
B answara
To nk
RA JA STH N
A
Hanumang arh
Jalo re
Jhalawar
Gang anag ar
Chit t o rg arh
B und i
Sikar
Dho lp ur
Jaip ur
Dausa
Sir o hi
Jhunjhunu
-10 -8 -6 % C 4 ng e i n - 2S R
- ha C 0 2 4
18
11. Journal of Economics and Sustainable Development www.iiste.org
ISSN 2222-1700 (Paper) ISSN 2222-2855 (Online)
Vol.3, No.1, 2012
19