Proposed seasonal autoregressive integrated moving average model for forecasting rainfall pattern in the navrongo municipality, ghana
•
2 likes•453 views

International peer-reviewed academic journals call for papers, http://www.iiste.org

Recommended
Recommended
More Related Content
What's hot
What's hot (16)
Similar to Proposed seasonal autoregressive integrated moving average model for forecasting rainfall pattern in the navrongo municipality, ghana
Similar to Proposed seasonal autoregressive integrated moving average model for forecasting rainfall pattern in the navrongo municipality, ghana (20)
More from Alexander Decker
More from Alexander Decker (20)
Recently uploaded
Recently uploaded (20)
Proposed seasonal autoregressive integrated moving average model for forecasting rainfall pattern in the navrongo municipality, ghana
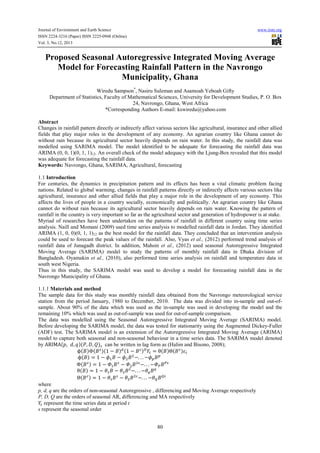
- 1. Journal of Environment and Earth Science ISSN 2224-3216 (Paper) ISSN 2225-0948 (Online) Vol. 3, No.12, 2013 www.iiste.org Proposed Seasonal Autoregressive Integrated Moving Average Model for Forecasting Rainfall Pattern in the Navrongo Municipality, Ghana Wiredu Sampson*, Nasiru Suleman and Asamoah Yeboah Gifty Department of Statistics, Faculty of Mathematical Sciences, University for Development Studies, P. O. Box 24, Navrongo, Ghana, West Africa *Corresponding Authors E-mail: kswiredu@yahoo.com Abstract Changes in rainfall pattern directly or indirectly affect various sectors like agricultural, insurance and other allied fields that play major roles in the development of any economy. An agrarian country like Ghana cannot do without rain because its agricultural sector heavily depends on rain water. In this study, the rainfall data was modelled using SARIMA model. The model identified to be adequate for forecasting the rainfall data was ARIMA (0, 0, 1)(0, 1, 1)12. An overall check of the model adequacy with the Ljung-Box revealed that this model was adequate for forecasting the rainfall data. Keywords: Navrongo, Ghana, SARIMA, Agricultural, forecasting 1.1 Introduction For centuries, the dynamics in precipitation pattern and its effects has been a vital climatic problem facing nations. Related to global warming, changes in rainfall patterns directly or indirectly affects various sectors like agricultural, insurance and other allied fields that play a major role in the development of any economy. This affects the lives of people in a country socially, economically and politically. An agrarian country like Ghana cannot do without rain because its agricultural sector heavily depends on rain water. Knowing the pattern of rainfall in the country is very important so far as the agricultural sector and generation of hydropower is at stake. Myriad of researches have been undertaken on the patterns of rainfall in different country using time series analysis. Naill and Momani (2009) used time series analysis to modelled rainfall data in Jordan. They identified ARIMA (1, 0, 0)(0, 1, 1)12 as the best model for the rainfall data. They concluded that an intervention analysis could be used to forecast the peak values of the rainfall. Also, Vyas et al., (2012) performed trend analysis of rainfall data of Junagadh district. In addition, Mahsin et al., (2012) used seasonal Autoregressive Integrated Moving Average (SARIMA) model to study the patterns of monthly rainfall data in Dhaka division of Bangladesh. Oyamakin et al., (2010), also performed time series analysis on rainfall and temperature data in south west Nigeria. Thus in this study, the SARIMA model was used to develop a model for forecasting rainfall data in the Navrongo Municipality of Ghana. 1.1.1 Materials and method The sample data for this study was monthly rainfall data obtained from the Navrongo meteorological service station from the period January, 1980 to December, 2010. The data was divided into in-sample and out-ofsample. About 90% of the data which was used as the in-sample was used in developing the model and the remaining 10% which was used as out-of-sample was used for out-of-sample comparison. The data was modelled using the Seasonal Autoregressive Integrated Moving Average (SARIMA) model. Before developing the SARIMA model, the data was tested for stationarity using the Augmented Dickey-Fuller (ADF) test. The SARIMA model is an extension of the Autoregressive Integrated Moving Average (ARIMA) model to capture both seasonal and non-seasonal behaviour in a time series data. The SARIMA model denoted by ARIMA , , , , can be written in lag form as (Halim and Bisono, 2008); ϕ Φ 1− 1− =θ Θ ϕ =1− − −. . . − ! ! Φ = 1−" −" −. . . −"# # θ = 1−$ −$ −. . . −$% % Θ =1−$ −$ −. . . −$& & where p, d, q are the orders of non-seasonal Autoregressive , differencing and Moving Average respectively P, D, Q are the orders of seasonal AR, differencing and MA respectively represent the time series data at period t s represent the seasonal order 80
- 2. Journal of Environment and Earth Science ISSN 2224-3216 (Paper) ISSN 2225-0948 (Online) Vol. 3, No.12, 2013 www.iiste.org B represent backward shift operator represent white noise error at period t To avoid fitting an over parameterized model, the Akiake Information Criterion (AIC), the corrected Akiake Information Criterion (AICc) and the Bayesian Information Criterion (BIC) were employed in selecting the best model. The model with the minimum values of these information criteria is considered as the best. In addition, the Root Mean Square Error (RMSE), the Mean Absolute Error (MAE) and the Mean Absolute Percentage Error (MAPE) were employed for in-sample and out-of-sample comparison of the best two model selected by the various information criteria. Finally, in order to use the best model developed for any meaningful generalisation, the model was diagnosed. The Autocorrelation Function (ACF) plot of the model residual was examined to see whether the residuals of the model are white noise. The Ljung-Box Q statistic was also used to check for overall adequacy of the model. In addition, the correlation matrix of the model parameters was examined to ensure that multicollinearity does not exist. 1.1.2 Results and discussion The maximum rainfall recorded was 496.60mm and the minimum rainfall was 0.00mm during the period under consideration. The average rainfall was 75.13mm. In addition, the coefficient of variation of 125.44mm was a clear indication that the data was not stationary. The time series plot (Fig 1) of the data showed that there is seasonality in the data. This can be seen clearly from the correlogram (Fig 2) as both the ACF and PACF of the data showed significant spikes at the various seasonal lags. The data was further tested for stationarity using the Augmented Dickey-Fuller (ADF) test. The ADF test statistic of -13.64 with a p-value = 0.07 indicates that the data was not stationary at the 5% level of significance. The data was then transformed using logarithmetic transformation and seasonally differenced to make the data stationary. As shown in Fig 3, the first seasonal difference was enough to make the data stationary as the differenced series fluctuates about the zero point indicating constant mean and variance which affirms that the series is stationary. Also, the ADF test was again applied on the transformed seasonally differenced series. The ADF test statistic of -6.74 and p-value = 0.01 indicates the data was stationary at the 5% level of significance. Furthermore, the correlogram (Fig 4) of the differenced series affirms that the data is stationary after the first seasonal difference as both the ACF and PACF of the seasonally differenced series decays rapidly with few significant lags. From Fig 4, the ACF showed a significant spike at seasonal lag 12 and lag 48 indicating that a seasonal moving average component needs to be added to our model. Also, the PACF showed significant spikes at seasonal lag 12, lag 24, lag 36 and lag 48 indicating that a seasonal autoregressive component needs to be added to our model. In addition, both the ACF and PACF of the transformed differenced series cuts-off after lag 1 with few significant spikes at other non-seasonal lags. Thus, different ARIMA (p, d, q)(P, D, Q)12 models were fitted to the transformed data and the best model was selected based on the minimum values of AIC, AICc, and BIC. From Table 1, ARIMA (1, 0, 0)(0, 1, 1)12 and ARIMA (0, 0, 1)(0, 1, 1)12 were the top two competing models because they have the least values of AIC, AICc and BIC. These two models were again compared based on the in-sample and out-of-sample forecast performance. From Table 2, ARIMA (0, 0, 1)(0, 1, 1)12 appears to perform better than ARIMA (1, 0, 0)(0, 1, 1)12 for both in-sample and out-of –sample forecasting performance. Thus, the parameters of ARIMA (0, 0, 1)(0, 1, 1)12 were then estimated. As shown in Table 3, all the parameters were significant. In addition, the model was diagnosed to see how well it fits the data. It can been from Fig 5 that the ACF of the model residuals were white noise despite the few significant spikes at lag 6 and lag 12 which could be attributable to random factors. Also, the Ljung-Box statistic shown in Table 4, indicates that ARIMA (0, 0, 1)(0, 1, 1)12 is appropriate for modelling the rainfall data. Finally, the correlation matrix of ARIMA (0, 0, 1)(0, 1, 1)12 model was examined. As shown in Table 5, the correlation between the parameters of the model was a weaker one. This means that all the parameters are = 1 + 0.1798 1− important in fitting the model. Thus, the fitted model is given by 1− 0.9403 . 1.1.3 Conclusion In this study, the rainfall pattern of Navrongo Municipality was model using the seasonal autoregressive integrated moving average model. The model identified to be best for the rainfall data was ARIMA (0, 0, 1)(0, 1, 1)12. The model was diagnosed to check if it is adequate for modelling the rainfall pattern. The Ljung-Box statistic indicated that the model was adequate for modelling the rainfall pattern. References Box, G. E. P. and Jenkins, G. M, (1976). Time Series Analysis, Forecasting and Control. San Fracisco, Holden Day, California, USA. Halim, S. and Bisono, I. N, (2008). Automatic Seasonal Autoregressive Moving Average Models and Unit Root 81
- 3. Journal of Environment and Earth Science ISSN 2224-3216 (Paper) ISSN 2225-0948 (Online) Vol. 3, No.12, 2013 www.iiste.org Test Detection. International Journal of Management Science and Engineering Management, 3(4): 266-274. Mahsin Md., Akhter, Y. and Begum, M, (2012). Modelling Rainfall Data in Dhaka Division of Bangladesh Using Time Series Analysis. Journal of Mathematical Modelling and Applications, 1(5): 67-73. Naill, P. E. and Momani, M, (2009). Time Series Analysis Model for Rainfall Data in Jordan: Case Study for Using Time Series Analysis. American Journal of Environmental Sciences, 5(5): 599-604. Oyamakin, S. O., Ayoola, F. J. and Dare O. T, (2010). Time Series Analysis of Rainfall and Temperature in South West Nigeria. Pacific Journal of Science and Technology, 1(2): 552-564. Vyas, J. H., Shrimali, N. J. and Modi M. A, (2012). Trend Analysis of Rainfall of Junagadh District. Indian Journal of Research, 1(10): 74-75. Table 1: Suggested models for the Rainfall pattern Model AIC AICc BIC ARIMA (1, 0, 0)(1, 1, 1)12 593.17 593.3 608.27 ARIMA (0, 0, 1)(1, 1, 1)12 592.80 592.93 607.90 ARIMA (1, 0, 1)(0, 1, 1)12 593.00 593.13 608.10 ARIMA (1, 0, 0)(0, 1, 1)12 591.42 591.50 602.75 ARIMA (0, 0, 1)(0, 1, 1)12 591.03 591.10 602.35 Table 2: In-Sample and Out-of-Sample comparison of top two competing models Model IN-SAMPLE OUT-OF-SAMPLE RMSE MAE MAPE RMSE MAE MAPE 0.5542 0.3805 10.8993 0.2214 0.1260 3.500 ARIMA (0, 0, 1)(0, 1, 1) 0.5539* 0.3800* *: Means best based on the measure of accuracy 10.8736* 0.2181* 0.1177* 3.1476* ARIMA (1, 0, 0)(0, 1, 1) Table 3: Estimates of parameters of ARIMA (0, 0, 1)(0, 1, 1)12 model Type coefficient Standard Error T-statistic P-value MA 1 -0.1798 0.0552 -3.26 0.001 SMA (12) 0.9403 0.0308 30.56 0.000 Table 4: Ljung-Box test statistic for model diagnostics Lags Test statistic p-value lag 12 20.800 0.230 lag 24 32.800 0.065 lag 36 43.900 0.119 Table 5: Correlation matrix of ARIMA (0, 0, 1)(0, 1, 1)12 model parameters Parameter MA1 SMA (12) MA 1 1 -0.033 SMA (12) -0.033 1 82
- 4. Journal of Environment and Earth Science ISSN 2224-3216 (Paper) ISSN 2225-0948 (Online) Vol. 3, No.12, 2013 www.iiste.org 500 450 400 350 RAIN 300 250 200 150 100 50 0 1980 1985 1990 1995 2000 2005 2010 Fig 1: Time series plot of Rainfall data ACF for RAIN 1 +- 1.96/T^0.5 0.5 0 -0.5 -1 0 10 20 30 40 50 lag PACF for RAIN 1 +- 1.96/T^0.5 0.5 0 -0.5 -1 0 10 20 30 lag Fig 2: Correlogram (ACF and PACF) of Rainfall data 83 40 50
- 5. Journal of Environment and Earth Science ISSN 2224-3216 (Paper) ISSN 2225-0948 (Online) Vol. 3, No.12, 2013 www.iiste.org 4 3 2 RAIN 1 0 -1 -2 -3 -4 1985 1990 1995 2000 2005 2010 Fig 3: Seasonal first difference of Rainfall data ACF for sd_l_RAIN 1 +- 1.96/T^0.5 0.5 0 -0.5 -1 0 10 20 30 40 50 lag PACF for sd_l_RAIN 1 +- 1.96/T^0.5 0.5 0 -0.5 -1 0 10 20 30 40 lag Fig 4: Correlogram (ACF and PACF) of seasonally first differenced Rainfall data 84 50
- 6. Journal of Environment and Earth Science ISSN 2224-3216 (Paper) ISSN 2225-0948 (Online) Vol. 3, No.12, 2013 www.iiste.org ACF of Residuals for RAIN (with 5% significance limits for the autocorrelations) 1.0 0.8 Autocorrelation 0.6 0.4 0.2 0.0 -0.2 -0.4 -0.6 -0.8 -1.0 1 6 12 18 24 30 Lag 36 42 48 Fig 5: ACF of ARIMA (0, 0, 1)(0, 1, 1)12 model residuals 85 54 60
- 7. This academic article was published by The International Institute for Science, Technology and Education (IISTE). The IISTE is a pioneer in the Open Access Publishing service based in the U.S. and Europe. The aim of the institute is Accelerating Global Knowledge Sharing. More information about the publisher can be found in the IISTE’s homepage: http://www.iiste.org CALL FOR JOURNAL PAPERS The IISTE is currently hosting more than 30 peer-reviewed academic journals and collaborating with academic institutions around the world. There’s no deadline for submission. Prospective authors of IISTE journals can find the submission instruction on the following page: http://www.iiste.org/journals/ The IISTE editorial team promises to the review and publish all the qualified submissions in a fast manner. All the journals articles are available online to the readers all over the world without financial, legal, or technical barriers other than those inseparable from gaining access to the internet itself. Printed version of the journals is also available upon request of readers and authors. MORE RESOURCES Book publication information: http://www.iiste.org/book/ Recent conferences: http://www.iiste.org/conference/ IISTE Knowledge Sharing Partners EBSCO, Index Copernicus, Ulrich's Periodicals Directory, JournalTOCS, PKP Open Archives Harvester, Bielefeld Academic Search Engine, Elektronische Zeitschriftenbibliothek EZB, Open J-Gate, OCLC WorldCat, Universe Digtial Library , NewJour, Google Scholar