SlideShare una empresa de Scribd logo
1 de 11
Descargar para leer sin conexión
CENG 176A, Winter 2016
Drews, Zhang, Yang, Xu, and Vazquez-Mena
Section A02 (M/W), Team 13: The Village, Lab 1:
Comparing electrical potential difference and
characteristic curve performance
between hydrogen and direct methanol fuel
cells
Part I: Edwin O. Ram´on Samayoa
Part II: Alexander Michael Nootens
Part III: Jinyoung Choi
Part IV: Lourdes Marie Kristen Samson
Abstract
Fuel cells are of utmost importance to alleviate electricity generation. Hydrogen fuel cells
and direct methanol fuel cells find applications in transportation and portable electronic devices.
Performance parameters were examined to determine the range of power applications best suited
for each fuel cell. The experimental open circuit voltage for a hydrogen fuel cell and 3%, 2%, 1%
concentration direct methanol fuel cell were 0.635 V and 0.157 V, 0.102 V, 0.092 V respectively.
The characteristic curve coefficients establishing the relationship between voltage and current for
a hydrogen fuel cell were determined as E0,R = 892.1 mV, b = 44.6 mV
dec, R = 0.359 Ω cm2 with
R2 value of 0.9809. The coefficients for 3%, 2%, 1% direct methanol fuel cells were E0,R = 507.9
mV, b = 87.5 mV
dec, R = 0.590 Ω cm2 with R2 value of 0.997; E0,R = 547.5 mV, b = 45.5 mV
dec,
R = 0.626 Ω cm2 with R2 value of 0.993; and E0,R = 567.2 mV, b = 55.3 mV
dec, R = 0.998 Ω cm2
with R2 value of 0.994. A series circuit of direct methanol and hydrogen fuel cell yielded the
following coefficients:E0,R = 1.36 V, b = 152.6 mV
dec, R = 0.654 Ω cm2 with R2 value of 0.965. The
cell potentials was 0.15V. Potential applications for this arrangement can be systems where high
power is needed constantly with little fluctuation. As the fuel for a hydrogen fuel cell runs out, the
cell potential creeps downward. Adding the direct methanol fuel cell adds reliability to the system
since a constant fuel source is not needed once the system is loaded.
1 Introduction
World energy requirements have increased as a consequence of increased standard of living.1 Hu-
man activities such as water heating, passenger cars, manufacturing, and agricultural irrigation are
staples in modern nations.2 In 2012, about 84% of consumed energy in the United States came
from non-renewable sources of oil, gas, and coal.3 Dependency on non-renewable sources hampers
future growth as the resource depletes. Renewable energy sources must take on the responsibility
to keep powering the built infrastructure so a smooth transition between renewable and nonrenew-
able sources can take place. In addition, a delicate balance must be struck between energy sources
and the environment. Different sources such as wind power, nuclear power, and fuel cells are
highly regarded as leading the change.
Fuel cells convert the chemical potential energy of a fuel and an oxidant into electrical energy.4
They are categorized by the utilized electrolyte or the type of fuel used.5 For example, polymer
electrolyte membrane or proton exchange membrane fuel cell (PEMFC) uses a polymer electrolyte
and is the most common type of fuel cell. The first fuel cell vehicle was powered with a PEMFC
in 1994 and since has received the bulk of attention in research and investment.6 A hydrogen fuel
cell is a PEMFC and utilizes hydrogen as a fuel source and oxygen directly or indirectly through
air. The direct methanol fuel cell (DMFC) is categorized as a type of PEMFC, but is distinctively
named after its fuel source. DMFCs have the potential to replace current lithium ion batteries due
to their advantages in specific energy density that would replace portable electronic devices.7
However, issues that restrain widespread adoption include costly components such as the cat-
alyst, performance degradation with the introduction of impurities, and low temperature waste
1Rashid, M. H., Alternative Energy in Power Electronics, 1st ed.; Elsevier Science: 225 Wyman Street, Waltham,
MA 02451, USA, 2014, pp 81–89.
2Ibid.
3Ibid.
4Behling, N. H., Fuel Cells: Current Technology Challenges and Future Research Needs, 1st ed.; Elsevier: Radar-
weg 29, PO Box 211, 1000 AE Amsterdam, The Netherlands, 2012, pp 36–.
5Ibid.
6Ibid.
7Kamarudin, S. et al. Overview on the application of direct methanol fuel cell (DMFC) for portable electronic
devices. INT J HYDROGEN ENERG 2009, 34, 6902–6916.
1
heat.8 Advantages due to low operating temperatures, quick start-up, and low corrosion make this
applicable in portable power and transportation that make this technology of special interest.9 Dis-
tinguishing between the hydrogen fuel cell and the direct methanol fuel cell is of interest to solidify
understanding of the working potential energy.
2 Background
In the PEM fuel cell, the chemical energy is released from the half reactions of oxygen and hy-
drogen gas and transformed into electrical energy. When hydrogen gas is oxidized at the anode, it
releases two protons and two electrons. The protons will then migrate across the electrolyte mem-
brane to the cathode, thereby reacting with the oxygen. The electrons produced from the anode
will be forced to flow into an external electric circuit. At the cathode side, the oxygen gas will
react with the protons to produce water, it being the only waste product from the PEM fuel cell.
In order to split the hydrogen gas and the oxygen gas, a catalyst is used. Hydrogen gas is easier
to split than the oxygen gas and by splitting the oxygen gas, significant electric loss is resulted.
Platinum is so far the best material used for the catalyst but research is being done to find cheaper
alternatives for the fuel cell. The PEM fuel cell produces 1.229 V and the efficiency of a PEM is
said to be about 40-60%.10 There are several downsides to using a PEM fuel cell, some including
the high price of platinum being used in the fuel cell and the low practical efficiency of the current
PEM fuel cell. Other materials are being researched, including different polymer membranes (per-
fluorinated, partially fluorinated, non-fluorinated, non-fluorinated composite), gas diffusion layers,
and different catalyst layers (single metal catalysts, binary catalysts, tertiary catalysts).11
In this lab, direct methanol fuel cell or DMFC will be used also. As the name states, methanol
is used as the fuel. Compared to some other fuel cells, DMFC has a low efficiency; however, since
8Behling, Fuel Cells: Current Technology Challenges and Future Research Needs.
9Ibid.
10Ibid.
11Mehta, V.; Cooper, J. S. Review and analysis of PEM fuel cell design and manufacturing. Journal of Power
Sources 2003, 114, 32–53.
2
DMFC is very portable, it is used where energy and power density has a higher priority than the
efficiency. The efficiency of a DMFC is around 30%.12 This means that the fuel cell be stored with
energy and then when needed, it can be replaced quickly when the fuel cell is used up. Unlike the
PEM fuel cell, the DMFC uses a platinum-ruthenium catalyst on the anode. This catalyst draws
the proton released in the anode half reaction from the liquid methanol, thereby eradicating the
need of a fuel reformer. Methanol is used in usually 1-3% solution. The concentration is weak
because higher concentrations of methanol can diffuse through the membrane to the cathode. The
low concentration attributes to the weak efficiency of DMFC.13
3 Theory
In the PEM fuel cell, electrons are released through the anode half reaction and used up in the
cathode reaction. Knowing that Q is the total amount of charge passed through the system, the
number of moles of hydrogen, n, was calculated:
Q = nzF = tI, (1)
where z is the valence number of electrons of hydrogen, F is the Faraday constant, t is the time
passed. and I is the measured current. We assume ideal gas behavior and Vth
H2
was calculated:
Vth
H2
=
nRT
P
, (2)
where the Vth
H2
is the theoretical volume needed to provide the measured current. In the lab, Vc
H2
,
which is the volume of hydrogen being consumed over a given time, will be measured. The ratio
12Kamarudin et al., “Overview on the application of direct methanol fuel cell (DMFC) for portable electronic
devices”.
13Hacquard, A. Improving and Understanding Direct Methanol Fuel Cell (DMFC) Performance. 2005.
3
between the theoretical and the consumed volumes of hydrogen can be calculated:
ηFaraday =
Vth
H2
Vc
H2
, (3)
In the methanol fuel cell part of the lab, the cell potential and current density were measured.
These two measurements were used to graph a characteristic curve. There are three regions in the
characteristic curve: activation losses, ohmic losses, and mass transport losses. In the activation
losses region, the voltage drops quickly because energy is needed to start the reaction. This happens
on both the cathode and anode catalysts. The ohmic loss happens because of trying to resist the
flow of electrons through circuit and ions through membrane. Mass transport loss is another quick
fall due to losses in the reactants. The empirical formula is proposed by Kim et al:14
E = E0,R −blog j −Rj −menj
, (4)
where E0,R is the reversible cell potential, b is the oxygen reduction, R is the linear resistance,
and m is the mass transfer limitations. The constant m was set to zero because there was no mass
transfer loss because the reactants never ran out.
Figure 1: Wiring setup for a fuel cell to measure voltage and current.
Resistance is variable and can range up to 20 kΩ. The fuel cell was
either a hydrogen fuel cell or methanol fuel cell.
4
4 Methods
The wiring diagram in Fig. 1 was used to connect the fuel cell system. In addition, an electrolyzer
was connected via tubing to produce the oxygen and hydrogen fuel to the PEM fuel cell as shown in
Fig. 2. Air inside the tubing was purged three times by opening the clips on the tubing to allow the
oxygen and hydrogen to pass through.First, a characteristic curve is produced. The electrolyzer was
turned on to produce 20 mL hydrogen and 10 mL of oxygen. Current and voltage measurements
were taken as the resistance of the resistor box was changed. The electrolyzer was turned on
intermittently to ensure that volume of the gas chamber remained constant. A zero resistance was
selected to maximize the power drawn by the circuit. The timer was started and as the hydrogen
level dropped every 2 mL, voltage, current, and time was recorded. Methanol was flushed with
water to ensure that no fuel was left in the chamber. Start-up time was measured by connecting the
fan and then loading the fuel cell with the respective methanol concentration. The direct methanol
fuel cell was connected to the previous circuit to make the characteristic curve. The process was
repeated with the varying concentrations methanol. A hydrogen fuel cell and methanol fuel cell
were connected in series. The same steps were taken to produce a characteristic curve.
5 Results and Discussion
In order to calculate the current density in units of mA
cm2 for the hydrogen fuel cell the cross sectional
area of its membrane had to be determined. The height and width of the fuel cell were identical
14Et al, K. Modeling of Proton Exchange Membrane Fuel Cell Performance with an Empirical Equation. Journal of
the Electrochemical Society 1995, 142, 2670–2674.
Figure 2: Setup of PEM fuel cell. The electrolyzer in the top middle
produces the oxygen and hydrogen needed to power the hydrogen
fuel cell present in the bottom middle of the image.
5
-10 0 10 20 30 40 50 60 70
Current Density (mA/cm2
)
0.6
0.65
0.7
0.75
0.8
0.85
0.9
0.95
1
Voltage(V)
Hydrogen Fuel Cell Characteristic Curve
Data
Fit
Figure 3: This was the characteristic curve for the Hydrogen Fuel
Cell by manually changing resistance values via a decade resistance
box and recording the corresponding voltage and current density.
and were measured using a standard centimeter ruler and recorded as 2.9 +/- 0.2 cm. This 0.2 cm
error bound was sufficient to account for the possibility of a slightly low or high measurement for
height/width. The cross sectional area was therefore calculated to be 8.4 +/- 0.2 cm with error
propagation. Each subsequent current measurement was divided by this number to obtain the
corresponding current density in the graph of the characteristic curve provided below. The error
bounds for each voltage measurement in the hydrogen fuel cell characteristic curve were set at 0.02
volts. The fluctuation in the voltmeter’s returned values for varying resistances prompted this error
bound. Similarly, the error bounds for the current measurements read from the ammeter were set at
0.2 mA for the same reason. The Faraday efficiency of the hydrogen fuel cell was determined using
the volume of hydrogen gas depleted over a specified time t with a corresponding recorded current
over that time period using Eq. (1).Using Eq. (1) and Eq. (3) the efficiency was calculated to be 14%
which was drastically lower than the typical efficiency of a hydrogen fuel cell of around 40-60%.
The reason for this low efficiency percentage was the direct result of incorrect data. The recorded
current readings range of 3-12.9 mA, that when compared to the data for the characteristic curve
are only a fraction of what they should be. For the characteristic curve data of the hydrogen cell at
time zero, with zero resistance, a current measurement of 540 mA was observed. When comparing
this to the data collected for the Faraday efficiency at the same conditions a current measurement
of 12.9 mA was observed. This drastic difference in the current was a clear indication that the
6
Figure 4: A table of the reversible cell potential, oxygen reduction,
linear resistance, and R best fit parameters excluding mass trans-
fer limitations. These measurements were taken using MATLAB’s
cftool for a variety of different fuel cell types and set-ups listed
within the table.
data collected was incorrect for a regularly functioning hydrogen fuel cell. Unfortunately, this was
the first experiment conducted in the lab and the magnitude of the incorrect current measurements
went unnoticed. It can be noted that the cause of the low current and voltage measurements for
this section of the lab can be attributed to the collection of water inside the fuel cell membrane.
In order to fit the hydrogen characteristic curve to the cell potential equation provided below
MATLAB’s cftool was used Eq. (4). The exponential term in the cell potential equation corre-
sponds to mass transfer limitation of the reactants of the fuel cell. In this experiment there were
always an excess of reactants, hence, the m and n coefficients of the mass transfer limitations were
set to zero when modeling the equation. This simplification was also justified by examining the
characteristic curve and making the observation that there was no dramatic loss in voltage at high
current density where mass transfer limitations are normally observed. After using the cftool with
the simplified equation model the results obtain are displayed in Figure 9. When comparing the fit
parameters of the hydrogen fuel cell in lab to those within similar research articles the results were
analogous. In the research paper15 the parameters for reversible cell potential, oxygen reduction,
and linear resistance for a PEM fuel cell were determined to be 981 mV, 66.9 mV
dec, and 0.355 Ω
cm2 respectively. The linear resistance term determined by the best fit model was almost identical
to that of the one determined by Kim with a difference of only 1.1%. The reversible cell potentials
are also very similar with a percentage difference of approximately 10%. The largest deviation of
the compared data sets was between the oxygen reduction values yielding a percentage difference
15Et al, “Modeling of Proton Exchange Membrane Fuel Cell Performance with an Empirical Equation”.
7
-1 0 1 2 3 4 5 6 7 8
Current Density (mA/cm2
)
0.1
0.2
0.3
0.4
0.5
0.6
0.7
Voltage(V)
3% Methanol Fuel Cell Characteristic Curve
Data
Fit
Figure 5: This was a characteristic curve for the 3% methanol fuel
cell which contains the highest current density and open circuit volt-
age of the series. The error bounds were determined by the fluctua-
tions in voltage and ampere readings from the digital multimeter.
-1 0 1 2 3 4 5
Current Density (mA/cm2
)
0.1
0.2
0.3
0.4
0.5
0.6
0.7
Voltage(V)
2% Methanol Fuel Cell Characteristic Curve
Data
Fit
Figure 6: This was a characteristic curve for the 2% methanol fuel
cell which has the median current density and open circuit voltage
as should be expected.
of close to 50%. The large percentage difference between these two values can be explained by the
fuel cell’s lack of interaction with oxygen at the cathode. A leak in oxygen supply line would result
in a lower concentration of oxygen needed to react with the protons and electrons at the cathode
necessary for oxidation.
The characteristic curves of the methanol fuel cells illustrate a few important concepts re-
garding current density and open circuit voltage. As the graphs depict, when the concentration of
methanol was increased the current density range was also increased but at lower voltages. In addi-
tion, the open circuit voltage was the greatest at the highest concentration of methanol even though
the magnitude of their voltage range was essentially identical. When comparing the maximum
8
-1 0 1 2 3 4 5
Current Density (mA/cm2
)
0
0.1
0.2
0.3
0.4
0.5
0.6
0.7
Voltage(V)
1% Methanol Fuel Cell Characteristic Curve
Data
Fit
Figure 7: This was a characteristic curve for the 1% methanol fuel
cell which has the lowest current density and open circuit voltage of
the series.
-5 0 5 10 15 20
Current Density (mA/cm2
)
0
0.2
0.4
0.6
0.8
1
1.2
1.4
1.6
Voltage(V)
Hydrogen and 3% Methanol Fuel Cell in Series
Data
Fit
Figure 8: This is a characteristic curve for a 3% methanol and hydro-
gen fuel cell in series The error bounds were determined by minor
fluctuations in the volt and amp meter.
voltage of the methanol fuel cell to that of the hydrogen, it should be noted that the hydrogen cell
has the highest voltage potential and largest current density at it’s lowest voltage values. One of the
benefits of the methanol cell was it’s ability to operate without a electrolyzer. This has one main
distinct advantage, it does not require other outside voltage sources to pre-treat it’s reactants which
allows all of its voltage potential to be used in powering other devices. Even though methanol fuel
cells have this advantage hydrogen fuel cells are still typically preferred for their higher maximum
voltage potential and current densities as seen in Figures 5-8.
In order to obtain adequate voltage to power large devices fuel cells are typically used in series
to increase the voltage potential. In this specific case, a hydrogen fuel cell and a 3% methanol fuel
9
cell were placed in series to obtain the largest possible voltage potential. The maximum voltage
potential measured was 1.58 +/- 0.02V while the maximum current density was recorded as 16.8
+/- 0.2 mA. The 3% methanol cell has a maximum voltage potential of 0.62 +/- 0.02 V and the
hydrogen cell has a maximum voltage potential of 0.96 +/- 0.02 V. When two cells are placed in
series the voltage potentials should add together, when added the dual maximum voltage potential
was calculated to be 1.58 +/- 0.4 V. This value was identical to the value measured in lab proving
the voltage potential addition of cells in series.
6 Conclusions
The higher voltage for a hydrogen fuel cell justifies and promotes its use in higher power applica-
tions. Theoretically methanol should have a higher power density, but the concentration gradient
limited the power throughput. The determined efficiency of the hydrogen fuel cell was drastically
lower than expected. Further repeated experiments should be conducted to improve the result and
minimize water flooding in the fuel cell. A noteworthy result was that as the methanol concen-
tration increased, about the same open circuit voltage was recorded. However, maximum current
density increased as the concentration of methanol increased. Methanol crossover did not affect
the measurable performance of the fuel cells. Future groups should attempt to use higher con-
centrations. Combining the hydrogen fuel cell and DMFC in series complement each other by
producing a high open circuit voltage and high current density. An application could be a backup
power generator that can power high voltage appliances and in a quick fashion due to the high
current density. Further explorations can be made into parallel circuits in differing combinations
of hydrogen and methanol fuel cells.
10

Más contenido relacionado

La actualidad más candente

Maiyalagan, Components of pem fuel cells an overview
Maiyalagan, Components of pem fuel cells an overviewMaiyalagan, Components of pem fuel cells an overview
Maiyalagan, Components of pem fuel cells an overviewkutty79
 
Study on Coupling Model of Methanol Steam Reforming and Simultaneous Hydrogen...
Study on Coupling Model of Methanol Steam Reforming and Simultaneous Hydrogen...Study on Coupling Model of Methanol Steam Reforming and Simultaneous Hydrogen...
Study on Coupling Model of Methanol Steam Reforming and Simultaneous Hydrogen...IOSR Journals
 
Proton Exchange Membrane Fuel Cell Design and Dynamic Modeling in MATLAB
Proton Exchange Membrane Fuel Cell Design and Dynamic Modeling in MATLABProton Exchange Membrane Fuel Cell Design and Dynamic Modeling in MATLAB
Proton Exchange Membrane Fuel Cell Design and Dynamic Modeling in MATLABIJERA Editor
 
Fuel cell final
Fuel cell final Fuel cell final
Fuel cell final alikhan1414
 
proton exchange membrane fuel cell
proton exchange membrane fuel cellproton exchange membrane fuel cell
proton exchange membrane fuel cellSubir paul
 
Characterization of Electrospun Nafion-Poly Acrylic Acid Membranes, Breakthro...
Characterization of Electrospun Nafion-Poly Acrylic Acid Membranes, Breakthro...Characterization of Electrospun Nafion-Poly Acrylic Acid Membranes, Breakthro...
Characterization of Electrospun Nafion-Poly Acrylic Acid Membranes, Breakthro...drboon
 
PROTON EXCHANGE MEMBRANE FUEL CELL: POWERING AVIATION
PROTON EXCHANGE MEMBRANE FUEL CELL: POWERING AVIATIONPROTON EXCHANGE MEMBRANE FUEL CELL: POWERING AVIATION
PROTON EXCHANGE MEMBRANE FUEL CELL: POWERING AVIATIONMohit Rajput
 
Proton Exchange Membrane Fuel Cell
Proton Exchange Membrane Fuel CellProton Exchange Membrane Fuel Cell
Proton Exchange Membrane Fuel CellMohit Rajput
 
Performance comparison of PEMFC hydrogen reformer with different controllers
Performance comparison of PEMFC hydrogen reformer with different controllersPerformance comparison of PEMFC hydrogen reformer with different controllers
Performance comparison of PEMFC hydrogen reformer with different controllersTELKOMNIKA JOURNAL
 
Experimental study on transient response of fuel cell
Experimental study on transient response of fuel cellExperimental study on transient response of fuel cell
Experimental study on transient response of fuel celljournalBEEI
 
EnerFuel EV Range Extender
EnerFuel EV Range ExtenderEnerFuel EV Range Extender
EnerFuel EV Range ExtenderDaniel Betts
 
proton exchange membrane based high temperature fuel cell (PEMFC))
proton exchange membrane based  high temperature fuel cell (PEMFC))proton exchange membrane based  high temperature fuel cell (PEMFC))
proton exchange membrane based high temperature fuel cell (PEMFC))Jaffer Alam
 

La actualidad más candente (18)

Maiyalagan, Components of pem fuel cells an overview
Maiyalagan, Components of pem fuel cells an overviewMaiyalagan, Components of pem fuel cells an overview
Maiyalagan, Components of pem fuel cells an overview
 
Pemfc ppt
Pemfc pptPemfc ppt
Pemfc ppt
 
fuel cell
fuel cell fuel cell
fuel cell
 
Study on Coupling Model of Methanol Steam Reforming and Simultaneous Hydrogen...
Study on Coupling Model of Methanol Steam Reforming and Simultaneous Hydrogen...Study on Coupling Model of Methanol Steam Reforming and Simultaneous Hydrogen...
Study on Coupling Model of Methanol Steam Reforming and Simultaneous Hydrogen...
 
Proton Exchange Membrane Fuel Cell Design and Dynamic Modeling in MATLAB
Proton Exchange Membrane Fuel Cell Design and Dynamic Modeling in MATLABProton Exchange Membrane Fuel Cell Design and Dynamic Modeling in MATLAB
Proton Exchange Membrane Fuel Cell Design and Dynamic Modeling in MATLAB
 
Fuel cell final
Fuel cell final Fuel cell final
Fuel cell final
 
proton exchange membrane fuel cell
proton exchange membrane fuel cellproton exchange membrane fuel cell
proton exchange membrane fuel cell
 
Characterization of Electrospun Nafion-Poly Acrylic Acid Membranes, Breakthro...
Characterization of Electrospun Nafion-Poly Acrylic Acid Membranes, Breakthro...Characterization of Electrospun Nafion-Poly Acrylic Acid Membranes, Breakthro...
Characterization of Electrospun Nafion-Poly Acrylic Acid Membranes, Breakthro...
 
PROTON EXCHANGE MEMBRANE FUEL CELL: POWERING AVIATION
PROTON EXCHANGE MEMBRANE FUEL CELL: POWERING AVIATIONPROTON EXCHANGE MEMBRANE FUEL CELL: POWERING AVIATION
PROTON EXCHANGE MEMBRANE FUEL CELL: POWERING AVIATION
 
Proton Exchange Membrane Fuel Cell
Proton Exchange Membrane Fuel CellProton Exchange Membrane Fuel Cell
Proton Exchange Membrane Fuel Cell
 
Performance comparison of PEMFC hydrogen reformer with different controllers
Performance comparison of PEMFC hydrogen reformer with different controllersPerformance comparison of PEMFC hydrogen reformer with different controllers
Performance comparison of PEMFC hydrogen reformer with different controllers
 
Fuel cell ,PEM Fuel Cell
Fuel cell ,PEM Fuel CellFuel cell ,PEM Fuel Cell
Fuel cell ,PEM Fuel Cell
 
Experimental study on transient response of fuel cell
Experimental study on transient response of fuel cellExperimental study on transient response of fuel cell
Experimental study on transient response of fuel cell
 
FINAL PPT
FINAL PPTFINAL PPT
FINAL PPT
 
A1080107
A1080107A1080107
A1080107
 
EnerFuel EV Range Extender
EnerFuel EV Range ExtenderEnerFuel EV Range Extender
EnerFuel EV Range Extender
 
Fundamentals of Fuel Cells
Fundamentals of Fuel CellsFundamentals of Fuel Cells
Fundamentals of Fuel Cells
 
proton exchange membrane based high temperature fuel cell (PEMFC))
proton exchange membrane based  high temperature fuel cell (PEMFC))proton exchange membrane based  high temperature fuel cell (PEMFC))
proton exchange membrane based high temperature fuel cell (PEMFC))
 

Destacado

Destacado (11)

pH Control
pH ControlpH Control
pH Control
 
Continuous Rectification
Continuous RectificationContinuous Rectification
Continuous Rectification
 
ReverseOsmosisLabReport
ReverseOsmosisLabReportReverseOsmosisLabReport
ReverseOsmosisLabReport
 
Heat Exchanger
Heat ExchangerHeat Exchanger
Heat Exchanger
 
Cooling Tower
Cooling TowerCooling Tower
Cooling Tower
 
Microbial fuel cells report
Microbial fuel cells reportMicrobial fuel cells report
Microbial fuel cells report
 
Nrtl activity coefficient for mixture1
Nrtl activity coefficient for mixture1Nrtl activity coefficient for mixture1
Nrtl activity coefficient for mixture1
 
Fuel Cells
Fuel CellsFuel Cells
Fuel Cells
 
Fuel cells presentation
Fuel cells presentationFuel cells presentation
Fuel cells presentation
 
hydrogen fuel cell vehicle ppt
hydrogen fuel cell vehicle ppthydrogen fuel cell vehicle ppt
hydrogen fuel cell vehicle ppt
 
Hydrogen fuel cells
Hydrogen fuel cellsHydrogen fuel cells
Hydrogen fuel cells
 

Similar a Fuel Cell

Components of pem fuel cells an overview
Components of pem fuel cells an overviewComponents of pem fuel cells an overview
Components of pem fuel cells an overviewsunitha81
 
STUDY OF 1.26 KW – 24 VDC PROTON EXCHANGE MEMBRANE FUEL CELL’S (PEMFC’S) PARA...
STUDY OF 1.26 KW – 24 VDC PROTON EXCHANGE MEMBRANE FUEL CELL’S (PEMFC’S) PARA...STUDY OF 1.26 KW – 24 VDC PROTON EXCHANGE MEMBRANE FUEL CELL’S (PEMFC’S) PARA...
STUDY OF 1.26 KW – 24 VDC PROTON EXCHANGE MEMBRANE FUEL CELL’S (PEMFC’S) PARA...ecij
 
Micro bial fuel cell (modified)
Micro bial fuel cell (modified)Micro bial fuel cell (modified)
Micro bial fuel cell (modified)HaleemullahMShafiq
 
Components of pem_fuel_cells_an_overview
Components of pem_fuel_cells_an_overviewComponents of pem_fuel_cells_an_overview
Components of pem_fuel_cells_an_overviewmadlovescience
 
Components of pem_fuel_cells_an_overview
Components of pem_fuel_cells_an_overviewComponents of pem_fuel_cells_an_overview
Components of pem_fuel_cells_an_overviewtshankar20134
 
Components of pem_fuel_cells_an_overview
Components of pem_fuel_cells_an_overviewComponents of pem_fuel_cells_an_overview
Components of pem_fuel_cells_an_overviewmadlovescience
 
Cost Reduction of Direct Ethanol Fuel Cell by Changing Composition of Ethanol...
Cost Reduction of Direct Ethanol Fuel Cell by Changing Composition of Ethanol...Cost Reduction of Direct Ethanol Fuel Cell by Changing Composition of Ethanol...
Cost Reduction of Direct Ethanol Fuel Cell by Changing Composition of Ethanol...ijsrd.com
 
What are batteries, fuel cells, and supercapacitors
What are batteries, fuel cells, and supercapacitorsWhat are batteries, fuel cells, and supercapacitors
What are batteries, fuel cells, and supercapacitorsJupira Silva
 
Direct Alcohol Alkaline Fuel Cell as Future Prospectus
Direct Alcohol Alkaline Fuel Cell as Future ProspectusDirect Alcohol Alkaline Fuel Cell as Future Prospectus
Direct Alcohol Alkaline Fuel Cell as Future ProspectusAEIJjournal2
 
Direct Alcohol Alkaline Fuel Cell as Future Prospectus
Direct Alcohol Alkaline Fuel Cell as Future ProspectusDirect Alcohol Alkaline Fuel Cell as Future Prospectus
Direct Alcohol Alkaline Fuel Cell as Future ProspectusAEIJjournal2
 
Fuel Cell: Survey and Analysis
Fuel Cell: Survey and AnalysisFuel Cell: Survey and Analysis
Fuel Cell: Survey and AnalysisIJRES Journal
 
Fuel Cell- A Future Powerhouse
Fuel Cell- A Future PowerhouseFuel Cell- A Future Powerhouse
Fuel Cell- A Future PowerhouseDr. Sudhir Kumar
 
Sizing Optimization of Stand-Alone Wind Power System Using Hybrid Energy Stor...
Sizing Optimization of Stand-Alone Wind Power System Using Hybrid Energy Stor...Sizing Optimization of Stand-Alone Wind Power System Using Hybrid Energy Stor...
Sizing Optimization of Stand-Alone Wind Power System Using Hybrid Energy Stor...ijsrd.com
 
Designing Controller for Joined Dynamic Nonlinear PEMFC and Buck Converter Sy...
Designing Controller for Joined Dynamic Nonlinear PEMFC and Buck Converter Sy...Designing Controller for Joined Dynamic Nonlinear PEMFC and Buck Converter Sy...
Designing Controller for Joined Dynamic Nonlinear PEMFC and Buck Converter Sy...IJPEDS-IAES
 
Techno-Economic Study of Generating/Compressing Hydrogen Electrochemically, A...
Techno-Economic Study of Generating/Compressing Hydrogen Electrochemically, A...Techno-Economic Study of Generating/Compressing Hydrogen Electrochemically, A...
Techno-Economic Study of Generating/Compressing Hydrogen Electrochemically, A...Keith D. Patch
 

Similar a Fuel Cell (20)

Fuel Cell
Fuel CellFuel Cell
Fuel Cell
 
Components of pem fuel cells an overview
Components of pem fuel cells an overviewComponents of pem fuel cells an overview
Components of pem fuel cells an overview
 
STUDY OF 1.26 KW – 24 VDC PROTON EXCHANGE MEMBRANE FUEL CELL’S (PEMFC’S) PARA...
STUDY OF 1.26 KW – 24 VDC PROTON EXCHANGE MEMBRANE FUEL CELL’S (PEMFC’S) PARA...STUDY OF 1.26 KW – 24 VDC PROTON EXCHANGE MEMBRANE FUEL CELL’S (PEMFC’S) PARA...
STUDY OF 1.26 KW – 24 VDC PROTON EXCHANGE MEMBRANE FUEL CELL’S (PEMFC’S) PARA...
 
Micro bial fuel cell (modified)
Micro bial fuel cell (modified)Micro bial fuel cell (modified)
Micro bial fuel cell (modified)
 
C02011218
C02011218C02011218
C02011218
 
cntsasfuelcells.pptx
cntsasfuelcells.pptxcntsasfuelcells.pptx
cntsasfuelcells.pptx
 
Components of pem_fuel_cells_an_overview
Components of pem_fuel_cells_an_overviewComponents of pem_fuel_cells_an_overview
Components of pem_fuel_cells_an_overview
 
Components of pem_fuel_cells_an_overview
Components of pem_fuel_cells_an_overviewComponents of pem_fuel_cells_an_overview
Components of pem_fuel_cells_an_overview
 
Components of pem_fuel_cells_an_overview
Components of pem_fuel_cells_an_overviewComponents of pem_fuel_cells_an_overview
Components of pem_fuel_cells_an_overview
 
Cost Reduction of Direct Ethanol Fuel Cell by Changing Composition of Ethanol...
Cost Reduction of Direct Ethanol Fuel Cell by Changing Composition of Ethanol...Cost Reduction of Direct Ethanol Fuel Cell by Changing Composition of Ethanol...
Cost Reduction of Direct Ethanol Fuel Cell by Changing Composition of Ethanol...
 
What are batteries, fuel cells, and supercapacitors
What are batteries, fuel cells, and supercapacitorsWhat are batteries, fuel cells, and supercapacitors
What are batteries, fuel cells, and supercapacitors
 
Direct Alcohol Alkaline Fuel Cell as Future Prospectus
Direct Alcohol Alkaline Fuel Cell as Future ProspectusDirect Alcohol Alkaline Fuel Cell as Future Prospectus
Direct Alcohol Alkaline Fuel Cell as Future Prospectus
 
Direct Alcohol Alkaline Fuel Cell as Future Prospectus
Direct Alcohol Alkaline Fuel Cell as Future ProspectusDirect Alcohol Alkaline Fuel Cell as Future Prospectus
Direct Alcohol Alkaline Fuel Cell as Future Prospectus
 
Encycl o-e fuel-cells
Encycl o-e fuel-cellsEncycl o-e fuel-cells
Encycl o-e fuel-cells
 
Fuel Cell: Survey and Analysis
Fuel Cell: Survey and AnalysisFuel Cell: Survey and Analysis
Fuel Cell: Survey and Analysis
 
Fuel Cell- A Future Powerhouse
Fuel Cell- A Future PowerhouseFuel Cell- A Future Powerhouse
Fuel Cell- A Future Powerhouse
 
Types of fuel cells
Types of fuel cellsTypes of fuel cells
Types of fuel cells
 
Sizing Optimization of Stand-Alone Wind Power System Using Hybrid Energy Stor...
Sizing Optimization of Stand-Alone Wind Power System Using Hybrid Energy Stor...Sizing Optimization of Stand-Alone Wind Power System Using Hybrid Energy Stor...
Sizing Optimization of Stand-Alone Wind Power System Using Hybrid Energy Stor...
 
Designing Controller for Joined Dynamic Nonlinear PEMFC and Buck Converter Sy...
Designing Controller for Joined Dynamic Nonlinear PEMFC and Buck Converter Sy...Designing Controller for Joined Dynamic Nonlinear PEMFC and Buck Converter Sy...
Designing Controller for Joined Dynamic Nonlinear PEMFC and Buck Converter Sy...
 
Techno-Economic Study of Generating/Compressing Hydrogen Electrochemically, A...
Techno-Economic Study of Generating/Compressing Hydrogen Electrochemically, A...Techno-Economic Study of Generating/Compressing Hydrogen Electrochemically, A...
Techno-Economic Study of Generating/Compressing Hydrogen Electrochemically, A...
 

Fuel Cell

  • 1. CENG 176A, Winter 2016 Drews, Zhang, Yang, Xu, and Vazquez-Mena Section A02 (M/W), Team 13: The Village, Lab 1: Comparing electrical potential difference and characteristic curve performance between hydrogen and direct methanol fuel cells Part I: Edwin O. Ram´on Samayoa Part II: Alexander Michael Nootens Part III: Jinyoung Choi Part IV: Lourdes Marie Kristen Samson Abstract Fuel cells are of utmost importance to alleviate electricity generation. Hydrogen fuel cells and direct methanol fuel cells find applications in transportation and portable electronic devices. Performance parameters were examined to determine the range of power applications best suited for each fuel cell. The experimental open circuit voltage for a hydrogen fuel cell and 3%, 2%, 1% concentration direct methanol fuel cell were 0.635 V and 0.157 V, 0.102 V, 0.092 V respectively. The characteristic curve coefficients establishing the relationship between voltage and current for a hydrogen fuel cell were determined as E0,R = 892.1 mV, b = 44.6 mV dec, R = 0.359 Ω cm2 with R2 value of 0.9809. The coefficients for 3%, 2%, 1% direct methanol fuel cells were E0,R = 507.9 mV, b = 87.5 mV dec, R = 0.590 Ω cm2 with R2 value of 0.997; E0,R = 547.5 mV, b = 45.5 mV dec, R = 0.626 Ω cm2 with R2 value of 0.993; and E0,R = 567.2 mV, b = 55.3 mV dec, R = 0.998 Ω cm2 with R2 value of 0.994. A series circuit of direct methanol and hydrogen fuel cell yielded the following coefficients:E0,R = 1.36 V, b = 152.6 mV dec, R = 0.654 Ω cm2 with R2 value of 0.965. The cell potentials was 0.15V. Potential applications for this arrangement can be systems where high power is needed constantly with little fluctuation. As the fuel for a hydrogen fuel cell runs out, the cell potential creeps downward. Adding the direct methanol fuel cell adds reliability to the system since a constant fuel source is not needed once the system is loaded.
  • 2. 1 Introduction World energy requirements have increased as a consequence of increased standard of living.1 Hu- man activities such as water heating, passenger cars, manufacturing, and agricultural irrigation are staples in modern nations.2 In 2012, about 84% of consumed energy in the United States came from non-renewable sources of oil, gas, and coal.3 Dependency on non-renewable sources hampers future growth as the resource depletes. Renewable energy sources must take on the responsibility to keep powering the built infrastructure so a smooth transition between renewable and nonrenew- able sources can take place. In addition, a delicate balance must be struck between energy sources and the environment. Different sources such as wind power, nuclear power, and fuel cells are highly regarded as leading the change. Fuel cells convert the chemical potential energy of a fuel and an oxidant into electrical energy.4 They are categorized by the utilized electrolyte or the type of fuel used.5 For example, polymer electrolyte membrane or proton exchange membrane fuel cell (PEMFC) uses a polymer electrolyte and is the most common type of fuel cell. The first fuel cell vehicle was powered with a PEMFC in 1994 and since has received the bulk of attention in research and investment.6 A hydrogen fuel cell is a PEMFC and utilizes hydrogen as a fuel source and oxygen directly or indirectly through air. The direct methanol fuel cell (DMFC) is categorized as a type of PEMFC, but is distinctively named after its fuel source. DMFCs have the potential to replace current lithium ion batteries due to their advantages in specific energy density that would replace portable electronic devices.7 However, issues that restrain widespread adoption include costly components such as the cat- alyst, performance degradation with the introduction of impurities, and low temperature waste 1Rashid, M. H., Alternative Energy in Power Electronics, 1st ed.; Elsevier Science: 225 Wyman Street, Waltham, MA 02451, USA, 2014, pp 81–89. 2Ibid. 3Ibid. 4Behling, N. H., Fuel Cells: Current Technology Challenges and Future Research Needs, 1st ed.; Elsevier: Radar- weg 29, PO Box 211, 1000 AE Amsterdam, The Netherlands, 2012, pp 36–. 5Ibid. 6Ibid. 7Kamarudin, S. et al. Overview on the application of direct methanol fuel cell (DMFC) for portable electronic devices. INT J HYDROGEN ENERG 2009, 34, 6902–6916. 1
  • 3. heat.8 Advantages due to low operating temperatures, quick start-up, and low corrosion make this applicable in portable power and transportation that make this technology of special interest.9 Dis- tinguishing between the hydrogen fuel cell and the direct methanol fuel cell is of interest to solidify understanding of the working potential energy. 2 Background In the PEM fuel cell, the chemical energy is released from the half reactions of oxygen and hy- drogen gas and transformed into electrical energy. When hydrogen gas is oxidized at the anode, it releases two protons and two electrons. The protons will then migrate across the electrolyte mem- brane to the cathode, thereby reacting with the oxygen. The electrons produced from the anode will be forced to flow into an external electric circuit. At the cathode side, the oxygen gas will react with the protons to produce water, it being the only waste product from the PEM fuel cell. In order to split the hydrogen gas and the oxygen gas, a catalyst is used. Hydrogen gas is easier to split than the oxygen gas and by splitting the oxygen gas, significant electric loss is resulted. Platinum is so far the best material used for the catalyst but research is being done to find cheaper alternatives for the fuel cell. The PEM fuel cell produces 1.229 V and the efficiency of a PEM is said to be about 40-60%.10 There are several downsides to using a PEM fuel cell, some including the high price of platinum being used in the fuel cell and the low practical efficiency of the current PEM fuel cell. Other materials are being researched, including different polymer membranes (per- fluorinated, partially fluorinated, non-fluorinated, non-fluorinated composite), gas diffusion layers, and different catalyst layers (single metal catalysts, binary catalysts, tertiary catalysts).11 In this lab, direct methanol fuel cell or DMFC will be used also. As the name states, methanol is used as the fuel. Compared to some other fuel cells, DMFC has a low efficiency; however, since 8Behling, Fuel Cells: Current Technology Challenges and Future Research Needs. 9Ibid. 10Ibid. 11Mehta, V.; Cooper, J. S. Review and analysis of PEM fuel cell design and manufacturing. Journal of Power Sources 2003, 114, 32–53. 2
  • 4. DMFC is very portable, it is used where energy and power density has a higher priority than the efficiency. The efficiency of a DMFC is around 30%.12 This means that the fuel cell be stored with energy and then when needed, it can be replaced quickly when the fuel cell is used up. Unlike the PEM fuel cell, the DMFC uses a platinum-ruthenium catalyst on the anode. This catalyst draws the proton released in the anode half reaction from the liquid methanol, thereby eradicating the need of a fuel reformer. Methanol is used in usually 1-3% solution. The concentration is weak because higher concentrations of methanol can diffuse through the membrane to the cathode. The low concentration attributes to the weak efficiency of DMFC.13 3 Theory In the PEM fuel cell, electrons are released through the anode half reaction and used up in the cathode reaction. Knowing that Q is the total amount of charge passed through the system, the number of moles of hydrogen, n, was calculated: Q = nzF = tI, (1) where z is the valence number of electrons of hydrogen, F is the Faraday constant, t is the time passed. and I is the measured current. We assume ideal gas behavior and Vth H2 was calculated: Vth H2 = nRT P , (2) where the Vth H2 is the theoretical volume needed to provide the measured current. In the lab, Vc H2 , which is the volume of hydrogen being consumed over a given time, will be measured. The ratio 12Kamarudin et al., “Overview on the application of direct methanol fuel cell (DMFC) for portable electronic devices”. 13Hacquard, A. Improving and Understanding Direct Methanol Fuel Cell (DMFC) Performance. 2005. 3
  • 5. between the theoretical and the consumed volumes of hydrogen can be calculated: ηFaraday = Vth H2 Vc H2 , (3) In the methanol fuel cell part of the lab, the cell potential and current density were measured. These two measurements were used to graph a characteristic curve. There are three regions in the characteristic curve: activation losses, ohmic losses, and mass transport losses. In the activation losses region, the voltage drops quickly because energy is needed to start the reaction. This happens on both the cathode and anode catalysts. The ohmic loss happens because of trying to resist the flow of electrons through circuit and ions through membrane. Mass transport loss is another quick fall due to losses in the reactants. The empirical formula is proposed by Kim et al:14 E = E0,R −blog j −Rj −menj , (4) where E0,R is the reversible cell potential, b is the oxygen reduction, R is the linear resistance, and m is the mass transfer limitations. The constant m was set to zero because there was no mass transfer loss because the reactants never ran out. Figure 1: Wiring setup for a fuel cell to measure voltage and current. Resistance is variable and can range up to 20 kΩ. The fuel cell was either a hydrogen fuel cell or methanol fuel cell. 4
  • 6. 4 Methods The wiring diagram in Fig. 1 was used to connect the fuel cell system. In addition, an electrolyzer was connected via tubing to produce the oxygen and hydrogen fuel to the PEM fuel cell as shown in Fig. 2. Air inside the tubing was purged three times by opening the clips on the tubing to allow the oxygen and hydrogen to pass through.First, a characteristic curve is produced. The electrolyzer was turned on to produce 20 mL hydrogen and 10 mL of oxygen. Current and voltage measurements were taken as the resistance of the resistor box was changed. The electrolyzer was turned on intermittently to ensure that volume of the gas chamber remained constant. A zero resistance was selected to maximize the power drawn by the circuit. The timer was started and as the hydrogen level dropped every 2 mL, voltage, current, and time was recorded. Methanol was flushed with water to ensure that no fuel was left in the chamber. Start-up time was measured by connecting the fan and then loading the fuel cell with the respective methanol concentration. The direct methanol fuel cell was connected to the previous circuit to make the characteristic curve. The process was repeated with the varying concentrations methanol. A hydrogen fuel cell and methanol fuel cell were connected in series. The same steps were taken to produce a characteristic curve. 5 Results and Discussion In order to calculate the current density in units of mA cm2 for the hydrogen fuel cell the cross sectional area of its membrane had to be determined. The height and width of the fuel cell were identical 14Et al, K. Modeling of Proton Exchange Membrane Fuel Cell Performance with an Empirical Equation. Journal of the Electrochemical Society 1995, 142, 2670–2674. Figure 2: Setup of PEM fuel cell. The electrolyzer in the top middle produces the oxygen and hydrogen needed to power the hydrogen fuel cell present in the bottom middle of the image. 5
  • 7. -10 0 10 20 30 40 50 60 70 Current Density (mA/cm2 ) 0.6 0.65 0.7 0.75 0.8 0.85 0.9 0.95 1 Voltage(V) Hydrogen Fuel Cell Characteristic Curve Data Fit Figure 3: This was the characteristic curve for the Hydrogen Fuel Cell by manually changing resistance values via a decade resistance box and recording the corresponding voltage and current density. and were measured using a standard centimeter ruler and recorded as 2.9 +/- 0.2 cm. This 0.2 cm error bound was sufficient to account for the possibility of a slightly low or high measurement for height/width. The cross sectional area was therefore calculated to be 8.4 +/- 0.2 cm with error propagation. Each subsequent current measurement was divided by this number to obtain the corresponding current density in the graph of the characteristic curve provided below. The error bounds for each voltage measurement in the hydrogen fuel cell characteristic curve were set at 0.02 volts. The fluctuation in the voltmeter’s returned values for varying resistances prompted this error bound. Similarly, the error bounds for the current measurements read from the ammeter were set at 0.2 mA for the same reason. The Faraday efficiency of the hydrogen fuel cell was determined using the volume of hydrogen gas depleted over a specified time t with a corresponding recorded current over that time period using Eq. (1).Using Eq. (1) and Eq. (3) the efficiency was calculated to be 14% which was drastically lower than the typical efficiency of a hydrogen fuel cell of around 40-60%. The reason for this low efficiency percentage was the direct result of incorrect data. The recorded current readings range of 3-12.9 mA, that when compared to the data for the characteristic curve are only a fraction of what they should be. For the characteristic curve data of the hydrogen cell at time zero, with zero resistance, a current measurement of 540 mA was observed. When comparing this to the data collected for the Faraday efficiency at the same conditions a current measurement of 12.9 mA was observed. This drastic difference in the current was a clear indication that the 6
  • 8. Figure 4: A table of the reversible cell potential, oxygen reduction, linear resistance, and R best fit parameters excluding mass trans- fer limitations. These measurements were taken using MATLAB’s cftool for a variety of different fuel cell types and set-ups listed within the table. data collected was incorrect for a regularly functioning hydrogen fuel cell. Unfortunately, this was the first experiment conducted in the lab and the magnitude of the incorrect current measurements went unnoticed. It can be noted that the cause of the low current and voltage measurements for this section of the lab can be attributed to the collection of water inside the fuel cell membrane. In order to fit the hydrogen characteristic curve to the cell potential equation provided below MATLAB’s cftool was used Eq. (4). The exponential term in the cell potential equation corre- sponds to mass transfer limitation of the reactants of the fuel cell. In this experiment there were always an excess of reactants, hence, the m and n coefficients of the mass transfer limitations were set to zero when modeling the equation. This simplification was also justified by examining the characteristic curve and making the observation that there was no dramatic loss in voltage at high current density where mass transfer limitations are normally observed. After using the cftool with the simplified equation model the results obtain are displayed in Figure 9. When comparing the fit parameters of the hydrogen fuel cell in lab to those within similar research articles the results were analogous. In the research paper15 the parameters for reversible cell potential, oxygen reduction, and linear resistance for a PEM fuel cell were determined to be 981 mV, 66.9 mV dec, and 0.355 Ω cm2 respectively. The linear resistance term determined by the best fit model was almost identical to that of the one determined by Kim with a difference of only 1.1%. The reversible cell potentials are also very similar with a percentage difference of approximately 10%. The largest deviation of the compared data sets was between the oxygen reduction values yielding a percentage difference 15Et al, “Modeling of Proton Exchange Membrane Fuel Cell Performance with an Empirical Equation”. 7
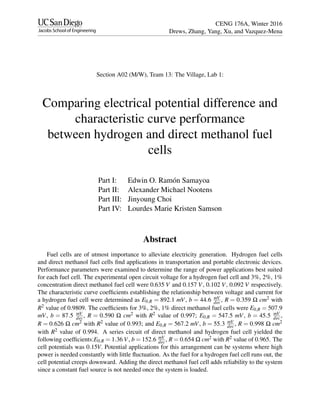
  • 9. -1 0 1 2 3 4 5 6 7 8 Current Density (mA/cm2 ) 0.1 0.2 0.3 0.4 0.5 0.6 0.7 Voltage(V) 3% Methanol Fuel Cell Characteristic Curve Data Fit Figure 5: This was a characteristic curve for the 3% methanol fuel cell which contains the highest current density and open circuit volt- age of the series. The error bounds were determined by the fluctua- tions in voltage and ampere readings from the digital multimeter. -1 0 1 2 3 4 5 Current Density (mA/cm2 ) 0.1 0.2 0.3 0.4 0.5 0.6 0.7 Voltage(V) 2% Methanol Fuel Cell Characteristic Curve Data Fit Figure 6: This was a characteristic curve for the 2% methanol fuel cell which has the median current density and open circuit voltage as should be expected. of close to 50%. The large percentage difference between these two values can be explained by the fuel cell’s lack of interaction with oxygen at the cathode. A leak in oxygen supply line would result in a lower concentration of oxygen needed to react with the protons and electrons at the cathode necessary for oxidation. The characteristic curves of the methanol fuel cells illustrate a few important concepts re- garding current density and open circuit voltage. As the graphs depict, when the concentration of methanol was increased the current density range was also increased but at lower voltages. In addi- tion, the open circuit voltage was the greatest at the highest concentration of methanol even though the magnitude of their voltage range was essentially identical. When comparing the maximum 8
  • 10. -1 0 1 2 3 4 5 Current Density (mA/cm2 ) 0 0.1 0.2 0.3 0.4 0.5 0.6 0.7 Voltage(V) 1% Methanol Fuel Cell Characteristic Curve Data Fit Figure 7: This was a characteristic curve for the 1% methanol fuel cell which has the lowest current density and open circuit voltage of the series. -5 0 5 10 15 20 Current Density (mA/cm2 ) 0 0.2 0.4 0.6 0.8 1 1.2 1.4 1.6 Voltage(V) Hydrogen and 3% Methanol Fuel Cell in Series Data Fit Figure 8: This is a characteristic curve for a 3% methanol and hydro- gen fuel cell in series The error bounds were determined by minor fluctuations in the volt and amp meter. voltage of the methanol fuel cell to that of the hydrogen, it should be noted that the hydrogen cell has the highest voltage potential and largest current density at it’s lowest voltage values. One of the benefits of the methanol cell was it’s ability to operate without a electrolyzer. This has one main distinct advantage, it does not require other outside voltage sources to pre-treat it’s reactants which allows all of its voltage potential to be used in powering other devices. Even though methanol fuel cells have this advantage hydrogen fuel cells are still typically preferred for their higher maximum voltage potential and current densities as seen in Figures 5-8. In order to obtain adequate voltage to power large devices fuel cells are typically used in series to increase the voltage potential. In this specific case, a hydrogen fuel cell and a 3% methanol fuel 9
  • 11. cell were placed in series to obtain the largest possible voltage potential. The maximum voltage potential measured was 1.58 +/- 0.02V while the maximum current density was recorded as 16.8 +/- 0.2 mA. The 3% methanol cell has a maximum voltage potential of 0.62 +/- 0.02 V and the hydrogen cell has a maximum voltage potential of 0.96 +/- 0.02 V. When two cells are placed in series the voltage potentials should add together, when added the dual maximum voltage potential was calculated to be 1.58 +/- 0.4 V. This value was identical to the value measured in lab proving the voltage potential addition of cells in series. 6 Conclusions The higher voltage for a hydrogen fuel cell justifies and promotes its use in higher power applica- tions. Theoretically methanol should have a higher power density, but the concentration gradient limited the power throughput. The determined efficiency of the hydrogen fuel cell was drastically lower than expected. Further repeated experiments should be conducted to improve the result and minimize water flooding in the fuel cell. A noteworthy result was that as the methanol concen- tration increased, about the same open circuit voltage was recorded. However, maximum current density increased as the concentration of methanol increased. Methanol crossover did not affect the measurable performance of the fuel cells. Future groups should attempt to use higher con- centrations. Combining the hydrogen fuel cell and DMFC in series complement each other by producing a high open circuit voltage and high current density. An application could be a backup power generator that can power high voltage appliances and in a quick fashion due to the high current density. Further explorations can be made into parallel circuits in differing combinations of hydrogen and methanol fuel cells. 10