SlideShare a Scribd company logo
1 of 15
Download to read offline
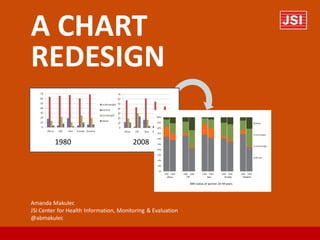
A CHART
REDESIGN
1980 2008
Amanda Makulec
JSI Center for Health Information, Monitoring & Evaluation
@abmakulec
Excel has the capability of churning
out incredibly hard to interpret charts
and graphs, and automatically
includes a lot of visual clutter.
Thinking through the story you want to tell with
your data, considering the many different chart
types that can be created in Excel (or hacked with
some creative formatting), and designing a chart
that tells that data story effectively are essential for
making sure your message is heard.
Walk through the following simple steps for how to
transform a hard-to-read graph into something that
tells the data story well.
The message we want to tell to the general
public from this data table is:
Around the world, the proportion of
women* who are overweight or obese
has increased across regions.
*Normal as defined by standard BMI measures and women aged 20-49 years.
Data table from: Black RE, Victora CG, Walker SP, Bhutta ZA, Christian P, de Onis M, Ezzati M, Grantham-McGregor S,
Katz J, Martorell R, Uauy R. Maternal and child undernutrition and overweight in low-income and middle-income
countries” The Lancet 2013; (06 June 2013) DOI: 10.1016/S0140-6736(13)60937-X.
underweight normal overweight obese
1980 2008 1980 2008 1980 2008 1980 2008
Africa 18 12 64 58 14 19 4 11
LAC 4 2 66 43 22 31 8 24
Asia 19 17 68 62 11 17 2 4
Europe 4 4 61 55 25 28 10 13
Oceania 6 2 69 45 19 32 6 21
Change in BMI status of women 20-49
years from 1980 to 2008 by region
1980 2008
START The original Excel chart.
Original layout - doesn't facilitate comparisons by region very well
Africa LAC Asia Europe Oceania
obese
overweight
normal
underweight
0
20
40
60
80
00
Africa LAC Asia Europe Oceania
The comparison is across regions and focused
on changes in numbers that sum to 100%.
So, a stacked bar chart is a better choice.
By clustering the stacked bars by region,
you can better facilitate comparisons
within regions.
0
10
20
30
40
50
60
70
80
90
100
1980 2008 1980 2008 1980 2008 1980 2008 1980 2008
Africa LAC Asia Europe Oceania
Obese
Overweight
Underweight
Normal
Percent of women 20-49 years by body mass index (BMI) status
0
10
20
30
40
50
60
70
80
90
100
1980 2008 1980 2008 1980 2008 1980 2008 1980 2008
Africa LAC Asia Europe Oceania
Obese
Overweight
Underweight
Normal
By minimizing the spaces between the
columns, you make it easy to see the pairs
of regional data.
Percent of women 20-49 years by body mass index (BMI) status
0
10
20
30
40
50
60
70
80
90
100
1980 2008 1980 2008 1980 2008 1980 2008 1980 2008
Africa LAC Asia Europe Oceania
Obese
Overweight
Underweight
Normal
Then, reduce the clutter by taking away
the unnecessary tick marks and lines.
Percent of women 20-49 years by body mass index (BMI) status
0
10
20
30
40
50
60
70
80
90
100
1980 2008 1980 2008 1980 2008 1980 2008 1980 2008
Africa LAC Asia Europe Oceania
Obese
Overweight
Underweight
Normal
Consider how much detail your audience needs.
In this case, if the important trend is the overall change in
percent above normal, then combine the two categories.
Percent of women 20-49 years by body mass index (BMI) status
Reorder categories to be logical.
Starting with underweight at the base and overweight/obese at
the top of the stacked bar.
Percent of women 20-49 years by body mass index (BMI) status
Add color that adds meaning.
Bright colors call attention to the important categories while gray
lets ‘normal’ fade a bit.
Percent of women 20-49 years by body mass index (BMI) status
Think about the level of detail required.
Technical folks might want to know that this is based on BMI and the
specific age range defined as “women” while a broader global audience
may not need that level of detail as an axis title.
Percent of women 20-49 years by body mass index (BMI) status
The proportion of women who are overweight has
increased in low and middle income countries.
Add a title that tells
the key message
you want your
audience to
takeaway. This is
very important
since the axis title
has been removed.
Change in BMI status of women 20-49
years from 1980 to 2008 by region
1980 2008
A reminder of where we started.
The proportion of women who are overweight has
increased in low and middle income countries.
END

More Related Content

Similar to Chart Makeover: A Women's Nutrition Bar Chart

The analysis of the data has been done using excel statistical sof.docx
The analysis of the data has been done using excel statistical sof.docxThe analysis of the data has been done using excel statistical sof.docx
The analysis of the data has been done using excel statistical sof.docxmattinsonjanel
 
The Graying Job Market in the Atlanta Region & The Economic Impact This Portends
The Graying Job Market in the Atlanta Region & The Economic Impact This PortendsThe Graying Job Market in the Atlanta Region & The Economic Impact This Portends
The Graying Job Market in the Atlanta Region & The Economic Impact This PortendsARCResearch
 
Data management Final Project
Data management Final ProjectData management Final Project
Data management Final ProjectRutuja Gangane
 
Inclusive growth-in-oecd-countries-challenges-and-policies-november-2018
Inclusive growth-in-oecd-countries-challenges-and-policies-november-2018Inclusive growth-in-oecd-countries-challenges-and-policies-november-2018
Inclusive growth-in-oecd-countries-challenges-and-policies-november-2018OECD, Economics Department
 
T4N - Breakout Session 3: Making better figures: visualising data for differe...
T4N - Breakout Session 3: Making better figures: visualising data for differe...T4N - Breakout Session 3: Making better figures: visualising data for differe...
T4N - Breakout Session 3: Making better figures: visualising data for differe...TransformNutritionWe
 
Ageing and declining populations
Ageing and declining populationsAgeing and declining populations
Ageing and declining populationsMrs Coles
 
LifeExpectancyInAmerica
LifeExpectancyInAmericaLifeExpectancyInAmerica
LifeExpectancyInAmericaAkhil Raman
 
Employment Trends of the Young (Age 25-34) in Metro Atlanta
Employment Trends of the Young (Age 25-34) in Metro AtlantaEmployment Trends of the Young (Age 25-34) in Metro Atlanta
Employment Trends of the Young (Age 25-34) in Metro AtlantaARCResearch
 
UNIT II -Graphic Presentation of the research
UNIT II -Graphic Presentation of the researchUNIT II -Graphic Presentation of the research
UNIT II -Graphic Presentation of the researchssuser2b23a31
 
Consumer lifestyles in denmark
Consumer lifestyles in denmarkConsumer lifestyles in denmark
Consumer lifestyles in denmarkbenturner06
 
Aging Population_Chris Zheng
Aging Population_Chris ZhengAging Population_Chris Zheng
Aging Population_Chris ZhengChris Zheng
 
Tri-State Regional Workforce Alliance, Economic Report, 2016 Update
Tri-State Regional Workforce Alliance, Economic Report, 2016 UpdateTri-State Regional Workforce Alliance, Economic Report, 2016 Update
Tri-State Regional Workforce Alliance, Economic Report, 2016 UpdateLucas Stewart
 
Writing and formatting figure captions and tables
Writing and formatting figure captions and tablesWriting and formatting figure captions and tables
Writing and formatting figure captions and tablesClaus Wilke
 
Standerd Deviation and calculation.pdf
Standerd Deviation and calculation.pdfStanderd Deviation and calculation.pdf
Standerd Deviation and calculation.pdfNJJAISWALPC
 
presentation of data
presentation of datapresentation of data
presentation of dataShafeek S
 
Katrina Hann: Ageing
Katrina Hann: AgeingKatrina Hann: Ageing
Katrina Hann: AgeingAndy Dunne
 

Similar to Chart Makeover: A Women's Nutrition Bar Chart (20)

Population and Development
Population and DevelopmentPopulation and Development
Population and Development
 
The analysis of the data has been done using excel statistical sof.docx
The analysis of the data has been done using excel statistical sof.docxThe analysis of the data has been done using excel statistical sof.docx
The analysis of the data has been done using excel statistical sof.docx
 
The Graying Job Market in the Atlanta Region & The Economic Impact This Portends
The Graying Job Market in the Atlanta Region & The Economic Impact This PortendsThe Graying Job Market in the Atlanta Region & The Economic Impact This Portends
The Graying Job Market in the Atlanta Region & The Economic Impact This Portends
 
Presentation of data
Presentation of dataPresentation of data
Presentation of data
 
Brazil New Middle Classes: The Bright Side of The Poor
Brazil New Middle Classes: The Bright Side of The PoorBrazil New Middle Classes: The Bright Side of The Poor
Brazil New Middle Classes: The Bright Side of The Poor
 
Data management Final Project
Data management Final ProjectData management Final Project
Data management Final Project
 
Inclusive growth-in-oecd-countries-challenges-and-policies-november-2018
Inclusive growth-in-oecd-countries-challenges-and-policies-november-2018Inclusive growth-in-oecd-countries-challenges-and-policies-november-2018
Inclusive growth-in-oecd-countries-challenges-and-policies-november-2018
 
T4N - Breakout Session 3: Making better figures: visualising data for differe...
T4N - Breakout Session 3: Making better figures: visualising data for differe...T4N - Breakout Session 3: Making better figures: visualising data for differe...
T4N - Breakout Session 3: Making better figures: visualising data for differe...
 
Ageing and declining populations
Ageing and declining populationsAgeing and declining populations
Ageing and declining populations
 
LifeExpectancyInAmerica
LifeExpectancyInAmericaLifeExpectancyInAmerica
LifeExpectancyInAmerica
 
Employment Trends of the Young (Age 25-34) in Metro Atlanta
Employment Trends of the Young (Age 25-34) in Metro AtlantaEmployment Trends of the Young (Age 25-34) in Metro Atlanta
Employment Trends of the Young (Age 25-34) in Metro Atlanta
 
Graphic Presentation.ppt
Graphic Presentation.pptGraphic Presentation.ppt
Graphic Presentation.ppt
 
UNIT II -Graphic Presentation of the research
UNIT II -Graphic Presentation of the researchUNIT II -Graphic Presentation of the research
UNIT II -Graphic Presentation of the research
 
Consumer lifestyles in denmark
Consumer lifestyles in denmarkConsumer lifestyles in denmark
Consumer lifestyles in denmark
 
Aging Population_Chris Zheng
Aging Population_Chris ZhengAging Population_Chris Zheng
Aging Population_Chris Zheng
 
Tri-State Regional Workforce Alliance, Economic Report, 2016 Update
Tri-State Regional Workforce Alliance, Economic Report, 2016 UpdateTri-State Regional Workforce Alliance, Economic Report, 2016 Update
Tri-State Regional Workforce Alliance, Economic Report, 2016 Update
 
Writing and formatting figure captions and tables
Writing and formatting figure captions and tablesWriting and formatting figure captions and tables
Writing and formatting figure captions and tables
 
Standerd Deviation and calculation.pdf
Standerd Deviation and calculation.pdfStanderd Deviation and calculation.pdf
Standerd Deviation and calculation.pdf
 
presentation of data
presentation of datapresentation of data
presentation of data
 
Katrina Hann: Ageing
Katrina Hann: AgeingKatrina Hann: Ageing
Katrina Hann: Ageing
 

More from Amanda Makulec

Adapting Agile for MERL
Adapting Agile for MERLAdapting Agile for MERL
Adapting Agile for MERLAmanda Makulec
 
Why No One is Using your Dashboard
Why No One is Using your DashboardWhy No One is Using your Dashboard
Why No One is Using your DashboardAmanda Makulec
 
Developing Dashboards with User-Centered Design
Developing Dashboards with User-Centered DesignDeveloping Dashboards with User-Centered Design
Developing Dashboards with User-Centered DesignAmanda Makulec
 
The Simpsons, Design, and Data Use
The Simpsons, Design, and Data UseThe Simpsons, Design, and Data Use
The Simpsons, Design, and Data UseAmanda Makulec
 
Visualizations with Empathy
Visualizations with EmpathyVisualizations with Empathy
Visualizations with EmpathyAmanda Makulec
 
Nurturing Data Visualization
Nurturing Data VisualizationNurturing Data Visualization
Nurturing Data VisualizationAmanda Makulec
 
Visualizations with Empathy: Developing Audience Personas
Visualizations with Empathy: Developing Audience PersonasVisualizations with Empathy: Developing Audience Personas
Visualizations with Empathy: Developing Audience PersonasAmanda Makulec
 
Are Dashboards the Magic Bullet?
Are Dashboards the Magic Bullet?Are Dashboards the Magic Bullet?
Are Dashboards the Magic Bullet?Amanda Makulec
 
Designstorm How-to: Dot Plots
Designstorm How-to: Dot PlotsDesignstorm How-to: Dot Plots
Designstorm How-to: Dot PlotsAmanda Makulec
 
A Data Viz Makeover: Approaches for Improving your Visualizations
A Data Viz Makeover: Approaches for Improving your VisualizationsA Data Viz Makeover: Approaches for Improving your Visualizations
A Data Viz Makeover: Approaches for Improving your VisualizationsAmanda Makulec
 
Alternative Reporting Formats
Alternative Reporting FormatsAlternative Reporting Formats
Alternative Reporting FormatsAmanda Makulec
 
Introduction to Infographic Design
Introduction to Infographic DesignIntroduction to Infographic Design
Introduction to Infographic DesignAmanda Makulec
 
Creating Functional Art in Excel
Creating Functional Art in ExcelCreating Functional Art in Excel
Creating Functional Art in ExcelAmanda Makulec
 
Data Visualization Resource Guide (September 2014)
Data Visualization Resource Guide (September 2014)Data Visualization Resource Guide (September 2014)
Data Visualization Resource Guide (September 2014)Amanda Makulec
 
August Designstorm: Alternative Reporting Formats
August Designstorm: Alternative Reporting FormatsAugust Designstorm: Alternative Reporting Formats
August Designstorm: Alternative Reporting FormatsAmanda Makulec
 
June Design-storm : Piktochart
June Design-storm : PiktochartJune Design-storm : Piktochart
June Design-storm : PiktochartAmanda Makulec
 
Data Visualization: Impact, Intrigue, Value Add for APLIC 2014
Data Visualization: Impact, Intrigue, Value Add for APLIC 2014Data Visualization: Impact, Intrigue, Value Add for APLIC 2014
Data Visualization: Impact, Intrigue, Value Add for APLIC 2014Amanda Makulec
 

More from Amanda Makulec (20)

Adapting Agile for MERL
Adapting Agile for MERLAdapting Agile for MERL
Adapting Agile for MERL
 
Why No One is Using your Dashboard
Why No One is Using your DashboardWhy No One is Using your Dashboard
Why No One is Using your Dashboard
 
Developing Dashboards with User-Centered Design
Developing Dashboards with User-Centered DesignDeveloping Dashboards with User-Centered Design
Developing Dashboards with User-Centered Design
 
The Simpsons, Design, and Data Use
The Simpsons, Design, and Data UseThe Simpsons, Design, and Data Use
The Simpsons, Design, and Data Use
 
Visualizations with Empathy
Visualizations with EmpathyVisualizations with Empathy
Visualizations with Empathy
 
Nurturing Data Visualization
Nurturing Data VisualizationNurturing Data Visualization
Nurturing Data Visualization
 
Visualizations with Empathy: Developing Audience Personas
Visualizations with Empathy: Developing Audience PersonasVisualizations with Empathy: Developing Audience Personas
Visualizations with Empathy: Developing Audience Personas
 
Are Dashboards the Magic Bullet?
Are Dashboards the Magic Bullet?Are Dashboards the Magic Bullet?
Are Dashboards the Magic Bullet?
 
Designstorm How-to: Dot Plots
Designstorm How-to: Dot PlotsDesignstorm How-to: Dot Plots
Designstorm How-to: Dot Plots
 
Data Dinner Parties
Data Dinner PartiesData Dinner Parties
Data Dinner Parties
 
The Human Element
The Human ElementThe Human Element
The Human Element
 
A Data Viz Makeover: Approaches for Improving your Visualizations
A Data Viz Makeover: Approaches for Improving your VisualizationsA Data Viz Makeover: Approaches for Improving your Visualizations
A Data Viz Makeover: Approaches for Improving your Visualizations
 
Alternative Reporting Formats
Alternative Reporting FormatsAlternative Reporting Formats
Alternative Reporting Formats
 
Introduction to Infographic Design
Introduction to Infographic DesignIntroduction to Infographic Design
Introduction to Infographic Design
 
Creating Functional Art in Excel
Creating Functional Art in ExcelCreating Functional Art in Excel
Creating Functional Art in Excel
 
Data Visualization Resource Guide (September 2014)
Data Visualization Resource Guide (September 2014)Data Visualization Resource Guide (September 2014)
Data Visualization Resource Guide (September 2014)
 
August Designstorm: Alternative Reporting Formats
August Designstorm: Alternative Reporting FormatsAugust Designstorm: Alternative Reporting Formats
August Designstorm: Alternative Reporting Formats
 
Data+Design
Data+DesignData+Design
Data+Design
 
June Design-storm : Piktochart
June Design-storm : PiktochartJune Design-storm : Piktochart
June Design-storm : Piktochart
 
Data Visualization: Impact, Intrigue, Value Add for APLIC 2014
Data Visualization: Impact, Intrigue, Value Add for APLIC 2014Data Visualization: Impact, Intrigue, Value Add for APLIC 2014
Data Visualization: Impact, Intrigue, Value Add for APLIC 2014
 

Recently uploaded

Vip Mumbai Call Girls Marol Naka Call On 9920725232 With Body to body massage...
Vip Mumbai Call Girls Marol Naka Call On 9920725232 With Body to body massage...Vip Mumbai Call Girls Marol Naka Call On 9920725232 With Body to body massage...
Vip Mumbai Call Girls Marol Naka Call On 9920725232 With Body to body massage...amitlee9823
 
Call Girls Begur Just Call 👗 7737669865 👗 Top Class Call Girl Service Bangalore
Call Girls Begur Just Call 👗 7737669865 👗 Top Class Call Girl Service BangaloreCall Girls Begur Just Call 👗 7737669865 👗 Top Class Call Girl Service Bangalore
Call Girls Begur Just Call 👗 7737669865 👗 Top Class Call Girl Service Bangaloreamitlee9823
 
Halmar dropshipping via API with DroFx
Halmar  dropshipping  via API with DroFxHalmar  dropshipping  via API with DroFx
Halmar dropshipping via API with DroFxolyaivanovalion
 
FESE Capital Markets Fact Sheet 2024 Q1.pdf
FESE Capital Markets Fact Sheet 2024 Q1.pdfFESE Capital Markets Fact Sheet 2024 Q1.pdf
FESE Capital Markets Fact Sheet 2024 Q1.pdfMarinCaroMartnezBerg
 
➥🔝 7737669865 🔝▻ Bangalore Call-girls in Women Seeking Men 🔝Bangalore🔝 Esc...
➥🔝 7737669865 🔝▻ Bangalore Call-girls in Women Seeking Men  🔝Bangalore🔝   Esc...➥🔝 7737669865 🔝▻ Bangalore Call-girls in Women Seeking Men  🔝Bangalore🔝   Esc...
➥🔝 7737669865 🔝▻ Bangalore Call-girls in Women Seeking Men 🔝Bangalore🔝 Esc...amitlee9823
 
Mg Road Call Girls Service: 🍓 7737669865 🍓 High Profile Model Escorts | Banga...
Mg Road Call Girls Service: 🍓 7737669865 🍓 High Profile Model Escorts | Banga...Mg Road Call Girls Service: 🍓 7737669865 🍓 High Profile Model Escorts | Banga...
Mg Road Call Girls Service: 🍓 7737669865 🍓 High Profile Model Escorts | Banga...amitlee9823
 
Call Girls In Bellandur ☎ 7737669865 🥵 Book Your One night Stand
Call Girls In Bellandur ☎ 7737669865 🥵 Book Your One night StandCall Girls In Bellandur ☎ 7737669865 🥵 Book Your One night Stand
Call Girls In Bellandur ☎ 7737669865 🥵 Book Your One night Standamitlee9823
 
Cheap Rate Call girls Sarita Vihar Delhi 9205541914 shot 1500 night
Cheap Rate Call girls Sarita Vihar Delhi 9205541914 shot 1500 nightCheap Rate Call girls Sarita Vihar Delhi 9205541914 shot 1500 night
Cheap Rate Call girls Sarita Vihar Delhi 9205541914 shot 1500 nightDelhi Call girls
 
Call Girls Bannerghatta Road Just Call 👗 7737669865 👗 Top Class Call Girl Ser...
Call Girls Bannerghatta Road Just Call 👗 7737669865 👗 Top Class Call Girl Ser...Call Girls Bannerghatta Road Just Call 👗 7737669865 👗 Top Class Call Girl Ser...
Call Girls Bannerghatta Road Just Call 👗 7737669865 👗 Top Class Call Girl Ser...amitlee9823
 
5CL-ADBA,5cladba, Chinese supplier, safety is guaranteed
5CL-ADBA,5cladba, Chinese supplier, safety is guaranteed5CL-ADBA,5cladba, Chinese supplier, safety is guaranteed
5CL-ADBA,5cladba, Chinese supplier, safety is guaranteedamy56318795
 
Escorts Service Kumaraswamy Layout ☎ 7737669865☎ Book Your One night Stand (B...
Escorts Service Kumaraswamy Layout ☎ 7737669865☎ Book Your One night Stand (B...Escorts Service Kumaraswamy Layout ☎ 7737669865☎ Book Your One night Stand (B...
Escorts Service Kumaraswamy Layout ☎ 7737669865☎ Book Your One night Stand (B...amitlee9823
 
Digital Advertising Lecture for Advanced Digital & Social Media Strategy at U...
Digital Advertising Lecture for Advanced Digital & Social Media Strategy at U...Digital Advertising Lecture for Advanced Digital & Social Media Strategy at U...
Digital Advertising Lecture for Advanced Digital & Social Media Strategy at U...Valters Lauzums
 
Midocean dropshipping via API with DroFx
Midocean dropshipping via API with DroFxMidocean dropshipping via API with DroFx
Midocean dropshipping via API with DroFxolyaivanovalion
 
Capstone Project on IBM Data Analytics Program
Capstone Project on IBM Data Analytics ProgramCapstone Project on IBM Data Analytics Program
Capstone Project on IBM Data Analytics ProgramMoniSankarHazra
 

Recently uploaded (20)

Vip Mumbai Call Girls Marol Naka Call On 9920725232 With Body to body massage...
Vip Mumbai Call Girls Marol Naka Call On 9920725232 With Body to body massage...Vip Mumbai Call Girls Marol Naka Call On 9920725232 With Body to body massage...
Vip Mumbai Call Girls Marol Naka Call On 9920725232 With Body to body massage...
 
Call Girls Begur Just Call 👗 7737669865 👗 Top Class Call Girl Service Bangalore
Call Girls Begur Just Call 👗 7737669865 👗 Top Class Call Girl Service BangaloreCall Girls Begur Just Call 👗 7737669865 👗 Top Class Call Girl Service Bangalore
Call Girls Begur Just Call 👗 7737669865 👗 Top Class Call Girl Service Bangalore
 
Predicting Loan Approval: A Data Science Project
Predicting Loan Approval: A Data Science ProjectPredicting Loan Approval: A Data Science Project
Predicting Loan Approval: A Data Science Project
 
Halmar dropshipping via API with DroFx
Halmar  dropshipping  via API with DroFxHalmar  dropshipping  via API with DroFx
Halmar dropshipping via API with DroFx
 
Sampling (random) method and Non random.ppt
Sampling (random) method and Non random.pptSampling (random) method and Non random.ppt
Sampling (random) method and Non random.ppt
 
FESE Capital Markets Fact Sheet 2024 Q1.pdf
FESE Capital Markets Fact Sheet 2024 Q1.pdfFESE Capital Markets Fact Sheet 2024 Q1.pdf
FESE Capital Markets Fact Sheet 2024 Q1.pdf
 
➥🔝 7737669865 🔝▻ Bangalore Call-girls in Women Seeking Men 🔝Bangalore🔝 Esc...
➥🔝 7737669865 🔝▻ Bangalore Call-girls in Women Seeking Men  🔝Bangalore🔝   Esc...➥🔝 7737669865 🔝▻ Bangalore Call-girls in Women Seeking Men  🔝Bangalore🔝   Esc...
➥🔝 7737669865 🔝▻ Bangalore Call-girls in Women Seeking Men 🔝Bangalore🔝 Esc...
 
Mg Road Call Girls Service: 🍓 7737669865 🍓 High Profile Model Escorts | Banga...
Mg Road Call Girls Service: 🍓 7737669865 🍓 High Profile Model Escorts | Banga...Mg Road Call Girls Service: 🍓 7737669865 🍓 High Profile Model Escorts | Banga...
Mg Road Call Girls Service: 🍓 7737669865 🍓 High Profile Model Escorts | Banga...
 
Call Girls In Bellandur ☎ 7737669865 🥵 Book Your One night Stand
Call Girls In Bellandur ☎ 7737669865 🥵 Book Your One night StandCall Girls In Bellandur ☎ 7737669865 🥵 Book Your One night Stand
Call Girls In Bellandur ☎ 7737669865 🥵 Book Your One night Stand
 
Cheap Rate Call girls Sarita Vihar Delhi 9205541914 shot 1500 night
Cheap Rate Call girls Sarita Vihar Delhi 9205541914 shot 1500 nightCheap Rate Call girls Sarita Vihar Delhi 9205541914 shot 1500 night
Cheap Rate Call girls Sarita Vihar Delhi 9205541914 shot 1500 night
 
Call Girls Bannerghatta Road Just Call 👗 7737669865 👗 Top Class Call Girl Ser...
Call Girls Bannerghatta Road Just Call 👗 7737669865 👗 Top Class Call Girl Ser...Call Girls Bannerghatta Road Just Call 👗 7737669865 👗 Top Class Call Girl Ser...
Call Girls Bannerghatta Road Just Call 👗 7737669865 👗 Top Class Call Girl Ser...
 
5CL-ADBA,5cladba, Chinese supplier, safety is guaranteed
5CL-ADBA,5cladba, Chinese supplier, safety is guaranteed5CL-ADBA,5cladba, Chinese supplier, safety is guaranteed
5CL-ADBA,5cladba, Chinese supplier, safety is guaranteed
 
(NEHA) Call Girls Katra Call Now 8617697112 Katra Escorts 24x7
(NEHA) Call Girls Katra Call Now 8617697112 Katra Escorts 24x7(NEHA) Call Girls Katra Call Now 8617697112 Katra Escorts 24x7
(NEHA) Call Girls Katra Call Now 8617697112 Katra Escorts 24x7
 
Escorts Service Kumaraswamy Layout ☎ 7737669865☎ Book Your One night Stand (B...
Escorts Service Kumaraswamy Layout ☎ 7737669865☎ Book Your One night Stand (B...Escorts Service Kumaraswamy Layout ☎ 7737669865☎ Book Your One night Stand (B...
Escorts Service Kumaraswamy Layout ☎ 7737669865☎ Book Your One night Stand (B...
 
Abortion pills in Doha Qatar (+966572737505 ! Get Cytotec
Abortion pills in Doha Qatar (+966572737505 ! Get CytotecAbortion pills in Doha Qatar (+966572737505 ! Get Cytotec
Abortion pills in Doha Qatar (+966572737505 ! Get Cytotec
 
CHEAP Call Girls in Saket (-DELHI )🔝 9953056974🔝(=)/CALL GIRLS SERVICE
CHEAP Call Girls in Saket (-DELHI )🔝 9953056974🔝(=)/CALL GIRLS SERVICECHEAP Call Girls in Saket (-DELHI )🔝 9953056974🔝(=)/CALL GIRLS SERVICE
CHEAP Call Girls in Saket (-DELHI )🔝 9953056974🔝(=)/CALL GIRLS SERVICE
 
Call Girls In Shalimar Bagh ( Delhi) 9953330565 Escorts Service
Call Girls In Shalimar Bagh ( Delhi) 9953330565 Escorts ServiceCall Girls In Shalimar Bagh ( Delhi) 9953330565 Escorts Service
Call Girls In Shalimar Bagh ( Delhi) 9953330565 Escorts Service
 
Digital Advertising Lecture for Advanced Digital & Social Media Strategy at U...
Digital Advertising Lecture for Advanced Digital & Social Media Strategy at U...Digital Advertising Lecture for Advanced Digital & Social Media Strategy at U...
Digital Advertising Lecture for Advanced Digital & Social Media Strategy at U...
 
Midocean dropshipping via API with DroFx
Midocean dropshipping via API with DroFxMidocean dropshipping via API with DroFx
Midocean dropshipping via API with DroFx
 
Capstone Project on IBM Data Analytics Program
Capstone Project on IBM Data Analytics ProgramCapstone Project on IBM Data Analytics Program
Capstone Project on IBM Data Analytics Program
 

Chart Makeover: A Women's Nutrition Bar Chart

  • 1. A CHART REDESIGN 1980 2008 Amanda Makulec JSI Center for Health Information, Monitoring & Evaluation @abmakulec
  • 2. Excel has the capability of churning out incredibly hard to interpret charts and graphs, and automatically includes a lot of visual clutter. Thinking through the story you want to tell with your data, considering the many different chart types that can be created in Excel (or hacked with some creative formatting), and designing a chart that tells that data story effectively are essential for making sure your message is heard. Walk through the following simple steps for how to transform a hard-to-read graph into something that tells the data story well.
  • 3. The message we want to tell to the general public from this data table is: Around the world, the proportion of women* who are overweight or obese has increased across regions. *Normal as defined by standard BMI measures and women aged 20-49 years. Data table from: Black RE, Victora CG, Walker SP, Bhutta ZA, Christian P, de Onis M, Ezzati M, Grantham-McGregor S, Katz J, Martorell R, Uauy R. Maternal and child undernutrition and overweight in low-income and middle-income countries” The Lancet 2013; (06 June 2013) DOI: 10.1016/S0140-6736(13)60937-X. underweight normal overweight obese 1980 2008 1980 2008 1980 2008 1980 2008 Africa 18 12 64 58 14 19 4 11 LAC 4 2 66 43 22 31 8 24 Asia 19 17 68 62 11 17 2 4 Europe 4 4 61 55 25 28 10 13 Oceania 6 2 69 45 19 32 6 21
  • 4. Change in BMI status of women 20-49 years from 1980 to 2008 by region 1980 2008 START The original Excel chart.
  • 5. Original layout - doesn't facilitate comparisons by region very well Africa LAC Asia Europe Oceania obese overweight normal underweight 0 20 40 60 80 00 Africa LAC Asia Europe Oceania The comparison is across regions and focused on changes in numbers that sum to 100%. So, a stacked bar chart is a better choice.
  • 6. By clustering the stacked bars by region, you can better facilitate comparisons within regions. 0 10 20 30 40 50 60 70 80 90 100 1980 2008 1980 2008 1980 2008 1980 2008 1980 2008 Africa LAC Asia Europe Oceania Obese Overweight Underweight Normal Percent of women 20-49 years by body mass index (BMI) status
  • 7. 0 10 20 30 40 50 60 70 80 90 100 1980 2008 1980 2008 1980 2008 1980 2008 1980 2008 Africa LAC Asia Europe Oceania Obese Overweight Underweight Normal By minimizing the spaces between the columns, you make it easy to see the pairs of regional data. Percent of women 20-49 years by body mass index (BMI) status
  • 8. 0 10 20 30 40 50 60 70 80 90 100 1980 2008 1980 2008 1980 2008 1980 2008 1980 2008 Africa LAC Asia Europe Oceania Obese Overweight Underweight Normal Then, reduce the clutter by taking away the unnecessary tick marks and lines. Percent of women 20-49 years by body mass index (BMI) status
  • 9. 0 10 20 30 40 50 60 70 80 90 100 1980 2008 1980 2008 1980 2008 1980 2008 1980 2008 Africa LAC Asia Europe Oceania Obese Overweight Underweight Normal Consider how much detail your audience needs. In this case, if the important trend is the overall change in percent above normal, then combine the two categories. Percent of women 20-49 years by body mass index (BMI) status
  • 10. Reorder categories to be logical. Starting with underweight at the base and overweight/obese at the top of the stacked bar. Percent of women 20-49 years by body mass index (BMI) status
  • 11. Add color that adds meaning. Bright colors call attention to the important categories while gray lets ‘normal’ fade a bit. Percent of women 20-49 years by body mass index (BMI) status
  • 12. Think about the level of detail required. Technical folks might want to know that this is based on BMI and the specific age range defined as “women” while a broader global audience may not need that level of detail as an axis title. Percent of women 20-49 years by body mass index (BMI) status
  • 13. The proportion of women who are overweight has increased in low and middle income countries. Add a title that tells the key message you want your audience to takeaway. This is very important since the axis title has been removed.
  • 14. Change in BMI status of women 20-49 years from 1980 to 2008 by region 1980 2008 A reminder of where we started.
  • 15. The proportion of women who are overweight has increased in low and middle income countries. END