
Recommended
Recommended
More Related Content
What's hot
What's hot (7)
Viewers also liked
Viewers also liked (20)
Similar to Chicago CBD Office Market Remains Strong
Similar to Chicago CBD Office Market Remains Strong (20)
Recently uploaded
Recently uploaded (20)
Chicago CBD Office Market Remains Strong
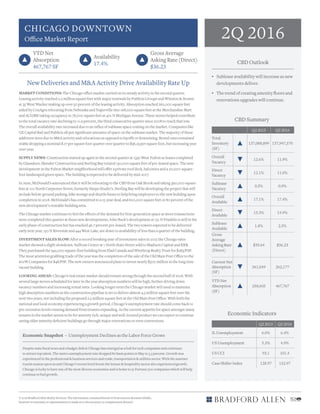
- 1. CHICAGO DOWNTOWN Office Market Report 2Q 2016 © 2016 Bradford Allen Realty Services. The information contained herein is from sources deemed reliable, however no warranty or representation is made as to the accuracy or completeness thereof. CBD Outlook • Sublease availability will increase as new developments deliver. • The trend of creating amenity floors and renovations upgrades will continue. Economic Indicators Q2 2015 Q2 2016 IL Unemployment 6.0% 6.4% US Unemployment 5.3% 4.9% US CCI 93.1 101.4 Case Shiller Index 128.97 132.97 Economic Snapshot – Unemployment Declines as the Labor Force Grows Despite state fiscal woes and a budget deficit Chicago has emerged as a hub for tech companies and continues to attract top talent. The metro unemployment rate dropped 80 basis points in May to 5.5 percent. Growth was experienced in the professional & business services and trade, transportation & utilities sector. With the summer tourist season upon us and Chicago’s recent hotel boom the leisure & hospitality sector also experienced growth. Chicago is lucky to have one of the most diverse economies and is home to 31 Fortune 500 companies which will help continue to fuel growth. CBD Summary Q2 2015 Q2 2016 Total Inventory (SF) 137,088,899 137,947,570 Overall Vacancy 12.6% 11.9% Direct Vacancy 12.1% 11.0% Sublease Vacancy 0.5% 0.9% Overall Available 17.1% 17.4% Direct Available 15.3% 14.9% Sublease Available 1.8% 2.5% Gross Average Asking Rate (Direct) $35.64 $36.23 Current Net Absorption (SF) 361,049 262,177 YTD Net Absorption (SF) 258,605 467,767 Gross Average AskingRate(Direct) $36.23 YTD Net Absorption 467,767 SF Availability 17.4% New Deliveries and M&A Activity Drive Availability Rate Up MARKET CONDITIONS: The Chicago office market carried on its steady activity in the second quarter. Leasing activity reached 2.2 million square feet with major renewals by Publicis Groupe and Winston & Strawn at 35 West Wacker making up over 50 percent of the leasing activity. Absorption reached 262,000 square feet aided by ConAgra relocating from Nebraska and Naperville into 168,000 square feet at the Merchandise Mart and ACGME taking occupancy in 78,000 square feet at 401 N Michigan Avenue. These moves helped contribute to the total vacancy rate declining to 11.9 percent, the third consecutive quarter since 2008 to reach that low. The overall availability rate increased due to an influx of sublease space coming on the market. Companies like GE Capital Rail and Publicis all put significant amounts of space on the sublease market. The majority of these additions were due to M&A activity and relocations as opposed to layoffs or downsizing. Rental rates remained stable dropping a nominal $.17 per square foot quarter over quarter to $36.23 per square foot, but increasing year over year. SUPPLY NEWS: Construction started up again in the second quarter at 1330 West Fulton as leases completed by Glassdoor, Skender Construction and Sterling Bay totaled 130,000 square feet of pre-leased space. The new development in the Fulton Market neighborhood will offer a private roof deck, balconies and a 20,000-square- foot landscaped green space. The building is expected to be delivered by mid-2017. In June, McDonald’s announced that it will be relocating to the CBD from Oak Brook and taking 390,000 square feet at 110 North Carpenter Street, formerly Harpo Studio’s. Sterling Bay will be developing the project that will include below-ground parking, bike storage and shuttle buses to help bring employees to the new building upon completion in 2018. McDonald’s has committed to a 15-year deal, and 600,000 square feet or 80 percent of the new development’s rentable building area. The Chicago market continues to feel the effects of the demand for first-generation space as more transactions were completed this quarter at these new developments. John Buck’s development at 151 N Franklin is still in the early phase of construction but has reached 46.7 percent pre-leased. The two towers expected to be delivered early next year, 150 N Riverside and 444 West Lake, are down to availability of less than a quarter of the building. INVESTMENT SALES SLOW: After a record breaking year of investment sales in 2015 the Chicago sales market showed a slight slowdown. Sullivan Center at 1 North State Street sold to Madison Capital and KKR. They purchased the 942,000 square-foot building from Elad Canada and Winthrop Realty Trust for $283/PSF. The most attention grabbing trade of the year was the completion of the sale of the Old Main Post Office to the 601W Companies for $48/PSF. The new owners announced plans to invest nearly $500 million in the long time vacant building. LOOKING AHEAD: Chicago’s real estate market should remain strong through the second half of 2016. With several large moves scheduled for later in the year absorption numbers will be high, further driving down vacancy numbers and increasing rental rates. Looking longer term the Chicago market will need to maintain high absorption numbers as the construction pipeline is set to deliver almost 4.5 million square feet over the next two years, not including the proposed 2.5 million square feet at the Old Main Post Office. With both the national and local economy experiencing a growth period, Chicago’s unemployment rate should come back to pre-recession levels creating demand from tenants expanding. As the current appetite for space amongst many tenants in the market seems to be for amenity rich, unique and well-located product we can expect to continue seeing older amenity deficient buildings go through major renovations or even conversions.
- 2. CHICAGO DOWNTOWN Office Market Report 2Q 2016 200 South Michigan Avenue, 18th Floor, Chicago, Illinois 60604 | 312.994.5700 1 3 5 4 6 2 1. River North 2. North Michigan Avenue 3. West Loop 4. Central Loop 5. East Loop 6. South Loop GLOSSARY OF TERMS Inventory Expressed in rentable square feet, this area includes the usable area and its associated share of the common areas. Available Space The total amount of space that is currently available for lease this quarter. Regardless if the space is vacant, occupied, available for sublease, or available at a future date. Vacant Space Vacant space refers to all space not currently occupied by a tenant, regardless of any lease obligation that may be on the space. Net Absorption For existing buildings, the measure of total rentable square feet occupied (indicated as a Move-In) less the total space vacated (indicated as a Move-Out) over a quarter or year to date. Gross Asking Rate (Direct) This represents the weighted-average dollar amount the lessor is asking for direct space in their building. Gross Asking Rate (High-Rise) This represents the weighted-average dollar amount the lessor is asking for floors 30 and above in their building. N/A means there is no space available in this range. *Source: CoStar Group
- 3. CHICAGO DOWNTOWN Office Market Report 2Q 2016 200 South Michigan Avenue, 18th Floor, Chicago, Illinois 60604 | 312.994.5700 Total Inventory (SF) Total Available (SF) Percent Available Total Vacant (SF) Vacancy Rate Current Absorption (SF) YTD Absorption (SF) Gross Asking Rate (Direct) Gross Asking Rate (High Rise) Central Loop Class A 22,528,116 3,790,278 16.8% 2,150,322 9.5% (153,258) 54 $37.98 $38.15 Class B 13,275,139 2,720,013 20.5% 2,236,273 16.8% (12,598) (32,362) $31.73 $33.21 Class C 1,223,786 181,553 14.8% 127,507 10.4% 49,939 50,001 $25.20 $0.00 TOTALS 37,027,041 6,691,844 18.1% 4,514,102 12.2% (115,917) 17,693 $35.03 $37.49 East Loop Class A 15,505,419 2,605,154 16.8% 2,328,394 15.0% 105,689 242,373 $34.45 $32.72 Class B 5,949,950 1,067,261 17.9% 843,362 14.2% (64,393) (92,726) $31.07 $0.00 Class C 2,716,472 294,122 10.8% 241,592 8.9% 28,438 25,348 $24.99 $0.00 TOTALS 24,171,841 3,966,537 16.4% 3,413,348 14.1% 69,734 174,995 $32.82 $31.80 North Michigan Avenue Class A 6,274,502 1,186,936 18.9% 999,676 15.9% 49,958 47,312 $38.53 $36.73 Class B 5,232,875 753,120 14.4% 618,151 11.8% 16,336 183,979 $31.31 $35.85 Class C 266,400 49,146 18.4% 35,327 13.3% (8,703) (2,751) $25.20 $0.00 TOTALS 11,773,777 1,989,202 16.9% 1,653,154 14.0% 57,591 228,540 $35.45 $34.80 River North Class A 4,182,228 295,759 7.1% 272,622 6.5% 23,715 (101,607) $43.63 $0.00 Class B 10,213,355 1,058,187 10.4% 772,514 7.6% 131,446 32,248 $33.89 $0.00 Class C 2,432,608 329,155 13.5% 168,805 6.9% 10,921 28,346 $25.94 $0.00 TOTALS 16,828,191 1,683,101 10.0% 1,213,941 7.2% 166,082 (41,013) $34.19 $0.00 South Loop Class B 1,095,594 178,745 16.3% 153,470 14.0% 3,036 8,557 $22.23 $0.00 Class C 435,576 32,731 7.5% 25,897 5.9% (2,742) (2,053) $22.32 $0.00 TOTALS 1,531,170 211,476 13.8% 179,367 11.7% 294 6,504 $22.24 $0.00 West Loop Class A 33,733,946 7,104,886 21.1% 3,624,626 10.7% 52,245 61,330 $41.88 $44.93 Class B 10,824,682 2,214,321 20.5% 1,631,840 15.1% 15,230 23,520 $33.56 $39.15 Class C 2,056,922 202,098 9.8% 151,611 7.4% 16,918 (3,802) $22.89 $0.00 TOTALS 46,615,550 9,521,305 20.4% 5,408,077 11.6% 84,393 81,048 $39.45 $44.86 CBD Class A 82,224,211 14,983,013 18.2% 9,375,640 11.4% 78,349 249,462 $39.29 $41.01 Class B 46,591,595 7,991,647 17.2% 6,255,610 13.4% 89,057 123,216 $32.12 $27.89 Class C 9,131,764 1,088,805 11.9% 750,739 8.2% 94,771 95,089 $24.85 $0.00 TOTALS 137,947,570 24,063,465 17.4% 16,381,989 11.9% 262,177 467,767 $36.23 $40.48 *Survey method includes all multi-tenant office buildings with more than 20,000 SF in each submarket excluding all condo and government owned buildings.
- 4. CHICAGO DOWNTOWN Office Market Report 2Q 2016 200 South Michigan Avenue, 18th Floor, Chicago, Illinois 60604 | 312.994.5700 Sales Transactions Submarket Building Address SF Buyer Seller Price PSF East Loop 1 North State Street 942,000 Madison Capital and KKR Elad Canada and Wintrhop Realty Trust $283.00 West Loop 433 W Van Buren Street & 258 W Van Buren Street 2,700,000 601W Bill Davies $48.00 Central Loop 440 S LaSalle Street 1,019,325 CIM Group LP TIER REIT, Inc $186.00 GROSS WEIGHTED ASKING RATE VS TOTAL AVAILABILITY 16.8% 16.9% 17.0% 17.1% 17.2% 17.3% 17.4% 17.5% $31.50 $32.00 $32.50 $33.00 $33.50 $34.00 $34.50 $35.00 $35.50 $36.00 $36.50 2Q 2013 2Q 2014 2Q 2015 2Q 2016 Availability (%) Asking Rate (S/SF) Gross Weighted Asking Rate vs Total Availability Total Availability Gross Weighted Asking Rate 6.0% 7.0% 8.0% 9.0% 10.0% 11.0% 12.0% 13.0% 14.0% 15.0% 16.0% - 50,000 100,000 150,000 200,000 250,000 300,000 350,000 400,000 450,000 500,000 2Q 2013 2Q 2014 2Q 2015 2Q 2016 Vacancy (%) YTD Net AbsorpCon (SF) YTD Net AbsorpCon vs Total Vacancy YTD Net AbsorpKon Total Vacancy Asking Rate (S/SF) Availability (%) Total Availability Gross Weighted Asking Rate Largest Available Spaces Building Address SF Class Landlord 125 S Clark Street 538,311 B Blue Star Properties 515 N State Street 507,000 A Beacon Capital Partners/ Callahan Capital Partners/ Ivanhoe Cambridge, Inc 300 S Riverside Plaza 497,007 A Mizrachi Group 311 W Monroe Street 387,705 B The Prudentialw Insurance Company of America/ GlenStar Properties 200 E Randolph Street 339,761 A Piedmont Office Realty Trust Noteworthy Leases Tenant SF Type Submarket Publicis Groupe 35 W Wacker Drive 642,545 Direct Central Loop Winston & Strawn 35 W Wacker Drive 430,000 Direct Central Loop McDonald's 1045 W Randolph Street 300,000 Direct Fulton Market Echo Global Logistics 600 W Chicago Avenue 224,678 Direct River North Constellation Brands 131 S Dearborn Street 130,000 Direct Central Loop NET ABSORPTION VS TOTAL VACANCY 16.8% 16.9% 17.0% 17.1% 17.2% 17.3% 17.4% 17.5% $31.50 $32.00 $32.50 $33.00 $33.50 $34.00 $34.50 $35.00 $35.50 $36.00 $36.50 2Q 2013 2Q 2014 2Q 2015 2Q 2016 Availability (%) Asking Rate (S/SF) Gross Weighted Asking Rate vs Total Availability Total Availability Gross Weighted Asking Rate 6.0% 7.0% 8.0% 9.0% 10.0% 11.0% 12.0% 13.0% 14.0% 15.0% 16.0% - 50,000 100,000 150,000 200,000 250,000 300,000 350,000 400,000 450,000 500,000 2Q 2013 2Q 2014 2Q 2015 2Q 2016 Vacancy (%) YTD Net AbsorpCon (SF) YTD Net AbsorpCon vs Total Vacancy YTD Net AbsorpKon Total Vacancy YTD Net Absorption (SF) Vacancy (%) Total Vacancy YTD Net Absorption