ISM 2016 A Mining Imperative: Enhanced accuracy of real-time spatial data and...
CEMEX_SeniorDesignPosterUpdate4.21.3.pptx
1. Abstract Analysis
Optimizing Aggregate Production
CEMEX Balcones Quarry
Arda Onkol, Jonathan Edmunds,
Joshua Klein, Fernando Espinosa de los Monteros
CEMEX is a global company that specializes in the production and
distribution of cement, concrete, aggregates, and related building
materials. Balcones Quarry specializes in crushed aggregate, which
accounts for 60 to 75% of the volume of ready-mix concrete and is crucial
to the properties of the mix. The New Braunfels Quarry seeks to achieve
high process efficiency by optimizing the number of haul trucks and
loaders, minimizing machine downtime, eliminating wait time, and
increasing total material output.
The Main Problem
In the current quarry setup, there are 3 different rock loading sites serviced
by two Caterpillar Loaders 992 and one 993, respectively. Typically, there are
eight Caterpillar 777-Series (100 ton) haul trucks that get rocks constantly
loaded and unloaded throughout the day. When the haul trucks arrive at the
hopper, there is a often a line of at least one or two other trucks waiting to
dump. This idle time in the traffic line causes less trips in between sites and
the hopper, longer cycle and wait times, and higher costs caused by a
potential decrease in material throughput.
Bottleneck Identification
After creating a flow process chart and studying the time study data
provided by CEMEX, we identified activities prior to the haul trucks
reaching the hopper that were adding time to the entire process, having
an effect on the main bottleneck located at the Dump Zone. The current
hopper has a capacity of 50 tons, which causes a delay when the 100 ton
capacity haul trucks dump their loads.
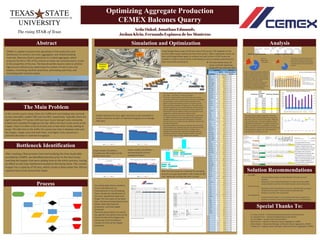
Simulation and Optimization
• For traffic:
• Interval/cadence system to help alleviate “all trucks at once”
problem.
• Outsource an ios /Android application to have the quarry traffic
routes and data mine the real vehicle location and routing times.
• For time study:
• Machines need to be labeled or named for identification purposes.
• All data must be kept in same format and electronically.
• Revision of current time study sheet.
• For equipment:
• Acquire another loader so it may replace the lower capacity one.
• Acquire or remove a haul truck so hopper can run at full efficiency.
• Acquire a hopper that may handle the trucks’ full capacity dump.
Solution Recommendations
Average Total DT Frequencies
Total Time
(mins)
Cumulative
Time Cumulative% Individual%
100 Ton 89 4693 4693 72.52% 72.52%
992 Loader 31 1533 6226 96.21% 23.69%
993 Loader 6 245 6471 100.00% 3.79%
Special Thanks To:
• Dr. Jesus Jimenez – Industrial Engineering Capstone Faculty Advisor
• Dr. Eduardo Perez – Industrial Engineering Faculty Advisor
• Dr. Enes Bilgin – Supply Chain Faculty Advisor
• Reid Pierson – Engineer at Balcones Quarry Aggregates, CEMEX
• Adam Slusser – Operations Manager at Balcones Quarry Aggregates, CEMEX
• Freddy Aird – Engineer Quarry Manager at Balcones Quarry Aggregates, CEMEX.
Time Study data sheets created to
ensure that there are no
inconsistencies in record keeping.
These include the identification of
the truck, operational down time
length, the root cause of the down
time, maintenance/operational issue
details, daily total loads for
production, and total weight
processed.
The truck queue sheet is to record
the specific truck service time at the
time of arrival at the hopper and
queue wait time according to
number of trucks at the hopper
bottleneck.
Based on the previous yearly production
data from 2015 and the first 3 months of
2016, a scatter line plot was created to
show and compare the current monthly
production; theoretical production with
the bottleneck and forecasted
production for the year was analyzed,
assuming no changes in production
processes and forecasted production of
the CEMEX goal of 45k TONS/day.
This graph shows hopper utilization. The work
hours and down times calculated from the given
data were used to find out how hopper efficiency
processes the rocks, since the bottleneck of the
operations is present here. The goal is to keep the
hopper running as much as possible to increase
daily production. A potential removal of a truck and
changing hopper capacity will make significant
improvements in production level.
These pie charts were created from the
current data in order to show which
machines in operation are causing the
most down times and how frequently
they fail.
With the time study we evaluated the dumping
process as a queuing problem with a beta arrival
rate, lognormal serving rate with 1 server.
Hopper
Temporary
Dumping
Area
Using Google Maps to get a birds eye view of the quarry. We mapped out the
current traffic routes used by the haul truck drivers. After creating the routes we
then used Google Maps again to measure out each section of the routes we
created. In order to insure all the route distances are accurately proportional to
their real-world counterparts.
Process
❖ The data below shows all
routes and their distances;
along with the reference files.
Graphs represent the nine, eight, and seven trucks simulated to
achieve maximum number of material throughput on an average
daily basis.
Graph analytic simulations
including two 993 loaders at the
furthest work sites.
Graph analytic simulations
representing the current
equipment system.
Data generated from the
simulation presents that if a new
hopper is implemented, with
twice the capacity and a new 993
loader at the furthest site, daily
throughput will increase to
approximately 50 loads per day.
The equipment cost and the
payment periods are given in the
table. An estimated yearly profit
after the implementation is
calculated after subtracting the
equipment yearly costs.
• The simulation was created using Sources, Servers, Vehicles,
Sink, Paths, Time Paths, and Transfer Nodes.
• The Paths, Transfer Nodes, and Time Paths were used to
create the traffic routes used by the haul truck. Even though
we used paths set to a specific distance we add in time
paths to model the backing up process of the haul trucks
when entering a loading or dumping area. The paths were
set with a speed limit, not to allow passing, choose shortest
path or weighted path for intersections, and to check if an
intersection was clear before crossing the road (which was
triggered as a vehicle entered or exited a node).
• The Sources represent the three loading areas in operation
by CEMEX, with the Servers marking the each loading area
available, and the Sink represents the hopper. The three
area we choose to simulate are East wall North, Pavilion Pit,
and West Pit dig sites.
• The vehicle objects were used to represent the haul trucks.
All the loading and unloading logic was put directly into the
Vehicle object rather than the servers, to allow more
freedom in choosing which dig sites to simulate with the
two different types of loaders used by CEMEX. The entity
priority request logic was also added to the vehicles.