CREDIT QUALITY IN INDIAN BANKING :QUANTITATIVE EVALUATION
•
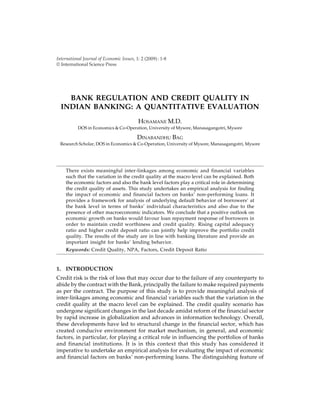
0 likes•10 views

CREDIT QUALITY IN INDIAN BANKING : A QUANTITATIVE EVALUATION

Recommended
Recommended
More Related Content
What's hot
What's hot (20)
Similar to CREDIT QUALITY IN INDIAN BANKING :QUANTITATIVE EVALUATION
Similar to CREDIT QUALITY IN INDIAN BANKING :QUANTITATIVE EVALUATION (20)
More from Dinabandhu Bag
More from Dinabandhu Bag (9)
Recently uploaded
Recently uploaded (20)
CREDIT QUALITY IN INDIAN BANKING :QUANTITATIVE EVALUATION
- 1. International Journal of Economic Issues, 1: 2 (2009): 1-8 © International Science Press BANK REGULATION AND CREDIT QUALITY IN INDIAN BANKING: A QUANTITATIVE EVALUATION HOSAMANE M.D. DOS in Economics & Co-Operation, University of Mysore, Manasagangotri, Mysore DINABANDHU BAG Research Scholar, DOS in Economics & Co-Operation, University of Mysore, Manasagangotri, Mysore There exists meaningful inter-linkages among economic and financial variables such that the variation in the credit quality at the macro level can be explained. Both the economic factors and also the bank level factors play a critical role in determining the credit quality of assets. This study undertakes an empirical analysis for finding the impact of economic and financial factors on banks’ non-performing loans. It provides a framework for analysis of underlying default behavior of borrowers’ at the bank level in terms of banks’ individual characteristics and also due to the presence of other macroeconomic indicators. We conclude that a positive outlook on economic growth on banks would favour loan repayment response of borrowers in order to maintain credit worthiness and credit quality. Rising capital adequacy ratio and higher credit deposit ratio can jointly help improve the portfolio credit quality. The results of the study are in line with banking literature and provide an important insight for banks’ lending behavior. Keywords: Credit Quality, NPA, Factors, Credit Deposit Ratio 1. INTRODUCTION Credit risk is the risk of loss that may occur due to the failure of any counterparty to abide by the contract with the Bank, principally the failure to make required payments as per the contract. The purpose of this study is to provide meaningful analysis of inter-linkages among economic and financial variables such that the variation in the credit quality at the macro level can be explained. The credit quality scenario has undergone significant changes in the last decade amidst reform of the financial sector by rapid increase in globalization and advances in information technology. Overall, these developments have led to structural change in the financial sector, which has created conducive environment for market mechanism, in general, and economic factors, in particular, for playing a critical role in influencing the portfolios of banks and financial institutions. It is in this context that this study has considered it imperative to undertake an empirical analysis for evaluating the impact of economic and financial factors on banks’ non-performing loans. The distinguishing feature of
- 2. / INTERNATIONAL JOURNAL OF ECONOMIC ISSUES the study is that it provides a framework for analysis of underlying default behavior of borrowers’ at the bank level in terms of banks’ individual characteristics and also due to the presence of other macroeconomic indicators. Are the credit policies of Indian banks adequate to maintain the credit quality of their portfolios? Do they have comprehensive risk management strategies in place? To answer such questions we highlight the risk policy of a leading Indian bank in the next section. A leading bank called ICICI bank is being referred to in this context. The credit policy in ICICI bank, vary across product groups and they include drivers such as income of the borrower, loan to value ratio, demographic and stability of the borrower. For small businesses, it involves industry catergory, geography, etc. Therefore, the management of credit risk in the Indian banks is governed by a credit policy approved by bank board. These credit policies and credit processes of the Banks are prepared with the broad risk management objective. Hence, the oversight of the credit policy remains with the senior management. Banks generate plethora of information on the cause of riskiness1 , the severity and the risk mitigation actions, both as an internal management requirement and also a regulatory requirement. For retail exposures the credit limits are determined subjectively. Bank periodically monitors the utilization for each single exposure and also for a group of exposures. Therefore, as exemplified above, Indian banks does have a broader credit policy framework in place. However, the efficacy of these processes needs to be examined in the light of their impact on rising or falling rates of Non Performing Assets (NPAs)2 . The banks’ non-performing loans, also otherwise known as credit loss, assumes critical importance since it reflects on the asset quality, credit risk and efficiency in the allocation of resources to productive sectors. The next section outlines the performance of Indian banks over the time period and draws conclusions. 2. REGULATION & CREDIT QUALITY IN INDIA As shown in Chart 1, the credit quality of the Banking assets in India have improved over a period of 7 years starting 2002-2008. For few Banks such as Dena Bank, from a very high of 26.5% to as low as 4.1% in 2007 and subsequently 3.8% in 2008. The reasons for such a fall in the NPA rate could be attributed to the prudential norms and adhering to the RBI guidelines on both identifying and managing NPAs. Unfortunately, the bank wise NPA (%) by asset class is not available and could throw a completely different picture. For example, even if the bank level overall NPA rates have come down, however, in recent times for many Banks, for retail assets such as revolving assets, auto loans, mortgages, etc, the increasing NPA rates have been of concern to the Banks. The reason for such deteriorations can be seen from Chart 1 which provides the progress in retail banking in India. A rising trend is seen since 2006 onwards across all the four categories of from mere 10 crores to 100 cores which is a big rise. The success of the real estate sector in India is not unknown and so does the exposure of banks to these sectors. Hence, it is interesting to note that indian banks are not as risk averse to lending. The average CDR (Credit to Deposit) confirms the aggressive lending, CDR levels from around 67% to 80% for the industry. However,
- 3. BANK REGULATION AND CREDIT QUALITY IN INDIAN BANKING: A QUALITATIVE EVALUATION / ! X X X X X X X Other Retail Loans Loans for Housing Consumer Durable Loans Personal Loans 100,000,000 90,000,000 80,000,000 70,000,000 60,000,000 50,000,000 40,000,000 30,000,000 20,000,000 10,000,000 2002 2003 2004 2005 2006 2007 2008 0 X Chart 1: Gross NPA (%) in Indian Banks 2002 to 2007 X X X X + + + + + AllahabadBank Andhra Bank Bank of Baroda Bank of M aharashtra Bank of M aharashtra Citi Bank CorporationBank Dena Bank HdfcBank IndianBank Oriental Bank of Commerce 30.0 Gross NP A(%) 20.0 10.0 0.0 2002 2003 2004 2005 2006 2007 Source: Statistical Tables Chart 2: Credit Growth by Loan Type 1996 to 2008; Statistical Tables compared to Banks abroad the CDR of Indian Banks are much lower. As shown in the Table 1 here, for the top 17 bank (mentioned in the sources of the table), which includes a major share of the banking business in India. The profile of these banks during the period 2002-2007 shows a mean capital adequacy ratio (CAR) of 12%,
- 4. " / INTERNATIONAL JOURNAL OF ECONOMIC ISSUES asset growth rate of 10%, capital and reserves growth rate of 34%, credit to deposit rate growth of 9%, expenses to assets growth ratio of (-1)% , expenses to advances growth rate of 19%. All of the above parameters depicts a health growth in the business of banking in India in the form of both credit and deposit expansion, combined with reduction in expenses to improve efficiency in intermediation. All of the above parameters depicts a health growth in the business of banking in India in the form of both credit and deposit expansion, combined with reduction in expenses to improve efficiency in intermediation. Therefore, the problem of falling NPAs even while increase in the recent time periods could be related to several internal and external factors confronting the borrowers. In the next section, we revisit the credit literature in both Indian and international context to find explanations on credit quality changes. 3. CREDIT RISK LITERATURE IN INDIAN AND GLOBAL BANKING In India little research has been devoted to the issue of credit risk management and credit quality models. Nachane V. M. (2005) examined the impact of capital regulations on Indian banking Sector and has concluded that Indian Banks do respond positively to a captive requirement regime by making provisions for more capital. Nachane’s study on the risk weighted assets and capital reserves for banks in India establishes a negative and significant effect also concluding that bigger banks increased their CAR less than other banks. The study concluded that regulatory effects does impact the bank level CAR. In the banking literature, the problem of NPAs has been revisited in several theoretical and empirical studies. Reddy (2004) highlighted terms of credit Table 1 Credit Profile of 17 Scheduled Banks Bank’s Variable Mean Standard Deviation RESERVES & SURPLUS 436,235 585,523 Growth in Reserves & Surplus (%) 34% 49% Total Deposits 6,488,157 7,959,941 Total Advances 4,103,898 5,293,340 Growth in Advances (%) Credit Deposit Ratio 61% 16% Growth in Credit Deposit Ratio (%) 9% 25% Total Assets 8,265,728 10,423,140 Growth in Total Assets (%) Total Expenditure with Provisions 713,401 906,139 Expense To Assets Ratio 9% 1% Growth in Expense To Assets ratio -1% 36% Expense To Advances Ratio 19% 5% Growth in Expenses To Advances Ratio -7% 33% Capital Adequacy Ratio 12 2 Source: Statistical Tables Relating to Banks in India: Data On, Allahabad Bank, Andhra Bank, Bank of Baroda, Bank of India, Bank of Maharashtra, Citi Bank, Corporation Bank, Dena Bank, Hdfc Bank, Icici Bank, Indian Bank, Oriental Bank of Commerce, Punjab National Bank, State Bank of India, Union Bank of India, United Bank of India ,Vijaya Bank
- 5. BANK REGULATION AND CREDIT QUALITY IN INDIAN BANKING: A QUALITATIVE EVALUATION / # issues on Indian banks and suggested that increasing NPAs in banks could be due to rational economic decision. Mohan (2003) emphasized on banks’ lending terms and mentioned ‘lazy banking’. Rajaraman and Vasishtha (2002) in an empirical study provided an evidence of significant vicariate relationship between an operating inefficiency indicator and the problem loans of banks. Subsequently, Ranjan and Dhal (2001) proposed a model of panel regression using the bank specific factors and economy information to identify and interpret the change in both NPA and NNPA. They attribute the changes in NPA to few of the bank groups such as public sector banks, private sector and other banks, assuming similar behavior within a bank group. The study focuses on good measures created summarizing various ratio of the bank for a limited time period (1999-2002). Hence Ranjan (2005)’s work would be the most comprehensives empirical model to explain NPA formation in Indian banking. In this context it will be worthwhile to mention few of the seminal work relating to other economies. Sergio’s (1996) study of Italy, McGoven’s (1993) study on US loan losses, Bercoff, Giovanniz and Grimardx’s (2002) study on Argentina, Fuentes and Maquieira’s (1998) study on Chille, etc, are the significant worldwide studies on NPAs. All of the above work points to the significance of the concept of bank level parameters and credit portfolio, and terms of credit, particularly, cost conditions, economy, etc. 4. MODEL OF CREDIT QUALITY Ranjan and Dhal (2003) proposed model of panel regression using the bank specific factors and economy information to identify and interpret the change in both GNPA and NNPA. Their factors include bank groups such as public sector banks, private sector and other banks, assuming similar behavior within a bank group and also measures (financial ratios) summarizing credit characteristics of the banks. We propose to simplify the Ranjan’s (2005) model for credit quality into a model of the following form: NPAi,t = Function (CARI,t , GDPt , Maturity, Expenses to Total Assetsi, SENSEXt ) Where CARI,t is the capital adequacy of the Bank ‘I’ in time‘t’. NPAi,t is defined as ith bank’s gross non-performing assets to gross advances or net non-performing assets to net advances in period t. GDPt captures the growth rate of aggregate economic activity in time ‘t’ (GDP at factor Cost). CDRI,t the credit to deposit ratio of a bank in time ‘t’. Expenses to Total Assetsi is the ratio of total expenses (inclusive of Provisions) to the Total Assets of the Bank ‘I’ in time ‘t’. SENSEXt is the annualized return on Sensex in time ‘t’. We apply this approach for 17 of the top Banks in India for the time period 2002- 2007 using linear regression approach. The bank specific fixed factors are assumed unimportant because a single regulator RBI controls the banking policy of the economy
- 6. $ / INTERNATIONAL JOURNAL OF ECONOMIC ISSUES which are complied with by all banks in India. The bank level factors as well as GDP is also considered in this approach. We consider the absolute measure, growth measure and lagged measure for each of the variables mentioned in this model. 5. MODEL RESULTS The regression methodology recognizes individual bank level ratios (characteristics) in order to establish a meaningful relationship between different economic and financial variables. Since the emphasis of the study is on analysis of borrower’s loan repayment response to terms of credit, the appropriate approach entails an empirical evaluation of the ratio of NPAs to advances rather than NPAs to assets ratio. We analyse two regression models for NPA and NNPA. The estimation of both the GNPA and NNPA model are summarized in Table 2 and Table 3 above. For both the model, the adjusted R2 is greater than 0.4, which demonstrate a good fit given the ordinary linear regression model over a 8 year recent data period for 17 banks. This is because we assume that the bank specific fixed effects are absent, which means there is no intercept component for the RBI categories of banks such as Foreign Banks, PSBs, private banks etc. The seemingly unrelated regression between various banks such as the rise or fall in NPA of a given bank may affect the rise or fall in NPA of a different bank may be in the same time period or a different time period, could not be detected here. Therefore, the bank specific factors are explained with the help of bank level parameter such as CAR, Expense Ratio, etc. Both the NPA and NNPA model selects only two bank factors and one economic factor called CAR, CDR and DP growth in Constant Prices. As shown in Table 3, and Table 4, both CAR and CDR are negatively related which is in line with theory. A 0.73 percent rise in a Bank’s CAR (could due to a regulatory exercise), can impact a drop in GNPA over 1 percent. Similarly a 10.5 percent rise in CDR can impact a drop in GNPA over 1 percent. Thus healthier banks with an oversight of the effective implementation of credit policies by their senior management are less likely to have higher NPA. Similarly, a better credit growth culture and customer orientation of the bank which is measured in higher CDR actually results in lower GNPAs. This phenomenon has also been established by Ranjan and Dhal (2003). In Table 4, we find a 0.44 percent rise in CAR and a 4 percent rise in CDR can cause a percent drop in NNPA. The difference in the parameter estimates between the two models are explained by the fact that GNPA model explains borrower behavior where as NNPA model also explains the loan loss provisioning by the lender on the top of the borrower behavior. The interesting aspect of the results is the fact that GDP Growth plays a significant role in lowering of both GNPAs and NNPAs. However, the impact of GDP growth rate to GNPA is much smaller even if it is significant. A 92 percent increase in GDP can cause a percent fall in GNPA and a 59 percent rise in GDP can cause a percent fall in NNPA. 6. CONCLUSIONS AND POLICY IMPLICATIONS We proposed a simple regression model for understating the credit quality changes in the Indian economy and the resulting impact of both bank level and economic
- 7. BANK REGULATION AND CREDIT QUALITY IN INDIAN BANKING: A QUALITATIVE EVALUATION / % factors on NPAs. The results of this study are in line with the previous findings in the literature. There exist important policy implications of our findings in so far as the bank level credit policies are concerned. Banks follow their individual lending policies by offering terms of a loan contract which does vary by borrower segment or class (ICICI bank). The most interesting aspect of a bank’s lending policy will be the terms of an offer which is given to a borrower vary from Bank to Bank even for the same borrower. The credit scenario in the Indian market is unique in the sense that borrowings from the capital market financing, closing the credit channel when borrowers’ financial position worsens, could be fatal for both sides. To sum up, there needs to be greater regulatory emphasis on prudential norms to enhance the CAR levels of each bank which would improve the credit quality. Further, since existing level of riskiness in assets for a bank can also hamper the willingness of the bank towards a policy of open credit culture, a lending mindset by transforming the bank level credit policy incorporating the credit information. This can actually improve the credit eligibility and also build a culture of credit. Finally, renewed and persistent emphasis on economic growth by the policy makers will help sustain the credit quality in the economy. Notes 1. Riskiness could be due to portfolio mix or external factors or both. 2. An NPA is defined as a loan or an advance where, interest and/ or installment of principal remains overdue for more than 90 days in respect of a term loan. Any amount due to the bank under any credit facility is ‘overdue’ if it is not paid on the due date fixed by the bank. Table 2 Gross NPA Model Results Model Parameters Estimates Variable Estimate t-Value P Value Intercept 29.43 11.03 <.0001 Capital Adequacy Ratio -0.73 -4.42 <.0001 Credit Deposit Ratio -10.58 -4.64 <.0001 GDP Growth at Constant Prices -92.08 -5.04 <.0001 Root Mean Square Error 3.49257 R-Square 0.47 Adjusted R-Square 0.45 Table 3 Gross NPA Model Results Model Parameters Estimates Variable Estimate t-Value P Value Intercept 15.33 9.36 <.0001 Capital Adequacy Ratio -0.44 -4.33 <.0001 CDR -4.00 -2.86 0.0052 GDP Growth at Constant Prices -59.46 -5.3 <.0001 Root Mean Square Error 2.14432 R-Square 0.42 Adjusted R-Square 0.40
- 8. & / INTERNATIONAL JOURNAL OF ECONOMIC ISSUES References Badu, Y.A., Kenneth N Daniels and Francis Amagoh, (2002), “An Empirical Analysis of Net Interest Cost, The Probability of Default and The Credit Risk Premium, The Case Study of Virginia”, anagerial Finance; 2002; 28, 4. Bercoff, J.J, Julian di Giovanniz and Franque Grimard, (2002), “Argentinean Banks, Credit Growth and the Tequila Crisis: A Duration Analysis”. Bhide, M.G., A Prasad, and S. Ghosh, (2002), “Banking Sector Reform: A Critical Overview”, Economic and Political Weekly, February. Bloem, A.M., and Cornelis N. Gorters, (2001), “The Macroeconomic Statistical Treatment of Nonperforming Loans”, Discussion Paper, Statistics Department of the International Monetary Fund, December 1, 2001. CHIU, Ming and Sung Wook J.O.H., (2003), “Bank Loans to Distressed Firms: Cronyism, Bank governance and Economic Crisis”, Center for Economic Institutions at Hitotsubashi University. Fuentes, R. and Carlos Maquieira, (1998), Determinants of Loan Repayment in Chile, School of Business and Economics, Universidad de Chile. Fuentes, R. and Carlos Maquieira, (2003), Institutional Arrangements, Credit Market Development and Loan Repayment in Chile, School of Business and Economics, Universidad de Chile. Gerard Caprio Jr. and Daniela Klingebiel, (1996), “Bank Insolvency: Bad Luck, Bad Policy, or Bad Banking?” Annual World Bank Conference on Development Economics 1996, Policy Research Working Paper, 1620, World Bank. Herr, K.E., and Goe Miyazaki, (1999), “A Proposal for The Japanese Non-Performing Loans Problem: Securitization as a Solution, Bankruptcy and Reorganization”, Eds, Professor E. Altman, Japan, Tokyo, April 14, 1999. Jiménez, G. and J. Saurina, (2003), “Collateral, Type of Lender and Relationship Banking as Determinants of Credit Risk, Bank of Spain”. Kent, C. and Patrick D’Arcy, (2000), “Cyclical Prudence-credit Cycles in Australia”, BIS Papers No 1 Klonner, S. and Ashok S. Rai, (2004), ‘Does Credit Rationing Reduce Defaults? Evidence from Rotating Savings and Credit Associations’, Cornell University, U.S.A. Laeven L, and Giovanni Majnoni, (2003), “Does Judicial Efficiency Lower the Cost of Credit?”, World Bank Policy Research Working Paper 3159, October 2003. Lis, S.F. de, J.M. Pages, and J. Saurina, (2000), “Credit Growth, Problem Loans And Credit Risk Provisioning” In Spain, Banco de España—Servicio de Estudios, Documento de Trabajo no 0018. McGoven, John, (1998), “Why Bad Loans Happen to Good Banks”, The Journal of Commercial Lending. Philadelphia: Feb 1993. Vol. 75, Issue. 6. Nachane, D.M. and Saibal Ghosh, (2001), “Risk-based Standards, Portfolio Risk and Bank Capital: An Econometric Study’, Economic and Political Weekly, March. Paulo A. De Britto, (2003), “Firm Financing: Debt Relief, Equity, and the Judicial System and Bankruptcy Code”, Universidade de Brasillia -Departamento de Economia. Pain, Darren, (2003), “The Provisioning Experience of the Major UK Banks: A Small Panel Investigation, Working Paper no. 177”, Bank of England. Rajaraman, Indira, and G. Vasistha, (2002), “Non-performing Loans of Public Sector Banks-Some Panel Results”, Economic and Political weekly, February, 2002. Ranjan Rajiv & Dhal Sarat, (2003), Occassional Papers Volume 24 and No. 3, Reserve Bank of India. Sergio, M, (1996), “Non-performing Bank Loans: Cyclical Patterns and Sectoral Risk”, Review of Economic Conditions in Italy. Rome: Jan-Jun 1996., Issue. 1.