1. Time and the Sun Name: ______________________
Earth Science B Date: _______________________
The altitude of any object in the sky is its vertical angle above the horizon. We consider the horizon to be 0°, and the zenith, the
point in the sky straight overhead, to be 90°. An outstretched fist is about 10° in apparent diameter, so nine fists should measure the
angle between horizon and zenith.
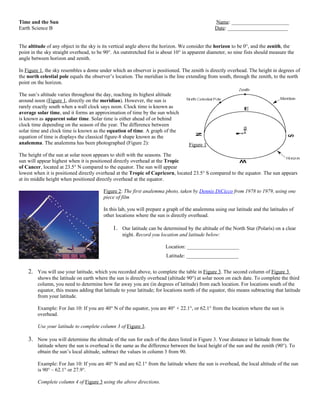
In Figure 1, the sky resembles a dome under which an observer is positioned. The zenith is directly overhead. The height in degrees of
the north celestial pole equals the observer’s location. The meridian is the line extending from south, through the zenith, to the north
point on the horizon.
The sun’s altitude varies throughout the day, reaching its highest altitude
around noon (Figure 1, directly on the meridian). However, the sun is
rarely exactly south when a wall clock says noon. Clock time is known as
average solar time, and it forms an approximation of time by the sun which
is known as apparent solar time. Solar time is either ahead of or behind
clock time depending on the season of the year. The difference between
solar time and clock time is known as the equation of time. A graph of the
equation of time is displays the classical figure-8 shape known as the
analemma. The analemma has been photographed (Figure 2): Figure 1
The height of the sun at solar noon appears to shift with the seasons. The
sun will appear highest when it is positioned directly overhead at the Tropic
of Cancer, located at 23.5° N compared to the equator. The sun will appear
lowest when it is positioned directly overhead at the Tropic of Capricorn, located 23.5° S compared to the equator. The sun appears
at its middle height when positioned directly overhead at the equator.
Figure 2: The first analemma photo, taken by Dennis DiCicco from 1978 to 1979, using one
piece of film
In this lab, you will prepare a graph of the analemma using our latitude and the latitudes of
other locations where the sun is directly overhead.
1. Our latitude can be determined by the altitude of the North Star (Polaris) on a clear
night. Record you location and latitude below:
Location: ____________________
Latitude: ____________________
2. You will use your latitude, which you recorded above, to complete the table in Figure 3. The second column of Figure 3
shows the latitude on earth where the sun is directly overhead (altitude 90°) at solar noon on each date. To complete the third
column, you need to determine how far away you are (in degrees of latitude) from each location. For locations south of the
equator, this means adding that latitude to your latitude; for locations north of the equator, this means subtracting that latitude
from your latitude.
Example: For Jan 10: If you are 40° N of the equator, you are 40° + 22.1°, or 62.1° from the location where the sun is
overhead.
Use your latitude to complete column 3 of Figure 3.
3. Now you will determine the altitude of the sun for each of the dates listed in Figure 3. Your distance in latitude from the
latitude where the sun is overhead is the same as the difference between the local height of the sun and the zenith (90°). To
obtain the sun’s local altitude, subtract the values in column 3 from 90.
Example: For Jan 10: If you are 40° N and are 62.1° from the latitude where the sun is overhead, the local altitude of the sun
is 90° – 62.1° or 27.9°.
Complete column 4 of Figure 3 using the above directions.
2. Figure 3:
Latitude where Sun Altitude of Sun at Clock Time
Your Distance from
Date is Overhead at Solar Solar Noon at Your at Solar
Latitude in Column 2
Noon Latitude Noon (h)
10-Jan 22.1° S 64.1° 25.9° 12:07
20-Jan 20.3° S 12:11
30-Jan 17.9° S 12:13
10-Feb 14.6° S 12:14
20-Feb 11.2° S 12:14
5-Mar 6.4° S 12:12
10-Mar 4.4° S 12:11
20-Mar 0.5° S 12:08
30-Mar 3.4 N 12:05
10-Apr 7.6° N 12:02
20-Apr 11.2° N 11:59
30-Apr 14.5° N 11:57
10-May 17.4° N 11:56
20-May 19.8° N 11:56
30-May 21.6° N 11:57
10-Jun 22.9° N 11:59
20-Jun 23.4° N 12:01
30-Jun 23.2° N 12:04
10-Jul 22.3° N 12:05
20-Jul 20.8° N 12:06
30-Jul 18.7° N 12:06
10-Aug 15.8° N 12:05
20-Aug 12.7° N 12:04
30-Aug 9.3° N 12:01
10-Sep 5.3° N 11:57
20-Sep 1.4° N 11:54
30-Sep 2.5° S 11:50
10-Oct 6.3° S 11:47
20-Oct 10° S 11:45
30-Oct 13.5° S 11:44
10-Nov 16.9° S 11:44
20-Nov 19.5° S 11:46
30-Nov 21.5° S 11:49
10-Dec 22.8° S 11:53
20-Dec 23.4° S 11:57
30-Dec 23.2° S 12:02
Shaded: Label the 20th of each month on your graph (but plot all values)
3. 4. You now have complete data to graph an analemma for your latitude. Set up your graph with Clock Time at Solar Noon
along the horizontal axis, and the Sun’s Altitude at Solar Noon along the vertical axis. Notice that the vertical axis is
unlabeled. The values you use depend upon your data. To figure out the values you should use, find the highest and lowest
altitudes for the sun in your table (column 4). Make the lowest value on your graph the closest even multiple of 10 that is
below your lowest value. In a similar manner, select the next even multiple of 10 above your highest altitude value. Your
finished vertical axis will read 10, 20, 30, and so on, or 20, 30, 40, and so on, or 30, 40, 50, and so on, depending on your
original latitude. Each square represents 2°. Label your vertical axis according to the above directions.
For the horizontal axis, begin with noon in the center, and number before and after noon accordingly. Each square represents
2 minutes. Label your horizontal axis.
5. For each date, graph the clock time of solar noon (column 5) against the altitude of the sun at solar noon (column 4). Label
the points that represent the 20th of each month with the date. When you are finished, connect the points by order of date.
6. When you finish the lab, answer the questions below:
Questions:
1. Fill in the table: On your graph, find the maximum and minimum altitudes of the sun. Determine the dates that each occurred,
the latitudes where the sun was overhead, the approximate season, and the closest Tropic (Cancer or Capricorn):
Maximum Altitude Minimum Altitude
Altitude Value
Date Occurred
Latitude Overhead
Approximate Season
Tropic
2. Using your data, find the altitudes and dates when the sun is overhead closest to the equator at solar noon. Name the season
that begins close to each of these dates.
Nearest Equator Nearest Equator
Altitude Value
Date Occurred
Approximate Season
3. During which seasons is apparent solar time ahead of clock time?
4. During which seasons is apparent solar time behind clock time?
5. Explain how the analemma photo was taken.
4. Analemma on Mars: Other planets can create analemma patterns. If you lived on Mars, you could observe the sun forming a teardrop
pattern throughout a Martian year. An analemma pattern results from a planets tilt and the eccentricity of its orbit, or how non-circular
its orbit is. A planet with no tilt would display no seasonal variation in the height of the sun. A planet with a circular orbit would
produce no equation of time, or no difference between average time and solar (sundial) time.” Examine the Mars analemma diagram
to answer the following:
6. In the Mars Analemma diagram, each dot represents 10 Martian days
or “sols.” How many sols are in a Martian year?
7. Use the solar declination scale to determine the approximate tilt of
the Martian axis.
8. At what Martian latitudes would its “tropics” be located?
9. If the amount of the equation of time is related to how elliptical a
planetary orbit is, than which planet, Mars or Earth, has the most
elliptical orbit? Use each equation of time to explain your answer.
10. Mercury has 0° tilt and a highly elliptical orbit. Describe the appearance of an analemma on Mercury.
5. The Analemma for _______° N
Sun’s Altitude
at Solar Noon
(degrees)
Noon
Clock Time at Solar Noon