
Recomendados
Más contenido relacionado
La actualidad más candente
La actualidad más candente (17)
Destacado
Destacado (7)
Similar a The Socioeconomic and Cultural Significance of Food Gardening In the Vladimir Region of Russia
Similar a The Socioeconomic and Cultural Significance of Food Gardening In the Vladimir Region of Russia (20)
Más de BenBeckers
Más de BenBeckers (20)
Último
Último (9)
The Socioeconomic and Cultural Significance of Food Gardening In the Vladimir Region of Russia
- 1. THE SOCIOECONOMIC AND CULTURAL SIGNIFICANCE OF FOOD GARDENING IN THE VLADIMIR REGION OF RUSSIA ________________________________________________________ A Dissertation Presented to the Faculty of the Graduate School at the University of Missouri–Columbia ________________________________________________________ In Partial Fulfillment of the Requirements for the Degree Doctor of Philosophy ________________________________________________________ by LEONID SHARASHKIN Dr. Michael A. Gold, Dissertation Supervisor MAY 2008
- 2. The undersigned, appointed by the Dean of the Graduate School, have examined the dissertation entitled THE SOCIOECONOMIC AND CULTURAL SIGNIFICANCE OF FOOD GARDENING IN THE VLADIMIR REGION OF RUSSIA presented by Leonid Sharashkin, a candidate for the degree of Doctor of Philosophy, and hereby certify that, in their opinion, it is worthy of acceptance. ________________________________________________________ Dr. Michael A. Gold ________________________________________________________ Dr. Harold E. Garrett ________________________________________________________ Dr. William B. Kurtz ________________________________________________________ Dr. Elizabeth Barham ________________________________________________________ Dr. Mary K. Hendrickson ________________________________________________________ Dr. James S. Rikoon
- 3. To Anastasia and to millions of Russian gardening families who are perpetuating the ancient tradition of living in union with Mother Earth.
- 4. “The Earth needs our help. Tenderness and a loving attitude give it strength. The Earth may be large, but it is most sensitive. And it feels the tender caress of even a single human hand. Oh, how it feels and anticipates this touch! “There was a time in Russia when the Earth was deemed to belong to everyone and therefore nobody in particular. So people did not think of it as their own. Then changes came in Russia. They began giving out tiny private plots to people to go with their dachas. “It was no coincidence at all that these plots were extremely small, too small to culti- vate with mechanised equipment. But Russians, yearning for contact with the Earth, took to them with joyous enthusiasm. They went to people both poor and rich. Because nothing can break Man’s connection with the Earth! “After obtaining their little plots of land, people intuitively felt their worth. And mil- lions of pairs of human hands began touching the Earth with love. With their hands, you understand, not with mechanised tools, lots and lots of people touched the ground caress- ingly on these little plots. And the Earth felt this, it felt it very much. It felt the blessing touch of each individual hand upon it. And the Earth found new strength to carry on.” — Vladimir Megré, The Ringing Cedars of Russia
- 5. ACKNOWLEDGEMENTS When I started researching the outwardly simple question of how and why the majority of Russian families were growing their own food, the project did not seem to promise any big discoveries. Indeed, I already knew that over 50% of Russia’s agricultural output was coming from family garden-plots. That already sounded spectacular enough to overshadow any new findings I might come up with. However, the research did yield many results that — apart from their importance in the academic field — were also deeply transforma- tive for me on both the professional and personal level. I thank my advisors for their guid- ance and support which made this experience and dissertation possible. My sincere gratitude to Dr. Michael A. Gold, my advisor, for his unparalleled support, insightful guidance, trust, patience, and commitment to researching and promoting Earth- friendly agricultural and agroforestry practices. To Dr. Harold E. (“Gene”) Garrett for bringing me to Missouri in 2003, and for his end- less support and encouragement ever since. To Dr. Elizabeth Barham, for her support, sincere interest in my research, and for help- ing me discover the momentous intellectual heritage of the Russian agricultural economist Alexander Chaianov, who has been so thoroughly forgotten back in his home country. To Dr. Mary Hendrickson, Dr. William Kurtz and Dr. Sandy Rikoon for their help, encouragement, and guidance. My gratitude and appreciation to 1,200 families of the Vladimir region of Russia, for tak- ing their time to participate in the survey, and for their beautiful and productive gardens. To Evgenii Polkovnikov and Andrei Kuzmin, directors of the non-profit Independent Agency for Regional Research (NARI) in Vladimir, Russia, and to their staff, for their ii
- 6. highly professional help with the field part of my research, and to my 22 interviewers for their hard work, timeliness and dedication to get to even the most remote rural interview sites through the snow and cold. My special thanks also go to the Russian entrepreneur and writer Vladimir Megré who, through his unique and insightful books, has illuminated for me the cultural and spiritual significance of connectedness to the Earth in the Russian tradition. This work was funded through the University of Missouri Center for Agroforestry. Any opinions, findings, conclusions or recommendations expressed in this dissertation are those of the author. iii
- 7. TABLE OF CONTENTS ACKNOWLEDGEMENTS . . . . . . . . . . . . . . . . . . . . . . . . . . . . . . . . . . . . . . . . . . . . . . . . ii LIST OF TABLES . . . . . . . . . . . . . . . . . . . . . . . . . . . . . . . . . . . . . . . . . . . . . . . . . . . . . . . ix LIST OF FIGURES . . . . . . . . . . . . . . . . . . . . . . . . . . . . . . . . . . . . . . . . . . . . . . . . . . . . . xiii ABSTRACT . . . . . . . . . . . . . . . . . . . . . . . . . . . . . . . . . . . . . . . . . . . . . . . . . . . . . . . . . . xvi CHAPTER 1. ANCIENT ROOTS, MODERN SHOOTS: RUSSIA’S FAMILY AGRICULTURE . . . . . . . . . . . . . . . . . . . . . . . . . . . 1 INTRODUCTION . . . . . . . . . . . . . . . . . . . . . . . . . . . . . . . . . . . . . . . . . . . . . . . . . . . . . . . . . 1 Definition of key terms . . . . . . . . . . . . . . . . . . . . . . . . . . . . . . . . . . . . . . . . . . . . . . 1 Why study household agriculture? . . . . . . . . . . . . . . . . . . . . . . . . . . . . . . . . . . . . . . 6 Research objectives and methods . . . . . . . . . . . . . . . . . . . . . . . . . . . . . . . . . . . . . . 9 PRIMARY AGRICULTURE: PRESENT PLACE OF HOUSEHOLD GARDENING IN RUSSIA’S ECONOMY . 10 Two agricultures . . . . . . . . . . . . . . . . . . . . . . . . . . . . . . . . . . . . . . . . . . . . . . . . . . . 10 Key macroeconomic characteristics . . . . . . . . . . . . . . . . . . . . . . . . . . . . . . . . . . . . 12 Productivity: share of GDP and agricultural output . . . . . . . . . . . . . . . . . . . . 12 Use of land resources . . . . . . . . . . . . . . . . . . . . . . . . . . . . . . . . . . . . . . . . . . . . 15 Labor: participation in gardening . . . . . . . . . . . . . . . . . . . . . . . . . . . . . . . . . . 27 Other economic characteristics . . . . . . . . . . . . . . . . . . . . . . . . . . . . . . . . . . . . . . . . 32 Subsistence vs. market . . . . . . . . . . . . . . . . . . . . . . . . . . . . . . . . . . . . . . . . . . . 32 Produce sharing networks and food security . . . . . . . . . . . . . . . . . . . . . . . . . . 34 Other economic characteristics . . . . . . . . . . . . . . . . . . . . . . . . . . . . . . . . . . . . 37 Conclusion: household agriculture vs. commercial agriculture . . . . . . . . . . . . . . . 39 BENEFITS OF HOUSEHOLD FOOD GARDENING . . . . . . . . . . . . . . . . . . . . . . . . . . . . . . . . . . . . 41 Natural resource, agricultural, and sustainability dimension . . . . . . . . . . . . . . . . . 43 Soil conservation . . . . . . . . . . . . . . . . . . . . . . . . . . . . . . . . . . . . . . . . . . . . . . . 43 Decreasing chemical pollution . . . . . . . . . . . . . . . . . . . . . . . . . . . . . . . . . . . . . 44 iv
- 8. Wildlife and biodiversity . . . . . . . . . . . . . . . . . . . . . . . . . . . . . . . . . . . . . . . . . . 46 Natural resources conservation . . . . . . . . . . . . . . . . . . . . . . . . . . . . . . . . . . . . 46 The human dimension . . . . . . . . . . . . . . . . . . . . . . . . . . . . . . . . . . . . . . . . . . . . . . 47 Satisfying the psychological need for interaction with plants and nature . . . . 47 Health and physical well-being . . . . . . . . . . . . . . . . . . . . . . . . . . . . . . . . . . . . 50 Personal self-esteem and independence . . . . . . . . . . . . . . . . . . . . . . . . . . . . . . 51 Tradition . . . . . . . . . . . . . . . . . . . . . . . . . . . . . . . . . . . . . . . . . . . . . . . . . . . . . . 52 Hobby and recreation . . . . . . . . . . . . . . . . . . . . . . . . . . . . . . . . . . . . . . . . . . . . 53 Social interaction . . . . . . . . . . . . . . . . . . . . . . . . . . . . . . . . . . . . . . . . . . . . . . . 53 Community development . . . . . . . . . . . . . . . . . . . . . . . . . . . . . . . . . . . . . . . . . 54 Children development and education . . . . . . . . . . . . . . . . . . . . . . . . . . . . . . . . 54 Other benefits . . . . . . . . . . . . . . . . . . . . . . . . . . . . . . . . . . . . . . . . . . . . . . . . . . 55 THE CULTURAL DIMENSION . . . . . . . . . . . . . . . . . . . . . . . . . . . . . . . . . . . . . . . . . . . . . . . . 56 Culture and agriculture . . . . . . . . . . . . . . . . . . . . . . . . . . . . . . . . . . . . . . . . . . . . . . 56 Definitions: culture and values . . . . . . . . . . . . . . . . . . . . . . . . . . . . . . . . . . . . . . . . 60 Definition of culture . . . . . . . . . . . . . . . . . . . . . . . . . . . . . . . . . . . . . . . . . . . . . 61 Definition of values . . . . . . . . . . . . . . . . . . . . . . . . . . . . . . . . . . . . . . . . . . . . . . 65 Cultural values . . . . . . . . . . . . . . . . . . . . . . . . . . . . . . . . . . . . . . . . . . . . . . . . . 65 Spiritual values . . . . . . . . . . . . . . . . . . . . . . . . . . . . . . . . . . . . . . . . . . . . . . . . . 66 A THOUSAND-YEAR WAR ON SUBSISTENCE . . . . . . . . . . . . . . . . . . . . . . . . . . . . . . . . . . . . . 68 Why do history and tradition matter? . . . . . . . . . . . . . . . . . . . . . . . . . . . . . . . . . . . 68 Food, freedom and authority . . . . . . . . . . . . . . . . . . . . . . . . . . . . . . . . . . . . . . . . . . 70 Deep antiquity: before 9th century CE . . . . . . . . . . . . . . . . . . . . . . . . . . . . . . . . . . 73 The enslavement of Slavs: 10th to 19th century . . . . . . . . . . . . . . . . . . . . . . . . . . . 78 The peasant economy and the agrarian question in the 19th – early 20th centuries 91 The agrarian question: Marxists vs. Chaianov . . . . . . . . . . . . . . . . . . . . . . . . 93 Agrarian values — the cultural dimension of peasantry . . . . . . . . . . . . . . . . . 97 Soviet period: collectivization and persistence of small-scale private gardens . . 100 Chaianov’s utopia . . . . . . . . . . . . . . . . . . . . . . . . . . . . . . . . . . . . . . . . . . . . . . 102 Subsidiary plot and dacha cultivation (1920s to present) . . . . . . . . . . . . . . . 103 Post-Soviet period and to the present . . . . . . . . . . . . . . . . . . . . . . . . . . . . . . . . . . 108 CONCLUSION . . . . . . . . . . . . . . . . . . . . . . . . . . . . . . . . . . . . . . . . . . . . . . . . . . . . . . . . . 111 v
- 9. CHAPTER 2. HOUSEHOLD GARDENING IN THE VLADIMIR REGION . . . . . . 112 RESEARCH PURPOSE AND OBJECTIVES . . . . . . . . . . . . . . . . . . . . . . . . . . . . . . . . . . . . . . . . 112 Research purpose . . . . . . . . . . . . . . . . . . . . . . . . . . . . . . . . . . . . . . . . . . . . . . . . . 113 Research objectives . . . . . . . . . . . . . . . . . . . . . . . . . . . . . . . . . . . . . . . . . . . . . . . . 113 Research questions . . . . . . . . . . . . . . . . . . . . . . . . . . . . . . . . . . . . . . . . . . . . . . . . 114 Participation in food gardening . . . . . . . . . . . . . . . . . . . . . . . . . . . . . . . . . . . 114 Economic dimension . . . . . . . . . . . . . . . . . . . . . . . . . . . . . . . . . . . . . . . . . . . . 114 Agricultural dimension . . . . . . . . . . . . . . . . . . . . . . . . . . . . . . . . . . . . . . . . . . 115 Socio-cultural dimension . . . . . . . . . . . . . . . . . . . . . . . . . . . . . . . . . . . . . . . . 116 RESEARCH APPROACHES . . . . . . . . . . . . . . . . . . . . . . . . . . . . . . . . . . . . . . . . . . . . . . . . . 116 Quantitative vs. qualitative . . . . . . . . . . . . . . . . . . . . . . . . . . . . . . . . . . . . . . . . . . 116 Descriptive vs. correlational research . . . . . . . . . . . . . . . . . . . . . . . . . . . . . . . . . . 117 Value and limitations of the regional approach . . . . . . . . . . . . . . . . . . . . . . . . . . 118 Feasibility and meaningfulness . . . . . . . . . . . . . . . . . . . . . . . . . . . . . . . . . . . 118 Relevance to decision-making . . . . . . . . . . . . . . . . . . . . . . . . . . . . . . . . . . . . 119 Generalizability . . . . . . . . . . . . . . . . . . . . . . . . . . . . . . . . . . . . . . . . . . . . . . . 119 METHODOLOGY . . . . . . . . . . . . . . . . . . . . . . . . . . . . . . . . . . . . . . . . . . . . . . . . . . . . . . . 120 Research Design . . . . . . . . . . . . . . . . . . . . . . . . . . . . . . . . . . . . . . . . . . . . . . . . . . 120 Study region . . . . . . . . . . . . . . . . . . . . . . . . . . . . . . . . . . . . . . . . . . . . . . . . . . . . . 120 Population . . . . . . . . . . . . . . . . . . . . . . . . . . . . . . . . . . . . . . . . . . . . . . . . . . . . . . . 124 Unit of observation: family (household) . . . . . . . . . . . . . . . . . . . . . . . . . . . . . 124 Target population . . . . . . . . . . . . . . . . . . . . . . . . . . . . . . . . . . . . . . . . . . . . . . 125 Accessible population . . . . . . . . . . . . . . . . . . . . . . . . . . . . . . . . . . . . . . . . . . . 126 Sampling design . . . . . . . . . . . . . . . . . . . . . . . . . . . . . . . . . . . . . . . . . . . . . . . . . . 128 Sample size . . . . . . . . . . . . . . . . . . . . . . . . . . . . . . . . . . . . . . . . . . . . . . . . . . . 128 Sampling technique . . . . . . . . . . . . . . . . . . . . . . . . . . . . . . . . . . . . . . . . . . . . . 129 Addressing errors . . . . . . . . . . . . . . . . . . . . . . . . . . . . . . . . . . . . . . . . . . . . . . 135 Instrumentation . . . . . . . . . . . . . . . . . . . . . . . . . . . . . . . . . . . . . . . . . . . . . . . . . . . 136 Description of instrument . . . . . . . . . . . . . . . . . . . . . . . . . . . . . . . . . . . . . . . . 136 Measuring cultural characteristics . . . . . . . . . . . . . . . . . . . . . . . . . . . . . . . . . 137 Validity procedures . . . . . . . . . . . . . . . . . . . . . . . . . . . . . . . . . . . . . . . . . . . . . 143 Reliability procedures . . . . . . . . . . . . . . . . . . . . . . . . . . . . . . . . . . . . . . . . . . . 144 vi
- 10. Data Collection . . . . . . . . . . . . . . . . . . . . . . . . . . . . . . . . . . . . . . . . . . . . . . . . . . . 144 Survey type selection . . . . . . . . . . . . . . . . . . . . . . . . . . . . . . . . . . . . . . . . . . . . 144 Interviewers’ selection and training . . . . . . . . . . . . . . . . . . . . . . . . . . . . . . . . 145 Interviews: the field phase . . . . . . . . . . . . . . . . . . . . . . . . . . . . . . . . . . . . . . . 146 Addressing the non-response . . . . . . . . . . . . . . . . . . . . . . . . . . . . . . . . . . . . . 149 News from the field . . . . . . . . . . . . . . . . . . . . . . . . . . . . . . . . . . . . . . . . . . . . . 150 Data entry . . . . . . . . . . . . . . . . . . . . . . . . . . . . . . . . . . . . . . . . . . . . . . . . . . . . . . . 152 Data analysis . . . . . . . . . . . . . . . . . . . . . . . . . . . . . . . . . . . . . . . . . . . . . . . . . . . . . 153 GENERAL SURVEY RESULTS . . . . . . . . . . . . . . . . . . . . . . . . . . . . . . . . . . . . . . . . . . . . . . . 154 Demographics of responding households . . . . . . . . . . . . . . . . . . . . . . . . . . . . . . . 154 Participation in gardening . . . . . . . . . . . . . . . . . . . . . . . . . . . . . . . . . . . . . . . . . . . 157 ECONOMIC DIMENSION . . . . . . . . . . . . . . . . . . . . . . . . . . . . . . . . . . . . . . . . . . . . . . . . . . 160 Land . . . . . . . . . . . . . . . . . . . . . . . . . . . . . . . . . . . . . . . . . . . . . . . . . . . . . . . . . . . 160 Labor . . . . . . . . . . . . . . . . . . . . . . . . . . . . . . . . . . . . . . . . . . . . . . . . . . . . . . . . . . . 168 Capital: tools and improvements . . . . . . . . . . . . . . . . . . . . . . . . . . . . . . . . . . . . . 171 Expenses . . . . . . . . . . . . . . . . . . . . . . . . . . . . . . . . . . . . . . . . . . . . . . . . . . . . . . . . 173 Subsistence, sharing, and market . . . . . . . . . . . . . . . . . . . . . . . . . . . . . . . . . . . . . 176 Place in household’s food economy . . . . . . . . . . . . . . . . . . . . . . . . . . . . . . . . . . . 182 AGRICULTURAL DIMENSION . . . . . . . . . . . . . . . . . . . . . . . . . . . . . . . . . . . . . . . . . . . . . . . 185 Crops: diversity, annuals and perennials . . . . . . . . . . . . . . . . . . . . . . . . . . . . . . . 185 Soil fertility maintenance . . . . . . . . . . . . . . . . . . . . . . . . . . . . . . . . . . . . . . . . . . . 189 Weed and pest control . . . . . . . . . . . . . . . . . . . . . . . . . . . . . . . . . . . . . . . . . . . . . . 190 Seed sources . . . . . . . . . . . . . . . . . . . . . . . . . . . . . . . . . . . . . . . . . . . . . . . . . . . . . 192 Wildlife . . . . . . . . . . . . . . . . . . . . . . . . . . . . . . . . . . . . . . . . . . . . . . . . . . . . . . . . . 193 SOCIOCULTURAL DIMENSION . . . . . . . . . . . . . . . . . . . . . . . . . . . . . . . . . . . . . . . . . . . . . . 193 Multifunctionality . . . . . . . . . . . . . . . . . . . . . . . . . . . . . . . . . . . . . . . . . . . . . . . . . 193 vii
- 11. Agri-cultural values . . . . . . . . . . . . . . . . . . . . . . . . . . . . . . . . . . . . . . . . . . . . . . . 198 Family space and social interaction . . . . . . . . . . . . . . . . . . . . . . . . . . . . . . . . . . . 208 Information and skills . . . . . . . . . . . . . . . . . . . . . . . . . . . . . . . . . . . . . . . . . . . . . . 210 Problems . . . . . . . . . . . . . . . . . . . . . . . . . . . . . . . . . . . . . . . . . . . . . . . . . . . . . . . . 212 CONCLUSIONS . . . . . . . . . . . . . . . . . . . . . . . . . . . . . . . . . . . . . . . . . . . . . . . . . . . . . . . . 214 CHAPTER 3. THE INVISIBLE GARDENS . . . . . . . . . . . . . . . . . . . . . . . . . . . . . . . . 216 “STRETCH YOUR BRAINS” . . . . . . . . . . . . . . . . . . . . . . . . . . . . . . . . . . . . . . . . . . . . . . . . 218 “THERE IS NO FREEDOM WITHOUT LAND” . . . . . . . . . . . . . . . . . . . . . . . . . . . . . . . . . . . . . 228 “THE BEWITCHING LURE” OF HOME GARDENS . . . . . . . . . . . . . . . . . . . . . . . . . . . . . . . . . . 235 AMERICAN GARDENS: CAN THERE BE VICTORY WITHOUT WAR? . . . . . . . . . . . . . . . . . . . . . 243 LITERATURE CITED . . . . . . . . . . . . . . . . . . . . . . . . . . . . . . . . . . . . . . . . . . . . . . . . . . 249 APPENDIX. SURVEY QUESTIONNAIRE (ENGLISH TRANSLATION) . . . . . . . . 259 VITA . . . . . . . . . . . . . . . . . . . . . . . . . . . . . . . . . . . . . . . . . . . . . . . . . . . . . . . . . . . . . . . . 274 viii
- 12. LIST OF TABLES Table Page 1. Agricultural production by Russian households, 2004 . . . . . . . . . . . . . . . . . . . . . . 14 2. Land usage by different groups of users, in percent of the total usage of land by category . . . . . . . . . . . . . . . . . . . . . . . . . . . . . . . . . . . . . . . . . . . . . . . . . . . . . . . . 16 3. Land used for agricultural production by different groups of users . . . . . . . . . . . . 16 4. Distribution of land under different crop categories (annual and perennial) for agricultural enterprises, individual farmers, and households, as of July 1, 2006 . 22 5. Distribution of land under different crop categories (annual and perennial) for agricultural enterprises, individual farmers, and households, as of July 1, 2006 . 23 6. Distribution of land under different annual crops for agricultural enterprises, individual farmers, and households, as of July 1, 2006 . . . . . . . . . . . . . . . . . . . . 24 7. Distribution of land under different perennial crops for agricultural enterprises, individual farmers, and households, as of July 1, 2006 . . . . . . . . . . . . . . . . . . . . 26 8. Number of households owning agricultural land plots . . . . . . . . . . . . . . . . . . . . . . 28 9. Labor force and unemployment in Russia, 1992–2006 . . . . . . . . . . . . . . . . . . . . . 29 10. Employers’ requests for employees filed with the Social Security agency, and the number of registered unemployed, thousands . . . . . . . . . . . . . . . . . . . . . . . . . . . 30 11. Number of gardening associations existing on July 1, 2006, by year in which they were formed . . . . . . . . . . . . . . . . . . . . . . . . . . . . . . . . . . . . . . . . . . . . . . . . . 31 12. Food gardens’ agricultural output, average per household . . . . . . . . . . . . . . . . . . . 35 13. Characteristics of conventional vs. household agriculture in modern Russia . . . . 39 . ix
- 13. 14. Views of Marxists and Chaianov on the agrarian question . . . . . . . . . . . . . . . . . . . 94 15. Stage 1 of sampling: proportionate stratification . . . . . . . . . . . . . . . . . . . . . . . . . . 130 16. Stage 2 of sampling: cluster sampling using probabilities proportional to size measures . . . . . . . . . . . . . . . . . . . . . . . . . . . . . . . . . . . . . . . . . . . . . . . . . . . . . . . . 131 17. Items for measuring cultural values in the survey of food gardening in the Vladimir region . . . . . . . . . . . . . . . . . . . . . . . . . . . . . . . . . . . . . . . . . . . . . . . . . . 141 18. Respondents’ description of their income level . . . . . . . . . . . . . . . . . . . . . . . . . . . 156 19. Reasons given by non-gardeners for not having a garden . . . . . . . . . . . . . . . . . . . 157 20. Procurement of foodstuffs from garden-plots of other households in 2006 . . . . . . 159 21. Households without a garden of their own helping to tend other households’ garden-plots in 2006 . . . . . . . . . . . . . . . . . . . . . . . . . . . . . . . . . . . . . . . . . . . . . . . 159 22. Households without a garden of their own spending time (visiting, on vacation, etc.) on other household’s garden-plot in 2006 . . . . . . . . . . . . . . . . . . . . . . . . . . 159 23. Number of years households have been using their garden-plots, as of December 2006, percent of gardening households . . . . . . . . . . . . . . . . . . . . . . . . . . . . . . . . 165 24. Mode of acquisition of garden-plots, percent of gardening households . . . . . . . . . 165 25. Changes in area under cultivation over the previous 5 years, and the outlook for the following 5 years, percent of households . . . . . . . . . . . . . . . . . . . . . . . . . . . . 165 26. Visitation of garden-plots by gardening households during the warm season of 2006 . . . . . . . . . . . . . . . . . . . . . . . . . . . . . . . . . . . . . . . . . . . . . . . . . . . . . . . . . . . 169 27. Use of machinery by gardening households . . . . . . . . . . . . . . . . . . . . . . . . . . . . . . 171 28. Improvements made on the garden-plots . . . . . . . . . . . . . . . . . . . . . . . . . . . . . . . . 172 29. Part of gardening households’ budgets devoted to the improvement and maintenance of the plot in 2006 . . . . . . . . . . . . . . . . . . . . . . . . . . . . . . . . . . . . . . 174 30. Itemized expenditures on the improvement and maintenance of the plot in 2006 . 175 31. Households’ ranking of the three most important expense categories over a 3- year period . . . . . . . . . . . . . . . . . . . . . . . . . . . . . . . . . . . . . . . . . . . . . . . . . . . . . . 176 x
- 14. 32. Number of households receiving foodstuffs from other households’ garden-plots during 2006 . . . . . . . . . . . . . . . . . . . . . . . . . . . . . . . . . . . . . . . . . . . . . . . . . . . . . 177 33. Use of gardening households’ output in 2006 . . . . . . . . . . . . . . . . . . . . . . . . . . . . . 177 34. Harvest storage techniques used by gardening households . . . . . . . . . . . . . . . . . . 178 35. Commercialization of garden output by households that sell part of their products . . . . . . . . . . . . . . . . . . . . . . . . . . . . . . . . . . . . . . . . . . . . . . . . . . . . . . . . 179 36. Marketing channels used by sellers . . . . . . . . . . . . . . . . . . . . . . . . . . . . . . . . . . . . 180 37. Changes in the sales volume over the previous 5 years, for the households that sell part of their harvest . . . . . . . . . . . . . . . . . . . . . . . . . . . . . . . . . . . . . . . . . . . . 181 38. Projected changes in the sales volume over the following 5 years, for the households that sell part of their harvest . . . . . . . . . . . . . . . . . . . . . . . . . . . . . . . 181 39. Product sales contributions to sellers’ monetary income . . . . . . . . . . . . . . . . . . . . 181 40. Share of self-provisioning in food products consumption, percent of households . 183 41. Number of gardening households producing certain crops and other products during the 2006 agricultural season . . . . . . . . . . . . . . . . . . . . . . . . . . . . . . . . . . . 186 42. Changes in gardeners’ volume of production over the past 5 years . . . . . . . . . . . . 188 43. Projected changes in gardeners’ volume of production over the next 5 years . . . . 189 44. Soil fertility maintenance methods used by gardening households . . . . . . . . . . . . 190 45. Weed control methods used by gardening households . . . . . . . . . . . . . . . . . . . . . . 191 46. Pest control methods used by gardening households . . . . . . . . . . . . . . . . . . . . . . . 191 47. Sources of gardeners’ seeds . . . . . . . . . . . . . . . . . . . . . . . . . . . . . . . . . . . . . . . . . . 192 48. Uses of garden-plots by households with a plot . . . . . . . . . . . . . . . . . . . . . . . . . . . 194 49. Households’ rankings of the importance of the different functions of their garden-plots . . . . . . . . . . . . . . . . . . . . . . . . . . . . . . . . . . . . . . . . . . . . . . . . . . . . . 196 50. Endorsement of agri-cultural values scale . . . . . . . . . . . . . . . . . . . . . . . . . . . . . . . 198 51. Cultural scale score distribution for different groups of respondents . . . . . . . . . . . 200 xi
- 15. 52. Distribution of responses to cultural scale questions for all respondents, for urbanites, and villagers . . . . . . . . . . . . . . . . . . . . . . . . . . . . . . . . . . . . . . . . . . . . . 203 53. Items with the five highest and the five lowest scores . . . . . . . . . . . . . . . . . . . . . . 205 54. Items with the largest difference between the scores of urban and rural respondents . . . . . . . . . . . . . . . . . . . . . . . . . . . . . . . . . . . . . . . . . . . . . . . . . . . . . . 206 55. Gardeners’ interaction with their neighbors . . . . . . . . . . . . . . . . . . . . . . . . . . . . . . 209 56. Respondents’ perception of the share of family gardens’ output in the nation’s agriculture . . . . . . . . . . . . . . . . . . . . . . . . . . . . . . . . . . . . . . . . . . . . . . . . . . . . . . . 210 57. Respondents’ answers to the question: “Do you strive to acquire new knowledge on gardening, and from what sources?” . . . . . . . . . . . . . . . . . . . . . . . . . . . . . . . . 211 58. Respondents’ answers to the question: “Do you consider yourself an experienced gardener?” . . . . . . . . . . . . . . . . . . . . . . . . . . . . . . . . . . . . . . . . . . . . . . . . . . . . . . 212 59. Gardening households’ evaluation of the severity of problems related to gardening . . . . . . . . . . . . . . . . . . . . . . . . . . . . . . . . . . . . . . . . . . . . . . . . . . . . . . . 213 xii
- 16. LIST OF FIGURES Figure Page 1. Food gardening and other industries’ contribution to GDP in 2004, billions of rubles . . . . . . . . . . . . . . . . . . . . . . . . . . . . . . . . . . . . . . . . . . . . . . . . . . . . . . . . . . 13 2. Share of agricultural enterprises, households and independent farmers in Russia’s agricultural output (by value), 1992–2004 . . . . . . . . . . . . . . . . . . . . . . . 14 3. A typical 600 m2 dacha plot as an agroforestry system: mixed plantings of vegetables, shrubs and trees . . . . . . . . . . . . . . . . . . . . . . . . . . . . . . . . . . . . . . . . . 18 4. An intensive potato/rye alley cropping . . . . . . . . . . . . . . . . . . . . . . . . . . . . . . . . . . 19 5. A multi-functional raspberry hedge bordering vegetable beds . . . . . . . . . . . . . . . . 20 6. The evolution of a dacha garden-plot . . . . . . . . . . . . . . . . . . . . . . . . . . . . . . . . . . . 21 7. Subsistence growing’s in-kind share in the gross income of Russian households, 1998–2003 . . . . . . . . . . . . . . . . . . . . . . . . . . . . . . . . . . . . . . . . . . . . . . . . . . . . . . 35 8. “A fertilizer-saving debate.” A satyrical Soviet poster . . . . . . . . . . . . . . . . . . . . . . 45 9. Boris Pasternak digging a potato patch at his dacha in Peredelkino, near Moscow, in the summer of 1958 . . . . . . . . . . . . . . . . . . . . . . . . . . . . . . . . . . . . . 59 10. Old Russian distaffs decorated with pagan symbols of the Sun, Earth and Water — three elements central to fertility and life . . . . . . . . . . . . . . . . . . . . . . . 62 11. Contemporary woodcarvings continue to reproduce millennia-old design of the “wheel of Rod” as a symbol of the never-ending natural cycle of birth, death and rebirth . . . . . . . . . . . . . . . . . . . . . . . . . . . . . . . . . . . . . . . . . . . . . . . . . . . . . . 76 12. The facade of the St. Dmitrii Church (12th century) in the city of Vladimir, covered in pagan symbols of fertility . . . . . . . . . . . . . . . . . . . . . . . . . . . . . . . . . . 87 xiii
- 17. 13. Peasant-like households in the city of Vladimir’s downtown . . . . . . . . . . . . . . . . . 87 14. A deserted village in the 17th century, painting by academician K.V. Lebedev . . . 89 15. A peasant being whipped, while red-hot iron forceps are being prepared for subsequent torture (drawing by P.V. Kurdiumov) . . . . . . . . . . . . . . . . . . . . . . . . 90 16. A landlord’s harem made up of young peasant women (drawing by Hamplen) . . . 90 17. “October 25 [date of the Bolshevik revolution].” A Soviet propaganda poster from the early 1920s . . . . . . . . . . . . . . . . . . . . . . . . . . . . . . . . . . . . . . . . . . . . . . . 96 18. “Raise vegetables!” A Soviet propaganda poster from the early 1930s . . . . . . . . . 104 19. Vladimir oblast (red) on the map of Russia . . . . . . . . . . . . . . . . . . . . . . . . . . . . . . 122 20. Topographic map of the Vladimir oblast . . . . . . . . . . . . . . . . . . . . . . . . . . . . . . . . 123 21. Map of the administrative divisions (raions) of the Vladimir oblast . . . . . . . . . . . 123 22. The distribution of the households according to size: participants of this survey and the 2002 Census . . . . . . . . . . . . . . . . . . . . . . . . . . . . . . . . . . . . . . . . . . . . . . . 155 23. Gardening participation rates per income group . . . . . . . . . . . . . . . . . . . . . . . . . . 161 24. Distribution of landholding sizes and amounts of land put to agricultural uses . . . 162 25. Proportion of households’ land used for agriculture in 2006 . . . . . . . . . . . . . . . . . 162 26. The average size of landholdings for households in different income groups . . . . 164 27. Legal forms of garden-plots, percent of plots . . . . . . . . . . . . . . . . . . . . . . . . . . . . . 166 28. Form of plot ownership, percent of households . . . . . . . . . . . . . . . . . . . . . . . . . . . 167 29. Distance to the garden-plot, percent of households . . . . . . . . . . . . . . . . . . . . . . . . 168 30. Shares of family budget devoted to food purchases by gardening and non- gardening households . . . . . . . . . . . . . . . . . . . . . . . . . . . . . . . . . . . . . . . . . . . . . . 182 31. Share of self-provisioning in food consumption for urban and rural gardening households . . . . . . . . . . . . . . . . . . . . . . . . . . . . . . . . . . . . . . . . . . . . . . . . . . . . . . 184 32. Share of self-provisioning in food consumption for lowest- and highest-income gardening households . . . . . . . . . . . . . . . . . . . . . . . . . . . . . . . . . . . . . . . . . . . . . . 184 33. Number of uses of garden-plots for each gardening household . . . . . . . . . . . . . . . 194 xiv
- 18. 34. Distribution of scores on the agri-cultural scale . . . . . . . . . . . . . . . . . . . . . . . . . . . 199 35. “Choose a happier lot — surrender your grain!” A Soviet propaganda poster, the early 1920s . . . . . . . . . . . . . . . . . . . . . . . . . . . . . . . . . . . . . . . . . . . . . . . . . . . . . . 219 36. “Turnip.” A satirical 1979 Soviet poster depicting the problems of a centralized vegetable distribution chain, resulting in a loss of quality in the final product . . 225 37. Two Soviet propaganda posters from the 1920s, promising peasants wealth and prosperity through cooperation . . . . . . . . . . . . . . . . . . . . . . . . . . . . . . . . . . . . . . 227 38. The sprawling city of Moscow advances towards nearby villages . . . . . . . . . . . . . 232 39. Moscow residents burn a straw figure representing the winter, in a course of a yearly pagan festival Maslenitsa celebrating the coming of the spring. Year 2006 . . . . . . . . . . . . . . . . . . . . . . . . . . . . . . . . . . . . . . . . . . . . . . . . . . . . . . . . . . . 236 40. A family domain concept integrating a human habitat with a diverse agroecosystem. Drawing by Irina Labuntsova, Zapolianie eco-village . . . . . . . . 238 41. A maintenance-free apple orchard in the Vladimir region of Russia . . . . . . . . . . . 240 42. “Dig for victory now!” An American WWII victory garden poster . . . . . . . . . . . . 244 43. A community garden near downtown Minneapolis, 2005 . . . . . . . . . . . . . . . . . . . 246 xv
- 19. THE SOCIOECONOMIC AND CULTURAL SIGNIFICANCE OF FOOD GARDENING IN THE VLADIMIR REGION OF RUSSIA Leonid Sharashkin Dr. Michael A. Gold, Dissertation Supervisor ABSTRACT Russia’s family gardens currently produce over half of the country’s agricultural output and represent a major sector of the country’s economy, involving two thirds of the popula- tion. Despite this prominence, household gardening has been viewed as a recent phenom- enon, an adjunct to the country’s industrial agriculture, or a temporary response to the hard- ships of Russia’s economic transition. However, this study of the current status of family agriculture, Russia’s agrarian history, and the results of a 2006 survey of 1,500 families in the Vladimir region, show that gardens not only perform a wide range of economic, social, and cultural functions, but also represent a highly sustainable practice embedded in the region’s — and the country’s — environmental, socioeconomic, and cultural context. The survey offers detailed information on the economic, agricultural, social, and cul- tural dimensions of gardening in the Vladimir region, including respondents’ adherence to a wide range of agrarian values. Based on the results, family gardening can be seen as a highly sustainable, diversified, and culturally important practice, which needs to be given due consideration by scholars and policy-makers. xvi
- 20. CHAPTER 1 ANCIENT ROOTS, MODERN SHOOTS: RUSSIA’S FAMILY AGRICULTURE INTRODUCTION In many countries of the world — in climates both tropical and temperate and in nations both developing and industrially developed — food gardening makes important contribu- tions to local, regional, and national economies (Kumar and Nair 2004; Wiersum 2004; Wojtkowski 1993). This is especially true about contemporary Russia, where 35 million families (approx. 66% of the country’s households), both urbanites and rural residents, own small garden-plots, most of which are used for growing food for subsistence and for the market (Rosstat 2007b). In addition to collectively producing over 50% of Russia’s total agricultural output, these gardeners realize many of the benefits of micro-scale food production. However, despite its prominence, Russia’s food gardening practice is not given sufficient attention by either governmental bodies or many researchers. That being the case, this study will evaluate available evidence to determine the social, economic and cultural significance of this widespread practice, with a focus on the Vladimir region of central Russia. Definition of key terms Different terms are used to refer to food gardening in Russia. Some of these terms are in- terchangeable, while others are not. It is therefore important to carefully define them from the start. 1
- 21. Dacha. The term dacha, dating back to at least the eleventh century, has had a myriad of meanings from “a landed estate” to exurban residences of Russian cultural and political elite (Lovell 2003). From the 1940s on, with the emergence and rapid growth of food gar- dening by urban people, this term has been used ever more widely to denote a garden-plot of an urban dweller. It is in this contemporary meaning of a garden-plot (with a usual size of 600 m2, or 0.15 ac), often with a simple dwelling on it, that the term dacha is used in this dissertation. We will refer to working this plot of land as “dacha gardening.” Dachnik denotes a person owning (or using) a dacha. In Russian, the term dachnik is now used in- terchangeably with “gardener” (sadovod). Dacha settlements are often legally organized in dacha cooperatives, dacha associations or gardening associations responsible for creating settlement-wide infrastructure. In Russia, dacha plot cultivation has become such a wide- spread practice (with over 50% of all urban families in Russia using a dacha) that it is often referred to as a dacha movement. Note that the term dacha refers only to urbanites’ garden- plots, and never refers to the garden-plots of rural residents. Note also that in Russia the majority of the urban population lives in apartment blocks and not in single-family homes with backyards — therefore the dachas are predominantly located outside city limits and require travel to get to. Gardens and allotments. Two other forms of gardening by urbanites are garden (sad — from the root signifying to plant) and allotment (ogorod — from the root for to fence; most- ly referring to a vegetable-garden). While allotments usually have no dwelling on them, the distinction between a garden and a dacha is now blurred and in many cases is more on paper than in the physical reality. This difference in names has historic roots: in the Soviet Union in the 1940s and 1950s, dachas were supposed to be reserved for recreation without agricultural production, while gardens had an agricultural function (Lovell 2003). Today, 2
- 22. however, the terms garden and dacha are often used interchangeably, with the exception of legal and statistical documents. For this reason, unless otherwise indicated, I will use the term garden in its generic sense to refer to a cultivated plot (uchastok) of either an urbanite or a villager (as opposed to the more formal usage of “garden” to refer to only urbanites’ plots). Subsidiary plot. “Dachas” (“gardens”) and “allotments” are terms used to refer to plots of land with a garden belonging to an urbanite. The similar plot of land with a garden be- longing to a rural resident is referred to as a personal, private, or subsidiary plot (lichnoe podsobnoe khoziaistvo). Unlike dachas, subsidiary plots usually have no dwelling on them, since they are either adjacent to (priusadebnyi = “next to the house”) or in close proximity (polevoi = “in the field”) to the owner’s village house. Subsidiary plots are also larger in size, and can be up to 0.5 ha or larger depending on regional laws. Food gardening is the generic term used to refer to dacha gardening by an urbanite and/or subsidiary plot cultivation by a villager. Other terms used in the same sense are household/family agriculture or household/family gardening (to highlight that this activity is practiced by individual households/families rather than agribusinesses), as well as self- provisioning (to highlight the fact that most of the agricultural produce is used for subsis- tence rather than for sale). This generic term is needed especially because official Russian statistics often make no distinction between dacha or subsidiary plot production (reporting an aggregate of production by both urban and rural population). Some of the basic charac- teristics of food gardening are: small plot size, manual cultivation by family members (no hired labor), and emphasis on subsistence growing. Because of the subsistence-orientation of family agriculture, the modest size of garden-plots and also the fact that it is most often a part time activity rather than main professional occupation, I avoided using the term 3
- 23. farming in reference to gardening, reserving the former to refer to commercial, mid- to large-scale agriculture. Primary agriculture. In the macro-economic sense, I will sometimes refer to household gardening as primary agriculture, to designate that it is primary in the temporal sense (i.e., preceded the appearance of commercial agriculture by many centuries) and also primary in the sense of being the predominant sector of today’s agriculture in Russia. Kolkhoz (kollektivnoe khoziaistvo, “collective farm”) and sovkhoz (sovetskoe khoziaist- vo, “Soviet [or: state] farm”) were two primary forms of collective agriculture’s organiza- tion in the Soviet Union. On a collective farm (kolkhoz), workers, collectively, nominally owned their farm, sold their produce to the state and shared in the profits from the sale, while on a state-owned farm (sovkhoz), the farm was owned by the state, and farm work- ers were paid a salary, just as in a factory. In reality, however, in both cases the quantities and prices were dictated by the state and therefore both systems of management were fully under centralized control. Contemporary Russian statistics and legislation separate agricultural producers into three categories. First, the agricultural enterprises (sel’skokhoziaistvennye organizatsii) are farms in the form of a legal entity such as corporation, limited liability company, etc. This group includes what we would call corporate farms (including the former kolkhozes and sovkhozes), as well as smaller producers (including family farmers who chose to oper- ate not as a sole proprietorship, but as a company). According to the 2006 Census of Agri- culture (Rosstat 2007a), the size of agricultural enterprises ranged from under 3 ha to over 10,000 ha, with an average size of 6,833 ha. Second, the independent farmers or individual farmers (literally, “peasant-farmer enterprise” — krest’ianskoe (fermerskoe) khoziaistvo) can be described as family farms operated as sole proprietorships. These farms are usually 4
- 24. much smaller than corporate farms — 77.5% of individual farmers have no more than 50 ha of land each. At the same time, this group also includes significantly larger operations, up to 10,000 ha in size and even larger. The average size of land holdings for individual farmers is 105 ha. Finally, the third category is households (khoziaistva naselenia), which includes subsistence-oriented family producers (both subsidiary plot cultivators in rural areas and “gardeners,” or dachniks, from urban areas). The size of a subsidiary plot may range from under 0.05 ha to over 10 ha, with an average of 0.5 ha. The size of a garden is smaller, 0.07 ha on average. It should be noted that the distinction between the three groups is based on producers’ legal status, rather than on the real nature of their activity. There- fore, the boundaries between the groups are blurred: there are very small, family-run “cor- porate” farms, and at the same time very large “individual (family) farmers” with industrial organization; there are “farmers” who grow mostly for subsistence and “gardeners” who produce for the market, etc. Sotka (from the Russian word sotnia, “a hundred”) is a land area measure most com- monly used in reference to the size of garden-plots. 1 sotka = 100 square meters = 1/100 hectare. The standard size of dacha plots allocated during the Soviet period was so often equal to 6 sotkas (= 600 m2) that in Russia the term “6 sotkas” (shest’ sotok) is often used as a synonym for a “dacha” or “garden.” Ruble (also spelled rouble) is Russia’s currency unit. During 2006–2007, the exchange rate was roughly between 25 and 27 rubles to one U.S. dollar. Oblast, translatable as “region”, is a territorial body which is a primary constituent (or “subject”) of the Russian Federation. An oblast may be compared to a state in the USA or a province in Canada. An oblast (region) is divided into districts (raion). 5
- 25. In this dissertation, I use the Library of Congress style for transcribing Russian words and names (e.g., Chaianov rather than Chayanov or Chajanov), with the exception of such terms and proper names that have already been extensively used with a different spelling (e.g., Alexander rather than Aleksandr; Yeltsin rather than El’tsin). Why study household agriculture? Russia’s household agriculture — possibly the most extensive in any industrially devel- oped nation — suggests that in developed countries highly decentralized, small-scale food production is possible on a national scale. This practice therefore warrants close attention, since the degree of self-sufficiency in a number of food staples attained by Russian house- holds points to the reemergence of a distinct, highly localized food regime, on a nation- scale level. Benefits of family gardening are not limited to the production of foodstuffs per se; these practices contribute to environmental sustainability, community food security, pro- mote social interaction among gardeners, boost local economies and serve as a means of maintaining the culturally important connection to plants, local landscapes and the Earth. Food gardening in Russia is rooted in a centuries-old tradition of self-reliant living on the land. From deep antiquity to the peasant economy of tsarist Russia to the present-day agriculture, the greatest contribution to the food economy of the nation has been made not by large, modern, industrial, corporate or state-run, commodity-market-oriented crop pro- ducers (such as collective farms during the Soviet period), but by millions of small-scale, traditional, machinery-free, family-operated producers growing primarily for subsistence (Chaianov 1925). Today, these growers are referred to as subsidiary plot cultivators in rural areas and dacha gardeners in peri-urban areas. 6
- 26. The Russian self-provisioning phenomenon, especially the subsidiary plot cultivation by rural residents, has been recognized as an important part of the country’s agriculture and studied for several decades (Wadekin 1973; Hedlund 1989). As early as in 1973, Wadekin was already describing the backbone of Soviet agriculture as “fifty million small-scale producers” (1973:81) — but dacha gardening has been rarely even mentioned in agrar- ian reform debates and generally ignored by both agricultural policy-makers and by most scholars. Despite the prominence of food gardening, it has largely been viewed only as a mere addition to the nation’s industrial agriculture. Instead, great attention has been laid on the “modern” sector of agriculture, includ- ing large-scale grain production, industrial crops (such as flax) or confinement livestock operations — as if those represented the whole of agriculture. This bias is largely due to decades of modernization and industrialization philosophies being applied to agriculture and to the fact that historically the production of grains and flax provided the bulk of cash crops and export commodities — and was therefore of greater importance to the state than subsistence-oriented food gardening. Indeed, the conflict between the tradition of self-pro- visioning and the requirements of the state has a history that can be traced back for at least a thousand years. When the industrial, heavily subsidized, large-scale agriculture experienced a sharp decline in the early 1990s but no famine ensued, researchers turned more attention to food gardening. Even though several attempts to explain Russian food gardening practices as only a survival strategy during the times of economic hardship have failed (Clarke et al. 1999), up to the present day researchers have primarily focused on the economic signifi- cance of household agriculture and the political and legal frameworks that enabled this small-scale private production even under the Soviet regime. 7
- 27. Recently, it has been increasingly recognized that subsistence growing in Russia, apart from its economic and social importance, has deep historic roots that go back to the peas- ant economy (Seeth et al. 1998) and that present-day food gardening bears similarities to the peasant household production of the late 19th – early 20th centuries (Clarke et al. 1999; O’Brien, Wegren, and Patsiorkovsky 2005). At the same time, researchers have continued to focus on the economic dimension of self-provisioning, and treat it as a response to pov- erty and survival strategy (Seeth et al. 1998), as an indication of economic distress in rural areas (O’Brien et al. 1996) or as merely a useful “fix” to Russia’s social conflicts (Rutkev- ich 2001). However, recent studies also suggested that the mass food self-provisioning by Russian households cannot be explained as a response to poverty (Berman 2005; Clarke et al. 1999), that food gardening is a highly diverse, sustainable and culturally rich mode of food production it its own right (Berman 2005), and that a proper understanding of this practice requires the study of its cultural characteristics (Bonanno and Lyman 1999). This recent recognition of the cultural dimension of food gardening is not surprising, since al- most a century ago Russia’s most prominent agricultural economist Alexander Chaianov maintained that the significance of agriculture grounded in century-old traditions of peas- ant living goes well beyond food production alone (Kremnev 1920; Sharashkin, Gold, and Barham 2005). Lovell’s (2003) ethnographic and social history research of Russian dacha contributed to the understanding of its cultural significance, but self-provisioning, espe- cially by urban households (who form the majority of micro-scale producers), continues to be under-researched. To date, no interdisciplinary studies of the economic, natural resource and socio-cultural characteristics of food gardening in Russia (or in any of Russia’s regions) have been carried out. Researchers themselves recognize the scarcity of research on the topic (Varshavskaya 1998; Yaroshenko 1998). This study will help to partially fill this gap. 8
- 28. Research objectives and methods While the primary focus of this study is to assess the current economic, natural resource, social and cultural importance of food gardening in the Vladimir region of Russia, by way of introduction we need to first look, in this chapter, at the national level (especially since much of the previously available statistics and research dealt with the national, rather than regional, level). Providing an overview of food gardening in Russia as a whole will put the results of our study of the Vladimir region into a wider context, and will offer partial answers to the following two sets of questions: 1) The economic question: Is food gardening in Russia an important part of the national and regional agriculture and economy? Is food gardening a viable and efficient means of long-term sustainable (including natural resources use and environmental sustainability) food production under the conditions of the Russian economy? 2) The cultural question: Can the food gardening phenomenon be explained as only a temporary response to poverty, economic hardships, and food insecurity? Or should it be viewed as an important part of Russian culture and a continuation of a long tradition of self-reliant, land-based lifestyle? To answer these questions, I will draw upon the available literature on food gardening, on the extensive statistical sources, including the statistics annually gathered and published by Goskomstat/Rosstat, Russia’s Federal Statistical Service, as well as the preliminary re- sults of the comprehensive Russia’s 2006 Census of Agriculture. Based on the background presented in this chapter, in the next chapter we shall focus on one of the regions of Central European Russia — the Vladimir oblast — to examine in fine detail the food gardening practice. Based on the results of our own large survey conducted 9
- 29. in the region in 2006 (with a representative sample of 1,500 households, both urban and rural), as well as the extensive regional statistics, we shall examine the whole range of eco- nomic, agricultural, social, and cultural characteristics associated with the practice. In the final Chapter 3, I shall then present a discussion of the implications of my find- ings, as well as my recommendations. PRIMARY AGRICULTURE: PRESENT PLACE OF HOUSEHOLD GARDENING IN RUSSIA’S ECONOMY Two agricultures Starting in the 1920s, Soviet agriculture branched into two sectors. One was the “offi- cial,” modern, collectivized agricultural sector — state-controlled, large-scale, relying on heavy inputs, mechanization, hired labor and centralized processing and distribution of outputs. The other was “private,” household-managed, micro-scale, independent of state support or inputs, manual-labor-based, employing no labor outside the household, geared towards self-provisioning, traditional — based on the centuries-old traditions of peasant living (Sharashkin and Barham 2005b). Food gardening by urbanites was re-authorized by Soviet authorities at the beginning of WWII to fight impending food shortages, and it quickly spread throughout the country (Lovell 2003). As for subsistence-growing among the rural population, it never ceased even during the height of collectivization, and even Stalin himself admitted that the state should not (as yet) collectivize personal garden-plots (Stalin 1949). 10
- 30. The collectivized sector of agriculture (99.6% of agricultural producers were collec- tivized by 1955) witnessed a significant growth over the post-war decades (Matskevich 1967). By the mid-1950s, grain production exceeded the 1913 level (pre-WWI and pre- revolution) and between 1950 and 1970 increased by more than 2.3 times to 186.8 mil- lion tonnes (Goskomstat 1971). Production of meat by kolkhozes and sovkhozes rose six fold between 1940 and 1970 to 8 million tonnes per year. These advances were largely achieved by government-mandated and government-sponsored industrialization of agricul- ture. Thus, between 1950 and 1974 the production of plough-tractors increased by 79% to 218,000 units per year, and the production of cereal harvesters increased by 91% to 88,400 units per year. Between 1950 and 1972, the supply of NPK fertilizers to Soviet agriculture increased almost ten fold, and the rate of NPK application increased from 7.3 to 55.9 kg/ha per year (Goskomstat 1975). At the same time, the “private” (household-based) sector continued to grow as well and by the mid-1950s accounted for 25% of the country’s agricultural output (Wadekin 1973). Yet, throughout the Soviet period, the authorities have maintained an ambivalent attitude to household producers: their importance to food security was tacitly recognized, yet the government refrained from providing any support to household production so as not to encourage any “capitalistic,” private ownership tendencies (Lovell 2003). Gorbachev’s perestroika, the subsequent disintegration of the USSR, and Russia’s lib- eral reforms radically altered the picture. As the state withdrew support to agricultural producers in the early 1990s, kolkhoz and sovkhoz production dwindled. Yet, at the same time, land became more readily available for household producers, which resulted in a sharp increase in the number of household producers and their output. It is recognized that the maintenance of adequate levels of food security over the transition period of 1990s was 11
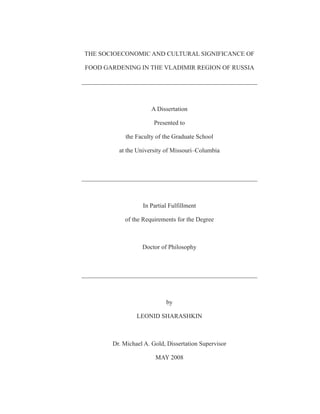
- 31. largely due to the proliferation of household plots (Sedik, Sotnikov, and Wiesmann 2003). In 2003, 34.8 million families (66% of all households in the country) owned gardening plots (subsidiary plot, allotment, garden, or dacha) and were involved in growing crops for subsistence (Rosstat 2005b). By 2005, 53% (by value) of the country’s total agricultural output was coming from household plots (which in 2006 occupied only 2.9% of agricul- tural land), while the remaining 47% (by value — Rosstat 2006) came from the agricultural enterprises (often the former kolkhozes and sovkhozes) and individual farmers, requiring 97.1% of agricultural lands (Rosstat 2007b). Therefore, just as predicted by Chaianov (Kremnev 1920) almost a century earlier, household production is currently 38 times more efficient in terms of land use than the “official” agriculture (i.e., requires 38 times less land area to produce 1 ruble worth of output), and also requires no governmental subsidies or support. For all these reasons, this traditional sector of Russian agriculture deserves the name of primary agriculture. Key macroeconomic characteristics Productivity: share of GDP and agricultural output In 2004, agricultural production of dacha gardeners (urban) and subsidiary plot cultivators (rural) amounted to 51% (by value) of the total agricultural output of the Russian Federa- tion (Rosstat 2006). This represents 384 billion rubles (approx. US$14 bn at the then cur- rent exchange rate), or 2.3% of Russia’s Gross Domestic Product (GDP). This is greater, for example, than the contribution to the GDP of the whole electric power generation in- dustry (317 bn rubles); significantly greater than all of forestry, wood-processing, and pulp and paper industry combined (180 bn); significantly greater than the coal (54 bn), natural gas (63 bn), and oil refining (88 bn) industries combined. (See Figure 1.) 12
- 32. 450 400 350 300 250 200 150 100 50 0 er g s s ile ls er ng l l oa ee ga ug in ia ap w xt i fin en C St er dr po Te al &p re at rd ur & ric lp m ga il at al pu O t g N ec ilc od in d, m El ild Fo oo he Bu ,w C try es r Fo Figure 1. Food gardening and other industries’ contribution to GDP in 2004, billions of rubles. Source: Rosstat 2006. The share of food gardening in national agriculture has increased from 32% in 1992 to over 50% by 2000. Figure 2 presents the place of household production in the country’s agriculture. For the past decade, food gardeners have been making a larger contribution to the total agricultural output of the country than the commercial sector. According to Rut- kevich (2001), this is still an underestimate, since these figures do not include harvesting wild-growing plants, berries, nuts and mushrooms, and fishing and hunting, which also make an important contribution to the national food economy. It should be noted that since the above aggregate statistics include the production of grain by the industrial agriculture sector, as well as production of industrial non-food crops such as flax, the contribution of the households to the food economy is even greater. The share of households in production of certain products is very high: it is consistently over 90% for potatoes and around 80% for vegetables (see Table 1). 13
- 33. 80% 70% 67% 54% 56% 56% 60% 52% 51% 48% 50% Ag. enterprises 50% 40% 33% 44% Households 43% 43% 40% 40% Independent farmers 30% 20% 10% 4% 4% 5% 6% 1% 2% 3% 0% 1992 1995 2000 2001 2002 2003 2004 Year Figure 2. Share of agricultural enterprises, households and independent farmers in Russia’s agricultural output (by value), 1992–2004. Source: Rosstat 2006. Table 1. Agricultural production by Russian households, 2004. Mln Share of total agricultural tonnes output of this product, percent Potatoes 33.0 92.8% Vegetables 11.5 80.1% Fruit and berries 3.2 81.1% Meat 2.6 52.5% Milk 16.7 52.2% Eggs, billion 9.5 26.7% Wool, thousand tonnes (2003) 25.6 56.9% Source: Rosstat 2005b. It is also important to point out regional differences: commercial agriculture (espe- cially row crops production) is concentrated in the “black soil” (chernozem) regions of Southern European Russia. At the same time, private-plot gardening by rural residents is spread all over the country, whereas dacha production by urbanites is concentrated around 14
- 34. major urban centers, most of which lie outside the “black soil” regions. For this reason, the share of household agriculture in regions outside the chernozem belt is even higher than the country’s average (even though both climatic and natural resource conditions are not nearly as favorable for food growing as in the country’s South). For example, in the Vladimir oblast (a typical region of central non-chernozem Russia) in 2004, the share of households in the region’s agricultural output was 57% — six percentage points higher than the national average of 51% (Vladimirstat 2006c). Use of land resources Producing 1 ruble worth of output requires significantly less land in household agriculture than in commercial agriculture. In 2006, 53% (by value) of the country’s total agricultural output was coming from household plots which occupied only 2.9% of agricultural land, while the remaining 47% of output by commercial agricultural enterprises (often the former kolkhozes and sovkhozes) and individual farmers, required 97.1% of agricultural lands (Ros- stat 2007b). As noted above, household production requires 38 times less land area to pro- duce 1 ruble worth of output. It is noteworthy that such exceptional productivity has historic antecedent: prior to World War I Russian peasants’ private plots attached to their dwelling were at least four times more productive than the fields outside the village (Shinn 1987). The 2006 Census of Agriculture (Rosstat 2007a) confirmed that households own only 2.5% of all lands (both agricultural and non-agricultural) used by all parties involved in agriculture, only 5.8% of agricultural lands and only 6.0% of all agricultural lands actu- ally used in production (see Table 2). This, again, is similar to the share of land devoted to peasant’s garden-plots in the end of the 19th century and the first quarter of the 20th cen- tury — which varied from 0.1% to 7.3%, depending on year and region (Schinn 1987). 15
- 35. Table 2. Land usage by different groups of users, in percent of the total usage of land by category (columns total 100%). Total Ag. Tillage Hay- Pastures Perenni- Fallow Used ag. land lands fields als* lands Enterprises (corporate farms) 90.8% 79.7% 80.5% 72.9% 86.1% 52.4% 66.1% 78.1% Individual (family) farmers 6.7% 14.5% 16.4% 8.1% 10.2% 3.7% 19.4% 15.9% Households (food gardeners) 2.5% 5.8% 3.1% 19.0% 3.7% 43.9% 14.5% 6.0% Total 100.0% 100.0% 100.0% 100.0% 100.0% 100.0% 100.0% 100.0% Source: Rosstat 2007a. Preliminary results of the 2006 Census of Agriculture, Issue #3. Note: *See Table 4 for additional data on perennials. How can households achieve such exceptional productivity on such a small land area? There are several factors involved. First, both households and individual farmers make a much fuller use of land resources at their disposal than the agricultural enterprises. Table 3 shows that households use 69% and farmers use 67% of their land for actual agricultural production, compared to only 24% for agricultural enterprises. In addition to agricultural land resources, enterprises use vast areas of non-agricultural lands — 271 mln ha, compared to only 1.3 mln ha for households. In 2006, corporate farms left fallow 9.6 mln ha of agricultural lands at their disposal. For comparison, the same year households produced more than 50% of the country’s agricul- tural output on 7.6 mln ha of land! Table 3. Land used for agricultural production by different groups of users. Total land Used in ag. production area, mln Percent of ha mln ha total land Enterprises (corporate farms) 404.6 98.6 24% Individual (family) farmers 29.8 20.1 67% Households (food gardeners) 11.0 7.6 69% Total 445.4 126.2 28% Source: Rosstat 2007a. Preliminary results of the 2006 Census of Agriculture, Issue #3. 16
- 36. Second, households make much greater expenditures of labor on a per ha basis than en- terprises, which enables the households to achieve the high levels of productivity. Besides, the quality of their labor is very different from that in commercial agriculture. Growing crops for their family consumption, gardeners work with a diligence and responsibility that can hardly be expected from hired workers employed in the large enterprises of industrial agriculture. This divergence in attitudes has deep historic roots. In the times of feudal Russia, peasant serfs were as careless in tending their landlord’s lands as they were caring when tending their own plots. Little changed during the Soviet era: peasants were notori- ous for their lack of productivity and responsibility while working on the “collective” farms, while being exceptionally hard-working when it came down to taking care of their own homestead with its animals and garden-plot (Lovell 2003; Shinn 1987). Third, households achieve a much higher level of integration in the use of their land. While commercial agricultural producers tend to devote large land areas to the production of a single crop (most often annual), gardeners blend a large number of species (both an- nual and perennial) on their small plots into an integrated whole. As is seen from Table 2, while owning less than 6% of agricultural lands in the country, households at the same time own 44% of perennial plantings. In fact, garden-plots can justifiably be called micro-scale agroforestry systems, since the four key characteristics of agroforestry practices can be observed in gardening. Ac- cording to Gold and Garrett (2008), the key characteristics that distinguish agroforestry practices are the combination of annual and woody perennial plantings that are intentional, intensive, integrated, and interactive. The co-location of annual crops (especially vegetables such as potatoes) with shrubs (raspberry, currants, etc.) and trees (apples, pears, plums, cherries, etc.) in Russian 17
- 37. garden-plots is certainly intentional: the several hundred square meters of ground at the household’s disposal is often all the land they have to produce both vegetables and fruit for the family, so the mixing of annual and perennial plants becomes an inevitability. Figure 3 shows a typical dacha plot on which the plantings of vegetables, shrubs, and trees are in- tentionally combined. Because of the limited plot size, the household gardening practice is of necessity inten- sive. It is obvious that only by intensive management of both annual and perennial plants can gardeners achieve their high levels of productivity. Figure 4 shows a highly intensive gardening practice: in this micro-scale alley cropping system, raised beds of potatoes are Figure 3. A typical 600 m2 dacha plot as an agroforestry system: mixed plantings of vegetables, shrubs and trees. 18
- 38. interplanted with rows of rye. To maintain soil fertility, potatoes and rye switch places every year, and rye straw is used as mulch to add organic matter to the soil and to control weeds. Likewise, because of the small plot size, the annual and perennial plantings are usu- ally highly integrated: the gardeners have no space so as to devote one patch of ground exclusively to an orchard, another exclusively to the vegetable beds, etc. On the contrary, annuals, shrubs and trees are planted together, and gardeners take care to position the trees in such a way so as not to shade other crops. Figure 5 shows a hedge of raspberry bushes alongside vegetable beds. In addition to producing harvests of raspberries, this low-main- tenance “living fence” protects the garden from winds, attracts birds that control pests, and keeps unwanted visitors out. Figure 4. An intensive potato/rye alley cropping. Photo 2004 by Alexey Kondaurov. 19
- 39. Finally, the gardening practices are interactive. Because of the presence of perennial plantings, especially trees, the gardens are managed on the basis of not just annual cycles of vegetable crop growing, but the longer cycles involving the growth of the trees. As trees grow, they produce more shade; besides, the ground under the tree crowns can no longer be subjected to deep tillage, so as not to damage the roots. As a result, gardeners use adap- tive management approaches and change the composition and positioning of the vegetable plantings depending on the stage of growth of trees and shrubs. Figure 6 shows the same garden-plot with an interval of about 12 years: in the early years of operation much of the plot was devoted to potato cultivation, while the apple, pear, plum and cherry trees, as well as a variety of shrubs, were starting to grow. Twelve years later, as the trees have grown and started to bear fruit, the area under the trees was withdrawn from vegetable growing and converted to a lawn for leisure uses. Figure 5. A multi-functional raspberry hedge bordering vegetable beds. Photo 2004 courtesy of Alexey Kondaurov. 20
- 40. Figure 6. The evolution of a dacha garden-plot. 21
- 41. That household gardening is a highly diversified agroforestry practice can also be seen from the statistics on gardens’ contribution to the production of certain foodstuffs (see Table 1 above), which shows that households hold leading roles not only in production of annual vegetable crops including potatoes, but also in perennial fruit production and ani- mal husbandry. As we shall see in the next chapter, this is also confirmed by the results of our own survey in the Vladimir region. Besides, the 2006 Census of Agriculture offers detailed statistics on households’ share of different annual and perennial plantings in the national totals (see Tables 4 and 5 for the summary data; Table 6 for detailed data on annual crops and Table 7 for detailed data on perennial crops). Table 4. Distribution of land under different crop categories (annual and perennial) for agricultural enterprises, individual farmers, and households, as of July 1, 2006. Agricultural Independent Households TOTAL enterprises farmers 000’s % of 000’s % of 000’s % of 000’s % of ha this ha this ha this ha this crop crop crop crop All crops total 59,029 78% 12,943 17% 3,551 5% 75,522 100% Annual crops total 58,774 79% 12,924 17% 3,160 4% 74,858 100% Grains and beans 34,350 79% 9,014 21% 355 1% 43,719 100% Industrial crops* 6,313 72% 2,468 28% 33 0.4% 8,814 100% Potatoes 154 7% 79 4% 1,884 89% 2,118 100% Vegetables and melons 123 17% 122 16% 501 67% 747 100% Forage crops 17,833 92% 1,241 6% 387 2% 19,461 100% Perennial crops total 255 38% 18 3% 391 59% 664 100% Perennial fruits, berries and nuts 191 32% 17 3% 387 65% 595 100% Other perennials 64 92% 2 2% 4 6% 70 100% Note: *Industrial crops — raw material for factory processing, e.g., flax. Source: Rosstat 2007a. The 2006 Census of Agriculture, Preliminary results, Issue #3, Tables 14 & 18. 22
- 42. Table 5. Distribution of land under different crop categories (annual and perennial) for agricultural enterprises, individual farmers, and households, as of July 1, 2006 (sum across columns). Agricultural Independent Households TOTAL enterprises farmers 000’s % of 000’s % of 000’s % of 000’s % of ha total ha total ha total ha total land land land land used used used used for all for all for all for all crops crops crops crops All crops total 59,029 100% 12,943 100% 3,551 100% 75,522 100% Annual crops total 58,774 100% 12,924 100% 3,160 89% 74,858 99% Grains and beans 34,350 58% 9,014 70% 355 10% 43,719 58% Industrial crops* 6,313 11% 2,468 19% 33 1% 8,814 12% Potatoes 154 0% 79 1% 1,884 53% 2,118 3% Vegetables and melons 123 0% 122 1% 501 14% 747 1% Forage crops 17,833 30% 1,241 10% 387 11% 19,461 26% Perennial crops total 255 0% 18 0% 391 11% 664 1% Perennial fruits, berries and nuts 191 0% 17 0% 387 11% 595 1% Other perennials 64 0% 2 0% 4 0% 70 0% Note: *Industrial crops — raw material for factory processing, e.g., flax. Source: Rosstat 2007a. The 2006 Census of Agriculture, Preliminary results, Issue #3, Tables 14 & 18. As can be seen from Tables 4 and 5, commercial agricultural producers put primary emphasis on annual crops (which amount to 99.6% of land area for agricultural enterprises and 99.9% for independent farmers), especially grains, forages and “industrial crops” (raw materials for factory processing such as flax, sunflower, and sugar beets). Potatoes, veg- etables, and perennial crops each occupy less than 1% of land used by enterprises and independent farmers. At the same time, households place emphasis on potatoes (53.1% of planting area), and devote the balance of the land to vegetables, perennial crops, forages, grains and beans — roughly in equal measure (between 10% and 15% each). Household production is highly diversified (Tables 6 and 7), and households play a leading role in the production of most vegetable and perennial crops. 23
- 43. Table 6: Distribution of land under different annual crops for agricultural enterprises, individual farmers, and households, as of July 1, 2006. Agricultural Independent Households TOTAL enterprises farmers 000’s % of 000’s % of 000’s % of 000’s % of ha this ha this ha this ha this crop crop crop crop Total annual crops for 2006 harvest 58,774 79% 12,924 17% 3,160 4% 74,858 100% Grains and beans 34,350 79% 9,014 21% 355 1% 43,719 100% wheat 18,450 78% 5,085 22% 166 1% 23,701 100% barley 7,761 78% 2,166 22% 87 1% 10,014 100% oats 3,226 86% 503 13% 31 1% 3,761 100% rye 1,550 85% 260 14% 4 0% 1,814 100% beans 1,170 90% 123 10% 4 0% 1,296 100% buckwheat 742 64% 420 36% 4 0% 1,166 100% corn for grain 758 72% 244 23% 54 5% 1,056 100% millet 486 72% 189 28% 2 0% 676 100% rice 149 93% 11 7% 0 0% 160 100% sorghum 32 76% 9 21% 1 3% 42 100% other grains 26 80% 4 13% 3 8% 33 100% Industrial crops (raw material for 6,313 72% 2,468 28% 33 0% 8,814 100% factory processing) oil crops (sunflower, soy, mustard, 5,335 69% 2,319 30% 28 0% 7,682 100% etc.) sugar beets 853 86% 139 14% 4 0% 996 100% flax 78 93% 6 7% 0 0% 83 100% other industrial crops (coriander, mint, medicinals, hemp, beets for 48 91% 5 9% 0 1% 53 100% seeds, cotton, tobacco, etc.) Potatoes 154 7% 79 4% 1,884 89% 2,118 100% Vegetables and melons 123 17% 122 16% 501 67% 747 100% cabbages (all kinds including 23 21% 11 10% 75 68% 110 100% cauliflower, broccoli, etc.) tomatoes 8 7% 13 12% 88 81% 109 100% onions 16 19% 5 6% 62 75% 83 100% carrots 14 21% 8 12% 45 68% 66 100% cucumbers 3 4% 6 9% 53 87% 61 100% beets 11 26% 6 13% 27 62% 43 100% pumpkin 2 8% 3 8% 25 84% 30 100% garlic 0 0% 0 0% 28 100% 29 100% squash 3 12% 3 12% 17 76% 22 100% green peas 10 72% 1 7% 3 20% 13 100% other vegetables 2 20% 1 7% 9 73% 12 100% 24
- 44. [Table 6 continued.] Agricultural Independent Households TOTAL enterprises farmers 000’s % of 000’s % of 000’s % of 000’s % of ha this ha this ha this ha this crop crop crop crop greens & herbs 1 5% 0 1% 10 95% 11 100% green beans 0 0% 0 0% 10 99% 10 100% bell peppers 1 13% 2 17% 7 70% 10 100% vegetables for seed 4 85% 1 14% 0 1% 5 100% eggplant 0 11% 1 24% 3 66% 4 100% sweet corn 2 66% 0 3% 1 32% 2 100% onion for seed 0 19% 1 35% 1 46% 2 100% salad 0 2% 0 2% 1 96% 2 100% watermelons and melons 24 22% 63 58% 21 20% 108 100% Forage crops 17,833 92% 1,241 6% 387 2% 19,461 100% perennial cereals 6,351 90% 584 8% 161 2% 7,095 100% perennial legumes 5,917 93% 346 5% 101 2% 6,363 100% annual grasses 3,622 92% 236 6% 62 2% 3,919 100% corn for feed (green mass) 1,421 97% 45 3% 1 0% 1,467 100% silos crops (excluding corn) 362 95% 18 5% 0 0% 381 100% other forage crops 127 86% 8 6% 12 8% 147 100% tubers for feed (including beets) 22 38% 2 3% 35 59% 59 100% melons for feed 11 37% 2 8% 16 55% 28 100% forage crops for seed 1 89% 1 7% 0 4% 1 100% Source: Rosstat 2007a. The 2006 Census of Agriculture, Preliminary results, Issue #3, Table 14. The understanding of food gardens as evolving agroforestry systems (as opposed to routine annual crop operations) is important for explaining the trends observed in this prac- tice. Because of the prominence of the perennial component of gardening, many land use decisions are made not on an annual, but on a significantly longer-term basis. Therefore, today’s changes in the cultivation and output of certain crops may be due not to the current economic conditions or shifts in growers’ preferences, but to the decisions made and actions undertaken a decade or longer ago. For example, Southworth (2006) observed a declining 25
- 45. Table 7. Distribution of land under different perennial crops for agricultural enterprises, individual farmers, and households, as of July 1, 2006. Agricultural Independent Households TOTAL enterprises farmers 000’s % of 000’s % of 000’s % of 000’s % of ha this ha this ha this ha this crop crop crop crop All perennials 255.1 38% 18.4 3% 390.9 59% 664.3 100% Perennial fruit, berry and nut 190.9 32% 16.8 3% 386.8 65% 594.6 100% crops fruit (temperate spp.) 171.0 39% 13.6 3% 251.2 58% 435.7 100% apples 146.5 59% 9.2 4% 92.5 37% 248.2 100% cherries 7.2 10% 1.1 2% 66.9 89% 75.1 100% plums 8.3 18% 0.8 2% 36.2 80% 45.3 100% pears 4.9 13% 1.1 3% 31.8 84% 37.8 100% apricots 2.6 17% 1.0 6% 11.5 77% 15.1 100% peaches 0.9 24% 0.3 8% 2.6 68% 3.8 100% other fruit (temperate spp.) 0.7 7% 0.0 0% 9.6 92% 10.5 100% nuts 3.1 31% 1.3 13% 5.7 57% 10.1 100% hazelnuts 2.5 39% 1.0 15% 2.9 45% 6.4 100% walnuts 0.6 17% 0.3 7% 2.7 76% 3.6 100% almonds 0.0 4% 0.0 6% 0.1 96% 0.1 100% other nuts 0.0 14% 0.0 15% 0.1 72% 0.1 100% subtropical fruit 0.4 19% 0.2 11% 1.3 70% 1.9 100% persimmons 0.2 20% 0.2 17% 0.7 63% 1.1 100% figs 0.0 5% 0.0 2% 0.2 94% 0.2 100% pomegranates 0.0 11% 0.0 4% 0.1 86% 0.1 100% other subtropical 0.1 27% 0.0 1% 0.3 72% 0.4 100% citrus 0.0 25% 0.0 2% 0.0 75% 0.1 100% berries 16.5 11% 1.8 1% 129.4 88% 147.6 100% strawberries 2.1 5% 0.7 2% 41.7 94% 44.6 100% raspberries, blackberries 2.1 7% 0.2 1% 30.0 93% 32.3 100% currents 5.9 14% 0.3 1% 36.7 86% 42.9 100% gooseberries 0.1 1% 0.1 1% 8.6 98% 8.8 100% black rowanberries 2.0 34% 0.0 1% 3.8 65% 5.8 100% sea-buckthorn 3.6 44% 0.3 4% 4.2 52% 8.1 100% other berries 0.8 15% 0.1 1% 4.3 84% 5.2 100% Grapes 59.8 92% 1.4 2% 4.0 6% 65.2 100% Hops 0.7 96% 0.0 4% 0.0 0% 0.8 100% Tea 1.4 99% 0.0 1% 0.0 0% 1.4 100% Nurseries 2.2 93% 0.2 6% 0.0 1% 2.4 100% Source: Rosstat 2007a. The 2006 Census of Agriculture, Preliminary results, Issue #3, Table 14. 26
- 46. trend in the number of households planting potatoes from the mid-1990s to 2003, and interpreted it as a sign of gardens’ declining subsistence role. However, the “subsistence” function of gardening cannot be reduced to a single crop (potatoes). Besides, if gardening is viewed as an agroforestry practice, the gradual decline in the number of households plant- ing potatoes is actually predictable and explainable by the fact that as the perennial plants (e.g., fruit trees and shrubs) planted in the ’80s and ’90s (when the majority of garden-plots were acquired) grow and start to bear fruit, the relative significance of annual crops de- creases. Thus, far from being converted from self-provisioning to leisure uses, the gardens continue to fulfill their subsistence role with a new (and ever-evolving) mix of crops. Labor: participation in gardening According to official statistics (Goskomstat 2004), in 2003, 34.8 million families (66% of all households in the country) owned a gardening plot (subsidiary plot, allotment, garden, or dacha) which could be used for growing crops and/or raising animals. This figure de- creased to 33.3 million in 2005. This figure does not include people who do not own, but use their relatives’ or friends’ dacha or whose summer residence is not officially recognized as a “dacha” (e.g., urban owners of a village house). Table 8 presents the number of house- holds that owned agricultural land plots from 1992 to 2005. The statistics in Table 8 are based on ownership of a plot, and thus offer only an ap- proximation of the actual number of plots used for food production, and the number of households engaged therein. Until the 2006 Census of Agriculture was conducted, there were no national-level statistics on the proportion of the plots that were actually used in production. So, the above statistics include plots that are abandoned or used only for recre- ation, as well as plots that are used by more than one household. 27