SlideShare una empresa de Scribd logo
1 de 17
Descargar para leer sin conexión
1.74%
62.5%
Fleets Bolstering New Car Sales; Fishy? Jitters Index
-1.2%
*Reported Sales Aug '12 % of RS* Aug '11 % of RS* % Change
Reported 1,285,292 1,072,387 19.85%
Delivered 1,186,428 92.31% 1,066,241 99.43% 11.27%
Fleet/Bus Orders 98,864 7.69% 6,146 0.57% 1508.59%
Act. 31 Days Aug. 1,123,691 87.43% 1,039,427 96.93% 8.11%
Sept. 1-2 62,737 4.88% 26,814 2.50% 133.97%
Fleet/Bus Orders 98,864 7.69% 6,146 0.57% 1508.59%
Avg. 12 Mo. Cancel 18.63% 12.82% 45.32%
Fulfilled Orders 80,446 6.78% 5,358 0.50% 1401.39%
Total Aug Sales 1,204,137 93.69% 1,044,785 97.43% 15.25%
Before looking at
September sales projections,
here’s an interesting breakout
of August sales.
The industry reported
1.285 million sales, up 19.85
percent vs. a year ago.
But on further
investigation, the number of
fleet orders counted as sales
were significantly higher this
year compared to last.
Of this year’s sales report,
7.7 percent were fleet and
business orders which are
booked as “sales” but are scheduled for delivery later in the year. This compares with 0.57 percent a
year ago.
In and of itself, wouldn’t be a concern and could be attributed to an improving economic outlook.
But it skews the industry into looking significantly stronger than it actually is. Why? Many of those orders will be cancelled prior to delivery.
In August of last year, for example, nearly13 percent were cancelled. This year, the figure is running closer to 19 percent. So, to be honest,
of the 98,800 fleet-business orders reported as sales in August, an estimated 80,450 will actually be delivered (sold).
Secondarily, in the August data, sales attributed to August that were actually written in the first two days of September accounted for
nearly 5 percent of total sales compared to 2.5 percent a year ago.
So what were the actual sales in August when adjusted for September pull-forward and fleet-business orders that will be fulfilled? Up a
solid 15.25 percent to 1.2 million; but not nearly as impressive as “20” percent.
And where did those extra orders come from? Interesting in an election year that state and federal governments gave a solid boost to
the auto industry by increasing orders by 80 percent vs. a year ago; a 30-fold increase vs. July. (See Page 7 for details.)
09.21.12
12.93% 13.98%
11.9%
Page 2… CNW Research: Retail Automotive Summary September 2012
Closing Ratio
Closing Ratio
37.02%
September Outlook: Could Hit 14.2 Million Delivery Rate; Year on Track: 14.5 Million
With the first 20-days of September behind us, the rest of the month could well put the auto industry at a 14.2 million delivery rate
and the year at 14.5 million units. Reported sales for the month should be up about 13 percent with deliveries up 11.7 percent.
Same store sales were just about 13 percent higher in the first 20 days vs. year ago with closing ratios swelling to 37 percent of
floor traffic. The last figure is well ahead of August’s 31 percent. (Doc. 832.)
While floor traffic has slowed somewhat, it still remains higher than year-ago by nearly 12 percent. Motivation: “Fuel economy of
existing vehicle” number one for 29 percent of new-car intenders followed by “Existing vehicle no longer suitable for driving needs”
(21.4 percent).
Most Staying in Same Market Segment
With that said, CNW’s Purchase Path still shows the majority of consumers who are looking to make a new-vehicle acquisition
are planning to remain in the same market segment and counting on the new vehicle to provide greater fuel economy. Roughly 18
percent say they are moving from a truck to a car with 11 percent reporting they intend to move from a car to a truck.
Loyalty to Brand Rebounding
While it’s too early to tell if the trend will continue, there is an
undercurrent of satisfaction with the current brand owned among
new-car intenders. Translation: The vast majority of new-car
intenders say they will stick with their current automaker when
time comes to make the trade.
That is welcome news for Toyota and Honda who have seen
the loyalty to those marques diminish over the past three years.
Ford and Hyundai were the two major recipients of those would-
be defectors. It now looks as if Ford, at least, will have to up its
marketing efforts to snag Toyota/Honda leaners.
Hyundai, on the other hand, continues to be on the shopping
list for Toyota/Honda shoppers as is Nissan and Chrysler to a
lesser extent.
General Motors, however, is being seriously thwarted
among new-car intenders. Fully 22 percent of new-car
intenders believe GM will eventually re-file for bankruptcy
within the next few years.
Only 8 percent of intenders think Chrysler will re-file for
bankruptcy, down from 34 percent two years ago.
Page 3… CNW Research: Retail Automotive Summary September 2012
Jitters Index Slips v Year Ago, Flat Compared to August; Await Election
JITTERS INDEX Fed Gas Child’s Job Day to Day Condition of Food Local Jitters
Taxes Prices Edu Stability Needs Investments Prices Taxes Index
Vs Previous Mo. -0.10% 0.77% 0.00% 0.50% 0.78% -0.96% 1.68% 0.00% 0.38%
Vs Mo. ‘11 0.31% -7.29% -10.15% -3.00% 5.85% -7.21% 4.43% 0.71% -1.20%
Americans are putting many of their home-centric economic worries
on hold until the Presidential election is over. That’s the take-away from
the September Jitters Index surveys.
Overall, the Jitters Index was effectively unchanged from August’s
reading, up barely 0.38 percent. Each of the categories within the Index
similarly showed little month-over-month movement with the exception
of food prices.
When asked what they felt was the most important issue or event
that could affect their overall concerns, the Presidential Election was
number one, regardless of party affiliation.
A slim majority of the Key Market (consumers who make up the bulk
of big-ticket purchasers including auto buyers) said they expect the
Obama Romney
Gas Prices -37% 21%
Food Prices -21% 2%
Taxes -59% 14%
Job Stability 11% 19%
Day to Day Needs -12% -13%
Condition of Investments 15% 26%
Local Taxes -2% -1%
Overall Score -15% 10%
Weighted Average Respondents
re-election of President Obama would lengthen and/or worsen their home-centric economic condition.
Obama v Romney On Short-Term Impact
When asked about each of the home-centric main categories, Governor Romney was viewed as being able to have a quicker
positive impact on their lives, according to the respondents, while the overall score for President Obama was on the negative side
of the scale.
Policies that would improve gas prices, for example, showed Obama scoring a negative 37 percent to Romney’s positive 21
percent. On the ability to stabilize the job market, both men scored positive with Obama at 11 percent, Romney at 19 percent.
In terms of initiating policies that would improve “Day to Day Needs”, both men were viewed about the same at negative 12
and 13 percent respectively.
Neither man was seen as being able to impact local taxes but Obama had a negative score of 59 percent when it came to
federal taxes while Romney had a positive 14 percent rating.
Page 4… CNW Research: Retail Automotive Summary September 2012
Note: This is a Graphs Page.
40
45
50
55
60
65
70
75
80
85
90
Used Vehicle Days' Supply
Sept.
Split of Days'
Supply
Car Truck
Sept 104.2% 96.70%
Oct 103.2% 96.35%
Nov 106.1% 95.32%
Dec 106.8% 94.68%
Jan 105.6% 94.95%
Feb 97.8% 105.85%
Mar 92.0% 110.71%
Apr 85.7% 118.41%
May 86.3% 118.66%
June 83.8% 122.14%
July 87.2% 109.67%
Aug 91.3% 108.85%
Sept 93.2% 107.02%
Oct 94.48% 105.31%
Nov 98.03% 104.67%
Dec 101.35% 98.44%
Jan. 12 102.42% 97.67%
Feb 89.93% 109.74%
Mar 88.58% 111.43%
Apr 86.37% 113.57%
May 90.24% 108.21%
June 102.71% 97.53%
July 119.46% 90.32%
Aug 121.64% 88.29%
Sep 121.73% 88.34%
Document 112m Detroit Asian Euro
May 40.91 44.87 52.36
June 41.57 43.79 52.74
July 41.06 43.92 50.03
August 43.34 41.28 48.62
Sept 44.97 42.05 46.32
Oct 45.62 42.09 46.58
Nov 45.05 44.28 45.32
Dec 45.08 46.39 45.47
Jan. 12 43.22 44.92 45.76
Feb 43.71 45.02 45.66
Mar 44.82 46.87 45.61
Apr 45.36 46.72 45.29
May 44.06 45.22 44.97
June 44.51 46.29 45.71
July 48.06 47.24 46.94
Aug 49.19 48.83 47.26
Sep 49.71 48.93 48.02
Anticipated
Sept Actual Sept % Chng YTD YTD % Chng
Document 106m cy12 cy11 12v11 cy2012 cy2011 12v11
Franchised
Dealer Sales
1,328,881 1,189,966 11.7% 11,556,061 11,008,705 5.0%
Independent
Dealer Sales
1,288,739 1,174,839 9.7% 10,596,501 11,001,610 -3.7%
Casual (Private)
Sales
873,005 863,670 1.1% 9,194,429 8,144,612 12.9%
Total Sales 3,490,625 3,228,475 8.1% 31,346,991 30,154,927 4.0%
Page 5… CNW Research: Retail Automotive Summary September 2012
September got off to a strong used-sales start that continued
throughout the first 20 days and put the industry on a path to an
8-plus percent gain.
For the first time in months, Independent dealers are looking
at a significant year-over-year improvement thanks to
inventories and supply becoming more stable and
improvements in inventory make up.
Like the new-car market, all dealers are finding it easier to
place sub-prime used-vehicle paper. For the new-car market,
approvals for sub-prime are up 62 percent vs. year ago and 8.6
percent vs. last month.
A similar condition exists on the used-car side with sub-
prime in the opening weeks of September up by nearly 50
percent vs. the same month of 2011.
CONTEXT: Expect continued strong showings for Independent
dealers over the coming quarter as long as the supply issues
continue to improve and new-car dealers have solid trade-in
volumes. There was a slight weeding-out process over the
summer eliminating some weaker Indies. CNW expects the loss
of 200 to 500 used-car outlets by the end of the year.
September: All Channels Up; Indies’ Supply Stabilizes, Pushes Volume to Positive Gain
60.0%
70.0%
80.0%
90.0%
100.0%
110.0%
120.0%
130.0%
Sept Nov Jan Mar May July Sept Nov Jan.
12
Mar May July Sep
Car V Truck Days' Supply
Car
Truck
New Finance Only (Doc 1409)
Prime
Near
Prime Sub Prime
% Change v year ago 3.8% 4.3% 62.5%
% Change v previous month 0.44% 0.30% 8.55%
Page 6… CNW Research: Retail Automotive Summary September 2012
Franchised Independent Franchised Franchised Independent Independent
Document 107m Asking Price Asking Price Trans Price % of Asking Trans Price % of Asking
Jan. '12 $11,516 $10,483 $10,855 94.26% $9,715 92.67%
Feb. '12 $11,714 $10,627 $11,155 95.23% $9,909 93.24%
Mar '12 $11,826 $10,592 $11,254 95.16% $9,874 93.22%
Apr ’12 $12,293 $10,289 $11,500 93.55% $9,379 91.16%
May '12 $12,119 $9,987 $11,296 93.21% $9,071 90.83%
June '12 $11,684 $9,937 $10,754 92.04% $8,977 90.34%
July '12 $12,136 $9,842 $11,185 92.16% $8,943 90.87%
Aug '12 $12,103 $9,849 $11,138 92.03% $8,936 90.73%
Sept ‘12 $11,827 $9,767 $10,894 92.11% $8,853 90.64%
Sept '11 $11,253 $10,219 $10,807 96.04% $9,572 93.67%
Oct. 11 $11,394 $10,384 $10,952 96.12% $9,744 93.84%
Nov. '11 $11,186 $10,148 $10,654 95.24% $9,452 93.14%
Dec '11 $11,058 $10,039 $10,547 95.38% $9,384 93.48%
Percent Change Yr over Yr 5.63% -3.18% 1.06% -4.34% -6.90% -3.85%
Month Over Month Price -0.27% 0.07% -0.42% -0.15% -0.08% -0.15%
Used Vehicle Prices Still Soft on Higher Volume; Turnaround May be in the Making
The rate of price decline month over month is shrinking which could portend positive price increases in the fourth quarter of this
year and certainly no later than the first quarter of next.
Franchised-dealer asking prices were up more than 5.6 percent in the opening weeks of September but they couldn’t make the
higher tags fully stick. Actual transaction prices were up barely 1 percent.
Independents’ asking prices were 3.2 percent lower than year ago with transaction prices off nearly 7 percent.
Haggling Increases
Used Car intenders are bargain hunting and increasingly using online price guides and Internet price sites such as AutoTrader and
craigslist to haggle with dealers. In fact, the number of shoppers who now haggle over a used car price has climbed from 71 percent in
2005 to more than 85 percent this year.
Page 7… CNW Research: Retail Automotive Summary September 2012
Commercial-Fleet Jumps 96 Percent in August
cy12 Jan Feb March April May June July August
All Sales 912,874 1,148,975 1,404,100 1,184,069 1,334,150 1,285,005 1,153,269 1,285,292
Percent Change v Previous Year 11.4% 15.7% 12.7% 2.4% 25.9% 22.0% 8.9% 19.9%
Fleet and Commercial Use 39.52% 36.48% 36.92% 38.09% 36.41% 38.25% 38.73% 44.38%
Total Fleet (Monthly Approximates) 360,768 419,146 518,394 451,012 485,764 491,514 446,661 570,413
Percent Change v Previous Year 32.7% 40.5% 31.6% 22.4% 63.5% 77.2% 57.8% 96.1%
FLEET COMMERCIAL VALUE -- Per Unit $27,219 $27,254 $27,614 $27,943 $27,904 $28,147 $28,221 $28,794
FLEET COMMERCIAL VALUE -- Total $Bllns $9.82 $11.42 $14.31 $12.60 $13.55 $13.83 $12.61 $16.42
Percent Change v Previous Year 40.92% 48.55% 39.68% 30.13% 69.34% 84.70% 64.12% 104.25%
Government Fleet 18,805 23,439 28,222 24,747 25,616 25,315 22,373 40,358
Share Gov't of Total Sales 2.06% 2.04% 2.01% 2.09% 1.92% 1.97% 1.94% 3.14%
Percent Change v Previous Year -27.6% -17.5% -16.7% -18.0% 3.3% 10.8% 2.5% 83.7%
Small Business Fleet and Commercial Use 35,967 47,338 59,815 51,152 59,770 58,082 53,973 60,537
Share Small Business of Total Sales 3.94% 4.12% 4.26% 4.32% 4.48% 4.52% 4.68% 4.71%
Percent Change v Previous Year 34.3% 29.1% 24.1% 13.1% 72.4% 81.4% 63.8% 73.2%
Medium Business Fleet and Commercial Use 88,731 116,736 150,520 124,682 142,887 124,388 112,790 117,861
Share Medium Business of Total Sales 9.72% 10.16% 10.72% 10.53% 10.71% 9.68% 9.78% 9.17%
Percent Change v Previous Year -3.6% 57.5% 67.6% 48.5% 104.6% 88.1% 66.6% 77.1%
Large Business Fleet, Daily Rental, Commer. 217,264 231,633 279,837 250,431 257,491 283,729 257,525 351,656
Share Large Business of Total Sales 23.80% 20.16% 19.93% 21.15% 19.30% 22.08% 22.33% 27.36%
Percent Change v Previous Year 71.0% 45.5% 26.1% 19.8% 53.5% 81.5% 60.4% 110.2%
40.00%
47.50%
55.00%
62.50%
70.00%
Share Retail
August
58.96%
Fleet orders showed a staggering increasing vs. year ago,
one that causes a bit of head-scratching and generates a lot of
questions. For example, the 84 percent increase in
government fleet orders and purchases is dramatically high
compared to previous months causing some speculation that it
is politically motivated to help automakers continue a positive
sales run.
Retail share of total sales fell again in August to under 60
percent reinforcing the 110 percent gain by large business
fleets.
Page 8… CNW Research: Retail Automotive Summary September 2012
Mobile Part 4: In Auto Market, What are They Using Mobile to Find Out?
In the Purchase Process, consumers cycle through a series of
stages in search of the right vehicle for individual driving needs. And
a growing percentage of those new-car shoppers are using mobile
devices to collect the appropriate information at the appropriate time.
A quick overview of the process:
When first considering a new-vehicle acquisition, a consumer
looks at his/her personal and family needs. Seating for six, towing a
boat, long distance vacations by car, for example. That example
would obviously eliminate many segments (e.g. mini-pickups,
sportscars).
The typical shopper then looks at the market segments and
models that meet those needs. This could well include minivans,
small or large SUVs, crossovers.
In the third stage of the Purchase Process, shopper will shuffle
through the various models found in the previous stage then look at
styling and personal considerations. For example, many will scratch
My needs Models
available
Styling Features Price
61.62%
68.15%
27.61% 28.34%
73.94%
Use Mobile
minivans from the list because of the soccer mom stigma while
others will drop large SUVs because of the fuel-hog image.
The net result is a shopper with four to six specific vehicles on
the list before moving on to compare the features each of those
models have. This could include, in our example, a tow package,
rear-view camera, easy installation of electric brake systems, high
enough horsepower to tow a large boat, etc.
As with the third stage, the fourth results in fewer vehicles on
the list – typically no more than three – which are then price
shopped online and directly at dealerships.
Mobile’s Involvement
In CNW’s mobile studies, as the chart at the left shows,
mobile’s highest use is to compare prices among the “finalists” in
the shopping process. But that’s not the only area mobile has a
strong presence.
When consumers are looking to define their “needs,” 62
percent use a mobile device to research potential vehicles
meeting those needs or driving habits.
An even larger percentage of new-car shoppers use a mobile
device to search out models that meet those driving requirements.
When asked if this is done in a single sitting or over multiple days,
the vast majority – 88 percent – reported tapping into their mobile
device “as time permitted.” Translation: Looking at a model or two
over lunch or during a work break or while sitting in traffic. This is
distinctly different from what CNW has seen with computer usage.
Shoppers tend to do a large amount of research in a single
session while mobile users spread the research out.
When comparing styling and features, however, the small
screen is a hindrance and mobile use diminishes only to increase
again at the end of the Purchase Funnel when Price is the key
information requirement.
Toyota Motor Sales USA certainly seems to
be rocking and rolling again, after several years
in the barrel.
The bleak years, lest we forget, were marked
by massive recalls, embarrassing Congressional
hearings, federal fines, red ink, then
compounded by last year's earthquake and
tsunami in Japan.
But Toyota, Scion & Lexus are back in favor
with Americans. The automaker reported selling
1.399 million Toyotas and Scions in the first 8
months of 2012 vs. just 1.07 million a year ago.
Lexus “Split World,” click here.
Jean Halliday’s
Page 9… CNW Research: Retail Automotive Summary September 2012
Lexus sales are up nearly 25% in the same period to 150,604 units.
Still, let's compare that to the first 8 months of 2007, when the OEM said it sold 1.569 million Toyotas and Scions, plus 220,000 from
Lexus. In perspective, the whole industry has been in a funk in this country for several years. These days Toyota Motor is motoring right
along.
In general, the automaker's advertising hasn't been much to crow about. Over the years, Toyota's three brands have sold lots of new
vehicles IN SPITE of their so-so advertising. But there's a couple of bright spots of late.
Let's start with Lexus, which for the most part has used some of the
Lexus “Future Unfolded,” click here.
most mind-numbing ads in the luxury car segment pretty much since the new century
started. Such a shame for a brand that once had some of the industry's most
memorable ads, such as the champagne glasses balanced on the hood.
Some Hits, Some Misses at Toyota
‘Split World’ from Team One Gets a ‘Bravo’;
‘Future Unfolded’ Not so Much
For the launch of the new 2013 ES and first ES Hybrid comes this gem, called “Split World.” Bravo! This commercial from Team
One is one of the best from Lexus in a long time. It's visually arresting, almost forcing you to watch. The montages portray
modernism, cool technology and luxury. And the premise actually makes sense: “Introducing a reason to look twice.” It's not loaded
with a bunch of mumbo-jumbo talk or list of features, which most people just go online to find out about anyway.
But Lexus isn't out of the woods yet. How could the brand get it so right with that spot and so wrong with another ES launch
commercial? Check out “Future Unfolded.” (Previous page.)
Page 10… CNW Research: Retail Automotive Summary September 2012
Where are the ‘Old’ People?
Lexus said this is one of 3 spots targeted at African-American, Hispanic and LGBT audiences. It's amazing how different the two spots
are. This one is just lame. It tries too hard to be cool and young- two words not readily associated with Lexus.
Why are all those young folks in the ES and dancing around it? They are no where near in age to the actual Lexus owner base. You can't
fool people about this either. One sharp YouTuber commented “That's funny....I didn't see any old people” in that ad.
One place the Lexus ES won't be taking these hip people is to a night club.
The writing is forced, especially this line from the narrator, actor Jim Remar, “with technology and style to match your achievements and
desires.” That's quite lofty and presumptuous of Lexus to think it knows what peoples' desires are. Those words are just wasting time and
space in the ad.
Lexus is taking a page from cousin Scion with a social media push reaching out to start-up innovators and the chance for four of them
to each get $100,000 in seed money for their products. Voting will take place on a custom Facebook app. The ES also becomes the first
auto brand with a brand magazine on mobile Flipboard. This is a smarter way to reach a younger audience.
OK. Let's move onto the Toyota brand.
It's been a while since Toyota has done any meaningful national advertising for its full-size Tundra pickup. Back in 2007, Toyota spent
more than $100 million to launch the then-redone, more competitive Tundra in hopes of selling 200,000 of them that year. That was
Toyota's biggest-ever launch.
But Tundra still takes a back seat to Detroit's truck iron, selling only 65,600 Tundra's in the first 9 months of 2012.
Now Toyota is beating the drums again for the pickup, starting a multi-media push this month about how the Tundra will tow “an
American icon live before the whole world” on Oct. 13. Yup, the Tundra will haul the space shuttle Endeavour for the last leg of its trip
from Los Angeles International Airport
The Tundra Endeavour, click here.
on city streets to the California Science Center. It's a big deal since a stock, 1/2-ton, 2012
Tundra CrewMax will be used to tow the 145-ton shuttle.Toyota's ad agency, Saatchi & Saatchi
Los Angeles, handled the deal with the Science Center to show off the Tundra's towing
toughness.
Here's the promo, just one of lots of videos coming for the effort Toyota is encouraging
people to follow the Tundra's adventure online at www.toyota.com/TundraEndeavour. People
can sign up for email updates and Toyota will donate $50 to the science center for every Tweet
on Twitter about the tow.
There's just one little detail that's almost glossed over in Toyota's hype about this feat. The pickup is only going to tow the space shuttle the last
quarter mile of its 12-mile trip leg to the Science Center!!!
Doesn't all this hoopla seem a bit too much for that?
Meanwhile, the Toyota brand just announced it is dropping its “Moving Forward” ad tag that's been used since 2004. That's great news! That
line was a nothing but a corporate-driven theme from on high that really had little to do with the brand. It's generic and could have been used for
lots of other car brands.
I'll bet 9 out of 10 Americans couldn't identify it as Toyota's ad tag- even after 8 years and millions of dollars of advertising. Back in 2004,
Toyota exec Jim Lentz admitted that the brand's “Oh, what a feeling” tag, which showed owners jumping for joy, had the most consumer
awareness at the time, which makes you wonder why they dropped it. Toyota used that line from 1980 through '86.
Toyota's new line, “Let's Go Places,” will bow late this year.
New Tag Missing Something
Ugh oh. Also sounds very generic and interchangeable with other car brands. Hey, it could be used for an airline or online travel site.
Toyota Division's Bill Fay, group VP-general manager, gave this explanation, saying the new tag “speaks to the evolution of Toyota and our
commitment to leading through innovation, enriching lives and connecting with customers in new ways they define.” He called the tag “energetic,
aspirational, inclusive and very versatile. The phrase conveys a dual meaning of physically going places and taking off on an adventure, while
also expressing optimism and the promise of exciting innovation that enriches people’s lives.” Okay then. Rationalize it any way you want.
It would be better to have NO tag than to use one that isn't tied directly to one brand and one brand only.
Page 11… CNW Research: Retail Automotive Summary September 2012
But here's something Toyota IS doing right. It has taken owner
testimonial ads to a new level with its new Camry Effect blitz that
includes this web site at http://toyota.com/camryeffect.
Smart Site Sets the Industry Bar
Billed as “real Owners. Real Stories,” the site is loaded with
tons of great input from actual owners. The site has interesting
factoids, like 79% of Camry owners know how to change a tire
and 82% prefer an automatic.
Toyota is pushing the site via TV ads like this one from
Camry owner Ja Ne't Rommero Testimonial ads are nothing
new in car advertising, but THIS is smart advertising and sets
the bar for the industry.
Toyota Camry: Ja Ne’t Rommero’s Story, click here
This time of year always generates significant sales of smaller, less expensive vehicles as high school and college students and
their parents enter the market looking for cars and trucks that provide reliable transportation. While most go into the used-car
market, those lucky enough to come away with a new vehicle usually gravitate toward the lower end of the spectrum.
That’s what happened in August. Budget cars had a slight uptick as did Economy cars, neither hitting their share-of-sales high
water mark but clearly on the rise.
Electric cars saw an increase in August, but mostly because of fleet not consumer purchases.
The full-size pickup market is healthy again. For the fourth month in a row, this segment took a larger share of sales than the
previous month and hit the highest share of sales of 2012 in August at 11.6 percent. Small businesses were the driving force here as
they continue to see improvements in construction trades requiring pickup trucks as the key means of transportation.
Page12... CNW Research: Retail Automotive Summary September 2012
12.09%
11.40%
11.87%
11.31%
11.78%
12.21%
12.48%
Entry Level Utility Vehicle
2.09% 2.13%
1.96% 1.93%
1.70%
1.54% 1.68%
1.81%
Budget Car
12.54%
13.45%
13.81%
12.34%12.41%
12.13%
12.24%
12.87%
Economy Car
0.14% 0.13%
0.21%
0.16%
0.17% 0.18% 0.20%
0.28%
Electric Car
Back to School Smaller Vehicles Take the Prize; Small-Business Pickups Best of ‘12
89.7% of Sales
Incentivized
Of the vehicles sold in
August, nearly 90 percent
carried an incentive. That’s
the highest percentage of
2012 and the highest since
July of 2005.
While the industry has
gotten significantly better at
targeting incentive dollars
both by model and market,
the need to offer some form
of dealer or consumer “spiff”
has grown with the ability of
shoppers to research both
MSRPs and discounts.
As a share of total
incentive dollars, Detroit was
responsible for 45 percent;
Asian 54 percent; European
1 percent. (See Doc 121m.)
Page 13… CNW Research: Retail Automotive Summary September 2012
10.90%
10.56%10.37%
10.19%
10.46%10.58%
10.78%
11.63%
Full Size Pickup
1.56% 1.71% 1.68%
1.99%2.05% 2.05% 2.08%
1.66%
Full Size Van
1.32% 1.35% 1.38% 1.33% 1.46% 1.52%
1.67%
1.21%
Luxury Car
10.78%11.04%11.43%11.87%12.44%11.96%
10.76%10.14%
Lower Midrange
8.51%
8.20%
7.99% 8.20%
8.34%
8.28%
8.77%
8.53%
Lower Mid Range Utility Vehicle
1.62%
1.46%
1.33%
1.49%
1.66% 1.74% 1.79%
1.38%
Large Utility Vehicle
3.70% 3.52% 3.35% 3.35%
3.06%
3.51%
3.80% 3.71%
Page 14… CNW Research: Retail Automotive Summary September 2012
Near Luxury Car
0.24%
0.20% 0.21%
0.24%
0.29%
0.21% 0.23%
0.26%
Midi-Van
2.32% 2.27%
1.98% 2.17%
2.66% 2.70%
2.35% 2.34%
Mid Range Utility-Vehicle
3.47%
3.86% 3.85% 4.01% 4.14%
3.72% 3.78%
4.28%
Minivan
0.37%
0.28% 0.30%0.29% 0.31% 0.26%
0.37%
0.24%
Premium Car
4.39% 4.64%
4.24%
4.63%
4.05%
4.52%
3.93% 3.76%
Premium Mid-Range Car
Noteworthy:
Another sign that there
is life in the small business
community is the improved
share-of-sales for Midi-
Vans such as the Ford
Transit Connect.
As CNW pointed out a
year ago, the Transit
Connect has a strong
consumer following with
sales for non-business
purposes running at 12 to
20 percent, depending on
region.
Page 15… CNW Research: Retail Automotive Summary September 2012
0.25% 0.25%
0.31%
0.34%
0.27%
0.34% 0.33% 0.33%
Premium Sporty Car
3.24%
2.73%
2.50%
2.76% 2.72% 2.74% 2.72% 2.78%
Premium Utility Vehicle
12.56%12.42%
12.87%
12.43%
11.54%
11.21%
11.85%
12.71%
Standard Mid Range Car
2.54%
2.23% 2.07% 1.91% 1.91% 1.93% 2.02% 1.86%
Small Pickup
0.19%
0.17% 0.16%
0.15% 0.17%
0.14%
0.17%
0.19%
Sport Utility Pickup
1.75%
2.07% 2.19%
2.43% 2.39%
2.64%
2.28%
1.94%
Touring Car
Noteworthy:
Toyota and Honda
rebound is showing up as a
share of Standard Mid-
Range Car data. This
segment (far left) had its
best share-of-sales month
of since March, second
best of the year.
Page 16… CNW Research: Retail Automotive Summary September 2012
0.07%
0.05%
0.03% 0.03%
0.02% 0.02% 0.02%
0.01%
Traditional Car
0.02%
0.01%
0.02%
0.02%
0.02%
0.02%
0.02%
0.01%
Ultra Upscale Car
0.05%
0.04% 0.04%
0.05%
0.04% 0.04% 0.05%
0.04%
Ultra Luxury Sporty Car
1.61% 1.54%
1.37%
1.81% 1.90% 1.88% 1.79%
1.97%
Upper Mid-Range Utility
0.04%
0.05%
0.02%
0.04%
0.06%
0.05%
0.03%
0.05%
Ultra-Premium Utility Vehicle
0.17% 0.16%
0.12%
0.18% 0.19%
0.16%
0.19%
0.15%
Upper Premium Sporty Car
Noteworthy:
The Traditional Car
segment continues to
decline as brands drop
their historic models such
as the Crown Victoria and
Mercury Marque.
Page 17… CNW Research: Retail Automotive Summary September 2012
Back Page
*Deliveries not sales Sept 1-15 Sept 1-15 % Chng Actual Sales Sept '12 Full Mo
cy2012 cy2011 12 v 11 Sept '11 Sales Change
New Cars Extension
Detroit 3 129,462 119,582 8.3% 149,373 161,714 8.3%
Asian 156,904 131,646 19.2% 273,010 325,391 19.2%
European 29,573 28,629 3.3% 73,993 76,433 3.3%
Ttl Pass. Cars 315,939 279,857 12.9% 496,376 563,538 13.5%
New Trucks
Detroit 3 182,819 168,432 8.5% 357,193 387,703 8.5%
Asian 51,376 43,628 17.8% 172,881 203,583 17.8%
European 5,771 5,582 3.4% 26,860 27,769 3.4%
Ttl Lt. Trucks 239,966 217,642 10.3% 556,934 619,056 11.2%
Ttl Industry 555,905 497,499 11.7% 1,053,310 1,182,594 12.3%
Sept 1-15 Full Sept % Chng Prev Mo Prev Mo % Chng
cy2012 cy2011 12 v 11 cy2012 cy2011 12 v 11
Lease Share 27.9% 25.7% 8.6% 27.9% 25.3% 10.3%
Floor Traffic - New 76.92 63.65 20.8% 76.25 64.53 18.2%
Floor Traffic - Used 86.45 76.84 12.5% 86.22 77.42 11.4%
Sept 1-15 Prev Yr % Chng % Chng Pent Up Demand Units
cy2012 Full Sept Same Mo '11 Prev Mo Aug '12 96,700
Avg. New MSRP $37,224 $34,708 7.25% 0.18% Aug '11 182,250
Total Discounts $4,981 $4,956 0.50% 0.11% % Change -46.9%
Manufacturer Incentives $3,642 $3,367 8.17% 0.22%
Dealer Incentives $1,339 $1,589 -15.73% -0.19% Purchase Delay Months
Core Transaction Price**** $32,243 $29,752 8.37% 0.19% Aug '12 3.47
% Mfg Incentive of MSRP 9.78% 9.70% 0.9% Aug '11 4.8
% Ttl Discounts of MSRP 13.38% 14.28% -6.3% % Change -27.7%

Más contenido relacionado

La actualidad más candente

Cox Automotive Market Insight Overview March 2019
Cox Automotive Market Insight Overview   March 2019Cox Automotive Market Insight Overview   March 2019
Cox Automotive Market Insight Overview March 2019Philip Nothard
 
BDO Breakout Session: 2014 Texas A&M Retailing Summit
BDO Breakout Session: 2014 Texas A&M Retailing Summit BDO Breakout Session: 2014 Texas A&M Retailing Summit
BDO Breakout Session: 2014 Texas A&M Retailing Summit Gordon Porter
 
Mergermarket M&A Energy, Mining & Utilities Trend Report 2015
Mergermarket M&A Energy, Mining & Utilities Trend Report 2015Mergermarket M&A Energy, Mining & Utilities Trend Report 2015
Mergermarket M&A Energy, Mining & Utilities Trend Report 2015Marcellus Drilling News
 
Cox Automotive Market Insight Overview April 2019
Cox Automotive Market Insight Overview   April 2019 Cox Automotive Market Insight Overview   April 2019
Cox Automotive Market Insight Overview April 2019 Philip Nothard
 
Lending To Automobile Dealers Credit Risk Issues
Lending To Automobile Dealers   Credit Risk IssuesLending To Automobile Dealers   Credit Risk Issues
Lending To Automobile Dealers Credit Risk Issueserikday
 
Retail apocolypse and pension fund culpability
Retail apocolypse and pension fund culpabilityRetail apocolypse and pension fund culpability
Retail apocolypse and pension fund culpabilitythomas paulson
 
Thor investor presentation 3.6.14 final
Thor investor presentation 3.6.14   finalThor investor presentation 3.6.14   final
Thor investor presentation 3.6.14 finalThor_Industries
 
Third Quarter 2015 Investor Presentation
Third Quarter 2015 Investor PresentationThird Quarter 2015 Investor Presentation
Third Quarter 2015 Investor PresentationThor_Industries
 
Food & Beverage Industry Snapshot
Food & Beverage Industry SnapshotFood & Beverage Industry Snapshot
Food & Beverage Industry SnapshotGrant Thornton
 
Cox Automotive Market Insight Overview June & H1 2019
Cox Automotive Market Insight Overview   June & H1 2019Cox Automotive Market Insight Overview   June & H1 2019
Cox Automotive Market Insight Overview June & H1 2019Philip Nothard
 
April MarketMonitor
April MarketMonitor April MarketMonitor
April MarketMonitor jspeltz
 
Sewells MSXI Automotive Dealer Confidence Index (Jul to Sep 2016 Quarter)
Sewells MSXI Automotive Dealer Confidence Index (Jul to Sep 2016 Quarter)Sewells MSXI Automotive Dealer Confidence Index (Jul to Sep 2016 Quarter)
Sewells MSXI Automotive Dealer Confidence Index (Jul to Sep 2016 Quarter)Sewells MSXI
 
Retailing in vietnam 2016
Retailing in vietnam 2016Retailing in vietnam 2016
Retailing in vietnam 2016Tuan Le
 
Atradius Market Monitor (Crédito y Caución) - abril 2015
Atradius Market Monitor (Crédito y Caución) - abril 2015Atradius Market Monitor (Crédito y Caución) - abril 2015
Atradius Market Monitor (Crédito y Caución) - abril 2015Ignacio Jimenez
 
Wal Mart Store Financial ResultsOctober 11/06/08
Wal Mart Store Financial ResultsOctober 11/06/08Wal Mart Store Financial ResultsOctober 11/06/08
Wal Mart Store Financial ResultsOctober 11/06/08finance1
 
Duff Phelps Valuation Insights Q1 2017
Duff Phelps Valuation Insights Q1 2017Duff Phelps Valuation Insights Q1 2017
Duff Phelps Valuation Insights Q1 2017Duff & Phelps
 
[Kantar worldpanel] Monitor overview FMCG Market VietNamese 2016
[Kantar worldpanel] Monitor overview FMCG Market VietNamese 2016[Kantar worldpanel] Monitor overview FMCG Market VietNamese 2016
[Kantar worldpanel] Monitor overview FMCG Market VietNamese 2016Duy, Vo Hoang
 

La actualidad más candente (20)

Cox Automotive Market Insight Overview March 2019
Cox Automotive Market Insight Overview   March 2019Cox Automotive Market Insight Overview   March 2019
Cox Automotive Market Insight Overview March 2019
 
BDO Breakout Session: 2014 Texas A&M Retailing Summit
BDO Breakout Session: 2014 Texas A&M Retailing Summit BDO Breakout Session: 2014 Texas A&M Retailing Summit
BDO Breakout Session: 2014 Texas A&M Retailing Summit
 
Mergermarket M&A Energy, Mining & Utilities Trend Report 2015
Mergermarket M&A Energy, Mining & Utilities Trend Report 2015Mergermarket M&A Energy, Mining & Utilities Trend Report 2015
Mergermarket M&A Energy, Mining & Utilities Trend Report 2015
 
Cox Automotive Market Insight Overview April 2019
Cox Automotive Market Insight Overview   April 2019 Cox Automotive Market Insight Overview   April 2019
Cox Automotive Market Insight Overview April 2019
 
Lending To Automobile Dealers Credit Risk Issues
Lending To Automobile Dealers   Credit Risk IssuesLending To Automobile Dealers   Credit Risk Issues
Lending To Automobile Dealers Credit Risk Issues
 
Retail apocolypse and pension fund culpability
Retail apocolypse and pension fund culpabilityRetail apocolypse and pension fund culpability
Retail apocolypse and pension fund culpability
 
Thor investor presentation 3.6.14 final
Thor investor presentation 3.6.14   finalThor investor presentation 3.6.14   final
Thor investor presentation 3.6.14 final
 
Tung Anh Nguyen's Writing Sample 1
Tung Anh Nguyen's Writing Sample 1Tung Anh Nguyen's Writing Sample 1
Tung Anh Nguyen's Writing Sample 1
 
Corona virus latam
Corona virus latamCorona virus latam
Corona virus latam
 
Third Quarter 2015 Investor Presentation
Third Quarter 2015 Investor PresentationThird Quarter 2015 Investor Presentation
Third Quarter 2015 Investor Presentation
 
Food & Beverage Industry Snapshot
Food & Beverage Industry SnapshotFood & Beverage Industry Snapshot
Food & Beverage Industry Snapshot
 
Cox Automotive Market Insight Overview June & H1 2019
Cox Automotive Market Insight Overview   June & H1 2019Cox Automotive Market Insight Overview   June & H1 2019
Cox Automotive Market Insight Overview June & H1 2019
 
April MarketMonitor
April MarketMonitor April MarketMonitor
April MarketMonitor
 
Sewells MSXI Automotive Dealer Confidence Index (Jul to Sep 2016 Quarter)
Sewells MSXI Automotive Dealer Confidence Index (Jul to Sep 2016 Quarter)Sewells MSXI Automotive Dealer Confidence Index (Jul to Sep 2016 Quarter)
Sewells MSXI Automotive Dealer Confidence Index (Jul to Sep 2016 Quarter)
 
Retailing in vietnam 2016
Retailing in vietnam 2016Retailing in vietnam 2016
Retailing in vietnam 2016
 
Atradius Market Monitor (Crédito y Caución) - abril 2015
Atradius Market Monitor (Crédito y Caución) - abril 2015Atradius Market Monitor (Crédito y Caución) - abril 2015
Atradius Market Monitor (Crédito y Caución) - abril 2015
 
Wal Mart Store Financial ResultsOctober 11/06/08
Wal Mart Store Financial ResultsOctober 11/06/08Wal Mart Store Financial ResultsOctober 11/06/08
Wal Mart Store Financial ResultsOctober 11/06/08
 
2009 annual review
2009 annual review2009 annual review
2009 annual review
 
Duff Phelps Valuation Insights Q1 2017
Duff Phelps Valuation Insights Q1 2017Duff Phelps Valuation Insights Q1 2017
Duff Phelps Valuation Insights Q1 2017
 
[Kantar worldpanel] Monitor overview FMCG Market VietNamese 2016
[Kantar worldpanel] Monitor overview FMCG Market VietNamese 2016[Kantar worldpanel] Monitor overview FMCG Market VietNamese 2016
[Kantar worldpanel] Monitor overview FMCG Market VietNamese 2016
 

Similar a CNW US retail automotive-summary-Sept-2012

Cox Automotive Market Insight Overview September 2019
Cox Automotive Market Insight Overview   September 2019  Cox Automotive Market Insight Overview   September 2019
Cox Automotive Market Insight Overview September 2019 Philip Nothard
 
Cox Automotive Market Insight Overview December & FY 2019
Cox Automotive Market Insight Overview   December & FY 2019  Cox Automotive Market Insight Overview   December & FY 2019
Cox Automotive Market Insight Overview December & FY 2019 Philip Nothard
 
Philippine Automotive Industry Insights | AutoDeal | Q2 2018
Philippine Automotive Industry Insights | AutoDeal | Q2 2018Philippine Automotive Industry Insights | AutoDeal | Q2 2018
Philippine Automotive Industry Insights | AutoDeal | Q2 2018Christopher Franks
 
NPD Aftermarket Perspectives
NPD Aftermarket PerspectivesNPD Aftermarket Perspectives
NPD Aftermarket Perspectivesbuddhand
 
Etude PwC Autofacts production automobile (fév. 2014)
Etude PwC Autofacts production automobile (fév. 2014)Etude PwC Autofacts production automobile (fév. 2014)
Etude PwC Autofacts production automobile (fév. 2014)PwC France
 
Etude PwC marché automobile mondial (2013)
Etude PwC marché automobile mondial (2013)Etude PwC marché automobile mondial (2013)
Etude PwC marché automobile mondial (2013)PwC France
 
strategicmanagementinBangladesh.pdf
strategicmanagementinBangladesh.pdfstrategicmanagementinBangladesh.pdf
strategicmanagementinBangladesh.pdfvippn1
 
NADA Incentive Analysis
NADA Incentive AnalysisNADA Incentive Analysis
NADA Incentive AnalysisCounselorauto
 
Cox Automotive Market Overview - November 2018
Cox Automotive   Market Overview - November 2018Cox Automotive   Market Overview - November 2018
Cox Automotive Market Overview - November 2018Philip Nothard
 
Cox Automotive Market Insight Overview February 2019
Cox Automotive Market Insight Overview   February 2019Cox Automotive Market Insight Overview   February 2019
Cox Automotive Market Insight Overview February 2019Philip Nothard
 
Lending To Automobile Dealers Credit Risk Issues
Lending To Automobile Dealers   Credit Risk IssuesLending To Automobile Dealers   Credit Risk Issues
Lending To Automobile Dealers Credit Risk Issueserikday
 
Monthly Market Report - May 2013
Monthly Market Report - May 2013Monthly Market Report - May 2013
Monthly Market Report - May 2013Global_Automakers
 
Rhiza Ratio - Super Bowl Car Ads
Rhiza Ratio - Super Bowl Car AdsRhiza Ratio - Super Bowl Car Ads
Rhiza Ratio - Super Bowl Car AdsRhizaLabs
 
Philippine Automotive Industry Insights | AutoDeal | Q3 2018
Philippine Automotive Industry Insights | AutoDeal | Q3 2018 Philippine Automotive Industry Insights | AutoDeal | Q3 2018
Philippine Automotive Industry Insights | AutoDeal | Q3 2018 Christopher Franks
 
Used Vehicle Premiums
Used Vehicle PremiumsUsed Vehicle Premiums
Used Vehicle PremiumsCounselorauto
 
The Boulder Group | Q3 2014 Net Lease Research Report2014 q3-net-lease-resear...
The Boulder Group | Q3 2014 Net Lease Research Report2014 q3-net-lease-resear...The Boulder Group | Q3 2014 Net Lease Research Report2014 q3-net-lease-resear...
The Boulder Group | Q3 2014 Net Lease Research Report2014 q3-net-lease-resear...The Boulder Group
 
Automotive Industry Insights - Summer 2018
Automotive Industry Insights - Summer 2018Automotive Industry Insights - Summer 2018
Automotive Industry Insights - Summer 2018Duff & Phelps
 
Booz co: 2012-us-automotive-industry-survey-and-confidence-index
Booz co: 2012-us-automotive-industry-survey-and-confidence-indexBooz co: 2012-us-automotive-industry-survey-and-confidence-index
Booz co: 2012-us-automotive-industry-survey-and-confidence-indexBrian Crotty
 
Nielsen Quarterly Retail Updates Q3 2013
Nielsen Quarterly Retail Updates Q3 2013Nielsen Quarterly Retail Updates Q3 2013
Nielsen Quarterly Retail Updates Q3 2013Thien Huong Nguyen
 
4Q_2015_RetailReport_email
4Q_2015_RetailReport_email4Q_2015_RetailReport_email
4Q_2015_RetailReport_emailPatrick Anthon
 

Similar a CNW US retail automotive-summary-Sept-2012 (20)

Cox Automotive Market Insight Overview September 2019
Cox Automotive Market Insight Overview   September 2019  Cox Automotive Market Insight Overview   September 2019
Cox Automotive Market Insight Overview September 2019
 
Cox Automotive Market Insight Overview December & FY 2019
Cox Automotive Market Insight Overview   December & FY 2019  Cox Automotive Market Insight Overview   December & FY 2019
Cox Automotive Market Insight Overview December & FY 2019
 
Philippine Automotive Industry Insights | AutoDeal | Q2 2018
Philippine Automotive Industry Insights | AutoDeal | Q2 2018Philippine Automotive Industry Insights | AutoDeal | Q2 2018
Philippine Automotive Industry Insights | AutoDeal | Q2 2018
 
NPD Aftermarket Perspectives
NPD Aftermarket PerspectivesNPD Aftermarket Perspectives
NPD Aftermarket Perspectives
 
Etude PwC Autofacts production automobile (fév. 2014)
Etude PwC Autofacts production automobile (fév. 2014)Etude PwC Autofacts production automobile (fév. 2014)
Etude PwC Autofacts production automobile (fév. 2014)
 
Etude PwC marché automobile mondial (2013)
Etude PwC marché automobile mondial (2013)Etude PwC marché automobile mondial (2013)
Etude PwC marché automobile mondial (2013)
 
strategicmanagementinBangladesh.pdf
strategicmanagementinBangladesh.pdfstrategicmanagementinBangladesh.pdf
strategicmanagementinBangladesh.pdf
 
NADA Incentive Analysis
NADA Incentive AnalysisNADA Incentive Analysis
NADA Incentive Analysis
 
Cox Automotive Market Overview - November 2018
Cox Automotive   Market Overview - November 2018Cox Automotive   Market Overview - November 2018
Cox Automotive Market Overview - November 2018
 
Cox Automotive Market Insight Overview February 2019
Cox Automotive Market Insight Overview   February 2019Cox Automotive Market Insight Overview   February 2019
Cox Automotive Market Insight Overview February 2019
 
Lending To Automobile Dealers Credit Risk Issues
Lending To Automobile Dealers   Credit Risk IssuesLending To Automobile Dealers   Credit Risk Issues
Lending To Automobile Dealers Credit Risk Issues
 
Monthly Market Report - May 2013
Monthly Market Report - May 2013Monthly Market Report - May 2013
Monthly Market Report - May 2013
 
Rhiza Ratio - Super Bowl Car Ads
Rhiza Ratio - Super Bowl Car AdsRhiza Ratio - Super Bowl Car Ads
Rhiza Ratio - Super Bowl Car Ads
 
Philippine Automotive Industry Insights | AutoDeal | Q3 2018
Philippine Automotive Industry Insights | AutoDeal | Q3 2018 Philippine Automotive Industry Insights | AutoDeal | Q3 2018
Philippine Automotive Industry Insights | AutoDeal | Q3 2018
 
Used Vehicle Premiums
Used Vehicle PremiumsUsed Vehicle Premiums
Used Vehicle Premiums
 
The Boulder Group | Q3 2014 Net Lease Research Report2014 q3-net-lease-resear...
The Boulder Group | Q3 2014 Net Lease Research Report2014 q3-net-lease-resear...The Boulder Group | Q3 2014 Net Lease Research Report2014 q3-net-lease-resear...
The Boulder Group | Q3 2014 Net Lease Research Report2014 q3-net-lease-resear...
 
Automotive Industry Insights - Summer 2018
Automotive Industry Insights - Summer 2018Automotive Industry Insights - Summer 2018
Automotive Industry Insights - Summer 2018
 
Booz co: 2012-us-automotive-industry-survey-and-confidence-index
Booz co: 2012-us-automotive-industry-survey-and-confidence-indexBooz co: 2012-us-automotive-industry-survey-and-confidence-index
Booz co: 2012-us-automotive-industry-survey-and-confidence-index
 
Nielsen Quarterly Retail Updates Q3 2013
Nielsen Quarterly Retail Updates Q3 2013Nielsen Quarterly Retail Updates Q3 2013
Nielsen Quarterly Retail Updates Q3 2013
 
4Q_2015_RetailReport_email
4Q_2015_RetailReport_email4Q_2015_RetailReport_email
4Q_2015_RetailReport_email
 

Más de Brian Crotty

ANA programmatic-financial-fog 22-5-17
ANA programmatic-financial-fog 22-5-17ANA programmatic-financial-fog 22-5-17
ANA programmatic-financial-fog 22-5-17Brian Crotty
 
Babelfish articles oct 16 mar 17 28-3-17 redux
Babelfish articles oct 16 mar 17 28-3-17 reduxBabelfish articles oct 16 mar 17 28-3-17 redux
Babelfish articles oct 16 mar 17 28-3-17 reduxBrian Crotty
 
Ebit - Buscape- #34 webshoppers english 2016
Ebit - Buscape- #34 webshoppers english 2016Ebit - Buscape- #34 webshoppers english 2016
Ebit - Buscape- #34 webshoppers english 2016Brian Crotty
 
MMA global mobile trends report 2016
MMA global mobile trends report 2016MMA global mobile trends report 2016
MMA global mobile trends report 2016Brian Crotty
 
Winterberry group the state of consumer data onboarding november 2016
Winterberry group   the state of consumer data onboarding november 2016Winterberry group   the state of consumer data onboarding november 2016
Winterberry group the state of consumer data onboarding november 2016Brian Crotty
 
Delloite tech trends 2016
Delloite  tech trends 2016Delloite  tech trends 2016
Delloite tech trends 2016Brian Crotty
 
MEC CES 2017-key-takeaways-and-trends-final
MEC CES 2017-key-takeaways-and-trends-finalMEC CES 2017-key-takeaways-and-trends-final
MEC CES 2017-key-takeaways-and-trends-finalBrian Crotty
 
Mindshare trends 2017
Mindshare trends 2017Mindshare trends 2017
Mindshare trends 2017Brian Crotty
 
Kantar-millward-brown Media and-digital-predictions 2017
Kantar-millward-brown Media and-digital-predictions 2017Kantar-millward-brown Media and-digital-predictions 2017
Kantar-millward-brown Media and-digital-predictions 2017Brian Crotty
 
Edelman-digital trends 2017
Edelman-digital trends 2017Edelman-digital trends 2017
Edelman-digital trends 2017Brian Crotty
 
Carats top 10 trends 2016
Carats top 10 trends 2016Carats top 10 trends 2016
Carats top 10 trends 2016Brian Crotty
 
Babelfish Articles Jan-Sep 2016 12-09-16 final
Babelfish Articles Jan-Sep 2016  12-09-16 finalBabelfish Articles Jan-Sep 2016  12-09-16 final
Babelfish Articles Jan-Sep 2016 12-09-16 finalBrian Crotty
 
Comscore Global+future+in+focus por2
Comscore Global+future+in+focus por2Comscore Global+future+in+focus por2
Comscore Global+future+in+focus por2Brian Crotty
 
eBit Web shoppers 32a edição
eBit Web shoppers 32a ediçãoeBit Web shoppers 32a edição
eBit Web shoppers 32a ediçãoBrian Crotty
 
JWT The future-100-­-trends-and-change-to-watch-in-2016
JWT The future-100-­-trends-and-change-to-watch-in-2016JWT The future-100-­-trends-and-change-to-watch-in-2016
JWT The future-100-­-trends-and-change-to-watch-in-2016Brian Crotty
 
Babelfish Articles July-Dec 2015 10-12-15
Babelfish Articles July-Dec 2015 10-12-15Babelfish Articles July-Dec 2015 10-12-15
Babelfish Articles July-Dec 2015 10-12-15Brian Crotty
 
Babelfish Articles #12 Jan-June 2015
Babelfish Articles #12 Jan-June 2015Babelfish Articles #12 Jan-June 2015
Babelfish Articles #12 Jan-June 2015Brian Crotty
 
Nielsen / IAB - Digital video-and-tv-advertising-viewing-budget-share-shift-a...
Nielsen / IAB - Digital video-and-tv-advertising-viewing-budget-share-shift-a...Nielsen / IAB - Digital video-and-tv-advertising-viewing-budget-share-shift-a...
Nielsen / IAB - Digital video-and-tv-advertising-viewing-budget-share-shift-a...Brian Crotty
 
Winterberry & USA IAB - Marketing data white paper Jan 2015
Winterberry & USA IAB - Marketing data white paper Jan 2015Winterberry & USA IAB - Marketing data white paper Jan 2015
Winterberry & USA IAB - Marketing data white paper Jan 2015Brian Crotty
 

Más de Brian Crotty (20)

ANA programmatic-financial-fog 22-5-17
ANA programmatic-financial-fog 22-5-17ANA programmatic-financial-fog 22-5-17
ANA programmatic-financial-fog 22-5-17
 
Babelfish articles oct 16 mar 17 28-3-17 redux
Babelfish articles oct 16 mar 17 28-3-17 reduxBabelfish articles oct 16 mar 17 28-3-17 redux
Babelfish articles oct 16 mar 17 28-3-17 redux
 
Ebit - Buscape- #34 webshoppers english 2016
Ebit - Buscape- #34 webshoppers english 2016Ebit - Buscape- #34 webshoppers english 2016
Ebit - Buscape- #34 webshoppers english 2016
 
MMA global mobile trends report 2016
MMA global mobile trends report 2016MMA global mobile trends report 2016
MMA global mobile trends report 2016
 
Fjord trends 2017
Fjord trends 2017Fjord trends 2017
Fjord trends 2017
 
Winterberry group the state of consumer data onboarding november 2016
Winterberry group   the state of consumer data onboarding november 2016Winterberry group   the state of consumer data onboarding november 2016
Winterberry group the state of consumer data onboarding november 2016
 
Delloite tech trends 2016
Delloite  tech trends 2016Delloite  tech trends 2016
Delloite tech trends 2016
 
MEC CES 2017-key-takeaways-and-trends-final
MEC CES 2017-key-takeaways-and-trends-finalMEC CES 2017-key-takeaways-and-trends-final
MEC CES 2017-key-takeaways-and-trends-final
 
Mindshare trends 2017
Mindshare trends 2017Mindshare trends 2017
Mindshare trends 2017
 
Kantar-millward-brown Media and-digital-predictions 2017
Kantar-millward-brown Media and-digital-predictions 2017Kantar-millward-brown Media and-digital-predictions 2017
Kantar-millward-brown Media and-digital-predictions 2017
 
Edelman-digital trends 2017
Edelman-digital trends 2017Edelman-digital trends 2017
Edelman-digital trends 2017
 
Carats top 10 trends 2016
Carats top 10 trends 2016Carats top 10 trends 2016
Carats top 10 trends 2016
 
Babelfish Articles Jan-Sep 2016 12-09-16 final
Babelfish Articles Jan-Sep 2016  12-09-16 finalBabelfish Articles Jan-Sep 2016  12-09-16 final
Babelfish Articles Jan-Sep 2016 12-09-16 final
 
Comscore Global+future+in+focus por2
Comscore Global+future+in+focus por2Comscore Global+future+in+focus por2
Comscore Global+future+in+focus por2
 
eBit Web shoppers 32a edição
eBit Web shoppers 32a ediçãoeBit Web shoppers 32a edição
eBit Web shoppers 32a edição
 
JWT The future-100-­-trends-and-change-to-watch-in-2016
JWT The future-100-­-trends-and-change-to-watch-in-2016JWT The future-100-­-trends-and-change-to-watch-in-2016
JWT The future-100-­-trends-and-change-to-watch-in-2016
 
Babelfish Articles July-Dec 2015 10-12-15
Babelfish Articles July-Dec 2015 10-12-15Babelfish Articles July-Dec 2015 10-12-15
Babelfish Articles July-Dec 2015 10-12-15
 
Babelfish Articles #12 Jan-June 2015
Babelfish Articles #12 Jan-June 2015Babelfish Articles #12 Jan-June 2015
Babelfish Articles #12 Jan-June 2015
 
Nielsen / IAB - Digital video-and-tv-advertising-viewing-budget-share-shift-a...
Nielsen / IAB - Digital video-and-tv-advertising-viewing-budget-share-shift-a...Nielsen / IAB - Digital video-and-tv-advertising-viewing-budget-share-shift-a...
Nielsen / IAB - Digital video-and-tv-advertising-viewing-budget-share-shift-a...
 
Winterberry & USA IAB - Marketing data white paper Jan 2015
Winterberry & USA IAB - Marketing data white paper Jan 2015Winterberry & USA IAB - Marketing data white paper Jan 2015
Winterberry & USA IAB - Marketing data white paper Jan 2015
 

Último

Market Sizes Sample Report - 2024 Edition
Market Sizes Sample Report - 2024 EditionMarket Sizes Sample Report - 2024 Edition
Market Sizes Sample Report - 2024 EditionMintel Group
 
Cybersecurity Awareness Training Presentation v2024.03
Cybersecurity Awareness Training Presentation v2024.03Cybersecurity Awareness Training Presentation v2024.03
Cybersecurity Awareness Training Presentation v2024.03DallasHaselhorst
 
Intro to BCG's Carbon Emissions Benchmark_vF.pdf
Intro to BCG's Carbon Emissions Benchmark_vF.pdfIntro to BCG's Carbon Emissions Benchmark_vF.pdf
Intro to BCG's Carbon Emissions Benchmark_vF.pdfpollardmorgan
 
MAHA Global and IPR: Do Actions Speak Louder Than Words?
MAHA Global and IPR: Do Actions Speak Louder Than Words?MAHA Global and IPR: Do Actions Speak Louder Than Words?
MAHA Global and IPR: Do Actions Speak Louder Than Words?Olivia Kresic
 
International Business Environments and Operations 16th Global Edition test b...
International Business Environments and Operations 16th Global Edition test b...International Business Environments and Operations 16th Global Edition test b...
International Business Environments and Operations 16th Global Edition test b...ssuserf63bd7
 
FULL ENJOY Call girls in Paharganj Delhi | 8377087607
FULL ENJOY Call girls in Paharganj Delhi | 8377087607FULL ENJOY Call girls in Paharganj Delhi | 8377087607
FULL ENJOY Call girls in Paharganj Delhi | 8377087607dollysharma2066
 
India Consumer 2024 Redacted Sample Report
India Consumer 2024 Redacted Sample ReportIndia Consumer 2024 Redacted Sample Report
India Consumer 2024 Redacted Sample ReportMintel Group
 
IoT Insurance Observatory: summary 2024
IoT Insurance Observatory:  summary 2024IoT Insurance Observatory:  summary 2024
IoT Insurance Observatory: summary 2024Matteo Carbone
 
PSCC - Capability Statement Presentation
PSCC - Capability Statement PresentationPSCC - Capability Statement Presentation
PSCC - Capability Statement PresentationAnamaria Contreras
 
Digital Transformation in the PLM domain - distrib.pdf
Digital Transformation in the PLM domain - distrib.pdfDigital Transformation in the PLM domain - distrib.pdf
Digital Transformation in the PLM domain - distrib.pdfJos Voskuil
 
Investment in The Coconut Industry by Nancy Cheruiyot
Investment in The Coconut Industry by Nancy CheruiyotInvestment in The Coconut Industry by Nancy Cheruiyot
Investment in The Coconut Industry by Nancy Cheruiyotictsugar
 
Marketplace and Quality Assurance Presentation - Vincent Chirchir
Marketplace and Quality Assurance Presentation - Vincent ChirchirMarketplace and Quality Assurance Presentation - Vincent Chirchir
Marketplace and Quality Assurance Presentation - Vincent Chirchirictsugar
 
Case study on tata clothing brand zudio in detail
Case study on tata clothing brand zudio in detailCase study on tata clothing brand zudio in detail
Case study on tata clothing brand zudio in detailAriel592675
 
8447779800, Low rate Call girls in Saket Delhi NCR
8447779800, Low rate Call girls in Saket Delhi NCR8447779800, Low rate Call girls in Saket Delhi NCR
8447779800, Low rate Call girls in Saket Delhi NCRashishs7044
 
Organizational Structure Running A Successful Business
Organizational Structure Running A Successful BusinessOrganizational Structure Running A Successful Business
Organizational Structure Running A Successful BusinessSeta Wicaksana
 
Call Us 📲8800102216📞 Call Girls In DLF City Gurgaon
Call Us 📲8800102216📞 Call Girls In DLF City GurgaonCall Us 📲8800102216📞 Call Girls In DLF City Gurgaon
Call Us 📲8800102216📞 Call Girls In DLF City Gurgaoncallgirls2057
 
Flow Your Strategy at Flight Levels Day 2024
Flow Your Strategy at Flight Levels Day 2024Flow Your Strategy at Flight Levels Day 2024
Flow Your Strategy at Flight Levels Day 2024Kirill Klimov
 

Último (20)

Market Sizes Sample Report - 2024 Edition
Market Sizes Sample Report - 2024 EditionMarket Sizes Sample Report - 2024 Edition
Market Sizes Sample Report - 2024 Edition
 
Call Us ➥9319373153▻Call Girls In North Goa
Call Us ➥9319373153▻Call Girls In North GoaCall Us ➥9319373153▻Call Girls In North Goa
Call Us ➥9319373153▻Call Girls In North Goa
 
Cybersecurity Awareness Training Presentation v2024.03
Cybersecurity Awareness Training Presentation v2024.03Cybersecurity Awareness Training Presentation v2024.03
Cybersecurity Awareness Training Presentation v2024.03
 
Intro to BCG's Carbon Emissions Benchmark_vF.pdf
Intro to BCG's Carbon Emissions Benchmark_vF.pdfIntro to BCG's Carbon Emissions Benchmark_vF.pdf
Intro to BCG's Carbon Emissions Benchmark_vF.pdf
 
MAHA Global and IPR: Do Actions Speak Louder Than Words?
MAHA Global and IPR: Do Actions Speak Louder Than Words?MAHA Global and IPR: Do Actions Speak Louder Than Words?
MAHA Global and IPR: Do Actions Speak Louder Than Words?
 
International Business Environments and Operations 16th Global Edition test b...
International Business Environments and Operations 16th Global Edition test b...International Business Environments and Operations 16th Global Edition test b...
International Business Environments and Operations 16th Global Edition test b...
 
Japan IT Week 2024 Brochure by 47Billion (English)
Japan IT Week 2024 Brochure by 47Billion (English)Japan IT Week 2024 Brochure by 47Billion (English)
Japan IT Week 2024 Brochure by 47Billion (English)
 
FULL ENJOY Call girls in Paharganj Delhi | 8377087607
FULL ENJOY Call girls in Paharganj Delhi | 8377087607FULL ENJOY Call girls in Paharganj Delhi | 8377087607
FULL ENJOY Call girls in Paharganj Delhi | 8377087607
 
India Consumer 2024 Redacted Sample Report
India Consumer 2024 Redacted Sample ReportIndia Consumer 2024 Redacted Sample Report
India Consumer 2024 Redacted Sample Report
 
Corporate Profile 47Billion Information Technology
Corporate Profile 47Billion Information TechnologyCorporate Profile 47Billion Information Technology
Corporate Profile 47Billion Information Technology
 
IoT Insurance Observatory: summary 2024
IoT Insurance Observatory:  summary 2024IoT Insurance Observatory:  summary 2024
IoT Insurance Observatory: summary 2024
 
PSCC - Capability Statement Presentation
PSCC - Capability Statement PresentationPSCC - Capability Statement Presentation
PSCC - Capability Statement Presentation
 
Digital Transformation in the PLM domain - distrib.pdf
Digital Transformation in the PLM domain - distrib.pdfDigital Transformation in the PLM domain - distrib.pdf
Digital Transformation in the PLM domain - distrib.pdf
 
Investment in The Coconut Industry by Nancy Cheruiyot
Investment in The Coconut Industry by Nancy CheruiyotInvestment in The Coconut Industry by Nancy Cheruiyot
Investment in The Coconut Industry by Nancy Cheruiyot
 
Marketplace and Quality Assurance Presentation - Vincent Chirchir
Marketplace and Quality Assurance Presentation - Vincent ChirchirMarketplace and Quality Assurance Presentation - Vincent Chirchir
Marketplace and Quality Assurance Presentation - Vincent Chirchir
 
Case study on tata clothing brand zudio in detail
Case study on tata clothing brand zudio in detailCase study on tata clothing brand zudio in detail
Case study on tata clothing brand zudio in detail
 
8447779800, Low rate Call girls in Saket Delhi NCR
8447779800, Low rate Call girls in Saket Delhi NCR8447779800, Low rate Call girls in Saket Delhi NCR
8447779800, Low rate Call girls in Saket Delhi NCR
 
Organizational Structure Running A Successful Business
Organizational Structure Running A Successful BusinessOrganizational Structure Running A Successful Business
Organizational Structure Running A Successful Business
 
Call Us 📲8800102216📞 Call Girls In DLF City Gurgaon
Call Us 📲8800102216📞 Call Girls In DLF City GurgaonCall Us 📲8800102216📞 Call Girls In DLF City Gurgaon
Call Us 📲8800102216📞 Call Girls In DLF City Gurgaon
 
Flow Your Strategy at Flight Levels Day 2024
Flow Your Strategy at Flight Levels Day 2024Flow Your Strategy at Flight Levels Day 2024
Flow Your Strategy at Flight Levels Day 2024
 

CNW US retail automotive-summary-Sept-2012

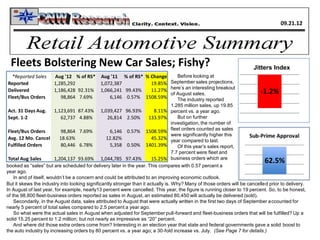
  • 1. 1.74% 62.5% Fleets Bolstering New Car Sales; Fishy? Jitters Index -1.2% *Reported Sales Aug '12 % of RS* Aug '11 % of RS* % Change Reported 1,285,292 1,072,387 19.85% Delivered 1,186,428 92.31% 1,066,241 99.43% 11.27% Fleet/Bus Orders 98,864 7.69% 6,146 0.57% 1508.59% Act. 31 Days Aug. 1,123,691 87.43% 1,039,427 96.93% 8.11% Sept. 1-2 62,737 4.88% 26,814 2.50% 133.97% Fleet/Bus Orders 98,864 7.69% 6,146 0.57% 1508.59% Avg. 12 Mo. Cancel 18.63% 12.82% 45.32% Fulfilled Orders 80,446 6.78% 5,358 0.50% 1401.39% Total Aug Sales 1,204,137 93.69% 1,044,785 97.43% 15.25% Before looking at September sales projections, here’s an interesting breakout of August sales. The industry reported 1.285 million sales, up 19.85 percent vs. a year ago. But on further investigation, the number of fleet orders counted as sales were significantly higher this year compared to last. Of this year’s sales report, 7.7 percent were fleet and business orders which are booked as “sales” but are scheduled for delivery later in the year. This compares with 0.57 percent a year ago. In and of itself, wouldn’t be a concern and could be attributed to an improving economic outlook. But it skews the industry into looking significantly stronger than it actually is. Why? Many of those orders will be cancelled prior to delivery. In August of last year, for example, nearly13 percent were cancelled. This year, the figure is running closer to 19 percent. So, to be honest, of the 98,800 fleet-business orders reported as sales in August, an estimated 80,450 will actually be delivered (sold). Secondarily, in the August data, sales attributed to August that were actually written in the first two days of September accounted for nearly 5 percent of total sales compared to 2.5 percent a year ago. So what were the actual sales in August when adjusted for September pull-forward and fleet-business orders that will be fulfilled? Up a solid 15.25 percent to 1.2 million; but not nearly as impressive as “20” percent. And where did those extra orders come from? Interesting in an election year that state and federal governments gave a solid boost to the auto industry by increasing orders by 80 percent vs. a year ago; a 30-fold increase vs. July. (See Page 7 for details.) 09.21.12
  • 2. 12.93% 13.98% 11.9% Page 2… CNW Research: Retail Automotive Summary September 2012 Closing Ratio Closing Ratio 37.02% September Outlook: Could Hit 14.2 Million Delivery Rate; Year on Track: 14.5 Million With the first 20-days of September behind us, the rest of the month could well put the auto industry at a 14.2 million delivery rate and the year at 14.5 million units. Reported sales for the month should be up about 13 percent with deliveries up 11.7 percent. Same store sales were just about 13 percent higher in the first 20 days vs. year ago with closing ratios swelling to 37 percent of floor traffic. The last figure is well ahead of August’s 31 percent. (Doc. 832.) While floor traffic has slowed somewhat, it still remains higher than year-ago by nearly 12 percent. Motivation: “Fuel economy of existing vehicle” number one for 29 percent of new-car intenders followed by “Existing vehicle no longer suitable for driving needs” (21.4 percent). Most Staying in Same Market Segment With that said, CNW’s Purchase Path still shows the majority of consumers who are looking to make a new-vehicle acquisition are planning to remain in the same market segment and counting on the new vehicle to provide greater fuel economy. Roughly 18 percent say they are moving from a truck to a car with 11 percent reporting they intend to move from a car to a truck. Loyalty to Brand Rebounding While it’s too early to tell if the trend will continue, there is an undercurrent of satisfaction with the current brand owned among new-car intenders. Translation: The vast majority of new-car intenders say they will stick with their current automaker when time comes to make the trade. That is welcome news for Toyota and Honda who have seen the loyalty to those marques diminish over the past three years. Ford and Hyundai were the two major recipients of those would- be defectors. It now looks as if Ford, at least, will have to up its marketing efforts to snag Toyota/Honda leaners. Hyundai, on the other hand, continues to be on the shopping list for Toyota/Honda shoppers as is Nissan and Chrysler to a lesser extent. General Motors, however, is being seriously thwarted among new-car intenders. Fully 22 percent of new-car intenders believe GM will eventually re-file for bankruptcy within the next few years. Only 8 percent of intenders think Chrysler will re-file for bankruptcy, down from 34 percent two years ago.
  • 3. Page 3… CNW Research: Retail Automotive Summary September 2012 Jitters Index Slips v Year Ago, Flat Compared to August; Await Election JITTERS INDEX Fed Gas Child’s Job Day to Day Condition of Food Local Jitters Taxes Prices Edu Stability Needs Investments Prices Taxes Index Vs Previous Mo. -0.10% 0.77% 0.00% 0.50% 0.78% -0.96% 1.68% 0.00% 0.38% Vs Mo. ‘11 0.31% -7.29% -10.15% -3.00% 5.85% -7.21% 4.43% 0.71% -1.20% Americans are putting many of their home-centric economic worries on hold until the Presidential election is over. That’s the take-away from the September Jitters Index surveys. Overall, the Jitters Index was effectively unchanged from August’s reading, up barely 0.38 percent. Each of the categories within the Index similarly showed little month-over-month movement with the exception of food prices. When asked what they felt was the most important issue or event that could affect their overall concerns, the Presidential Election was number one, regardless of party affiliation. A slim majority of the Key Market (consumers who make up the bulk of big-ticket purchasers including auto buyers) said they expect the Obama Romney Gas Prices -37% 21% Food Prices -21% 2% Taxes -59% 14% Job Stability 11% 19% Day to Day Needs -12% -13% Condition of Investments 15% 26% Local Taxes -2% -1% Overall Score -15% 10% Weighted Average Respondents re-election of President Obama would lengthen and/or worsen their home-centric economic condition. Obama v Romney On Short-Term Impact When asked about each of the home-centric main categories, Governor Romney was viewed as being able to have a quicker positive impact on their lives, according to the respondents, while the overall score for President Obama was on the negative side of the scale. Policies that would improve gas prices, for example, showed Obama scoring a negative 37 percent to Romney’s positive 21 percent. On the ability to stabilize the job market, both men scored positive with Obama at 11 percent, Romney at 19 percent. In terms of initiating policies that would improve “Day to Day Needs”, both men were viewed about the same at negative 12 and 13 percent respectively. Neither man was seen as being able to impact local taxes but Obama had a negative score of 59 percent when it came to federal taxes while Romney had a positive 14 percent rating.
  • 4. Page 4… CNW Research: Retail Automotive Summary September 2012 Note: This is a Graphs Page. 40 45 50 55 60 65 70 75 80 85 90 Used Vehicle Days' Supply Sept. Split of Days' Supply Car Truck Sept 104.2% 96.70% Oct 103.2% 96.35% Nov 106.1% 95.32% Dec 106.8% 94.68% Jan 105.6% 94.95% Feb 97.8% 105.85% Mar 92.0% 110.71% Apr 85.7% 118.41% May 86.3% 118.66% June 83.8% 122.14% July 87.2% 109.67% Aug 91.3% 108.85% Sept 93.2% 107.02% Oct 94.48% 105.31% Nov 98.03% 104.67% Dec 101.35% 98.44% Jan. 12 102.42% 97.67% Feb 89.93% 109.74% Mar 88.58% 111.43% Apr 86.37% 113.57% May 90.24% 108.21% June 102.71% 97.53% July 119.46% 90.32% Aug 121.64% 88.29% Sep 121.73% 88.34% Document 112m Detroit Asian Euro May 40.91 44.87 52.36 June 41.57 43.79 52.74 July 41.06 43.92 50.03 August 43.34 41.28 48.62 Sept 44.97 42.05 46.32 Oct 45.62 42.09 46.58 Nov 45.05 44.28 45.32 Dec 45.08 46.39 45.47 Jan. 12 43.22 44.92 45.76 Feb 43.71 45.02 45.66 Mar 44.82 46.87 45.61 Apr 45.36 46.72 45.29 May 44.06 45.22 44.97 June 44.51 46.29 45.71 July 48.06 47.24 46.94 Aug 49.19 48.83 47.26 Sep 49.71 48.93 48.02
  • 5. Anticipated Sept Actual Sept % Chng YTD YTD % Chng Document 106m cy12 cy11 12v11 cy2012 cy2011 12v11 Franchised Dealer Sales 1,328,881 1,189,966 11.7% 11,556,061 11,008,705 5.0% Independent Dealer Sales 1,288,739 1,174,839 9.7% 10,596,501 11,001,610 -3.7% Casual (Private) Sales 873,005 863,670 1.1% 9,194,429 8,144,612 12.9% Total Sales 3,490,625 3,228,475 8.1% 31,346,991 30,154,927 4.0% Page 5… CNW Research: Retail Automotive Summary September 2012 September got off to a strong used-sales start that continued throughout the first 20 days and put the industry on a path to an 8-plus percent gain. For the first time in months, Independent dealers are looking at a significant year-over-year improvement thanks to inventories and supply becoming more stable and improvements in inventory make up. Like the new-car market, all dealers are finding it easier to place sub-prime used-vehicle paper. For the new-car market, approvals for sub-prime are up 62 percent vs. year ago and 8.6 percent vs. last month. A similar condition exists on the used-car side with sub- prime in the opening weeks of September up by nearly 50 percent vs. the same month of 2011. CONTEXT: Expect continued strong showings for Independent dealers over the coming quarter as long as the supply issues continue to improve and new-car dealers have solid trade-in volumes. There was a slight weeding-out process over the summer eliminating some weaker Indies. CNW expects the loss of 200 to 500 used-car outlets by the end of the year. September: All Channels Up; Indies’ Supply Stabilizes, Pushes Volume to Positive Gain 60.0% 70.0% 80.0% 90.0% 100.0% 110.0% 120.0% 130.0% Sept Nov Jan Mar May July Sept Nov Jan. 12 Mar May July Sep Car V Truck Days' Supply Car Truck New Finance Only (Doc 1409) Prime Near Prime Sub Prime % Change v year ago 3.8% 4.3% 62.5% % Change v previous month 0.44% 0.30% 8.55%
  • 6. Page 6… CNW Research: Retail Automotive Summary September 2012 Franchised Independent Franchised Franchised Independent Independent Document 107m Asking Price Asking Price Trans Price % of Asking Trans Price % of Asking Jan. '12 $11,516 $10,483 $10,855 94.26% $9,715 92.67% Feb. '12 $11,714 $10,627 $11,155 95.23% $9,909 93.24% Mar '12 $11,826 $10,592 $11,254 95.16% $9,874 93.22% Apr ’12 $12,293 $10,289 $11,500 93.55% $9,379 91.16% May '12 $12,119 $9,987 $11,296 93.21% $9,071 90.83% June '12 $11,684 $9,937 $10,754 92.04% $8,977 90.34% July '12 $12,136 $9,842 $11,185 92.16% $8,943 90.87% Aug '12 $12,103 $9,849 $11,138 92.03% $8,936 90.73% Sept ‘12 $11,827 $9,767 $10,894 92.11% $8,853 90.64% Sept '11 $11,253 $10,219 $10,807 96.04% $9,572 93.67% Oct. 11 $11,394 $10,384 $10,952 96.12% $9,744 93.84% Nov. '11 $11,186 $10,148 $10,654 95.24% $9,452 93.14% Dec '11 $11,058 $10,039 $10,547 95.38% $9,384 93.48% Percent Change Yr over Yr 5.63% -3.18% 1.06% -4.34% -6.90% -3.85% Month Over Month Price -0.27% 0.07% -0.42% -0.15% -0.08% -0.15% Used Vehicle Prices Still Soft on Higher Volume; Turnaround May be in the Making The rate of price decline month over month is shrinking which could portend positive price increases in the fourth quarter of this year and certainly no later than the first quarter of next. Franchised-dealer asking prices were up more than 5.6 percent in the opening weeks of September but they couldn’t make the higher tags fully stick. Actual transaction prices were up barely 1 percent. Independents’ asking prices were 3.2 percent lower than year ago with transaction prices off nearly 7 percent. Haggling Increases Used Car intenders are bargain hunting and increasingly using online price guides and Internet price sites such as AutoTrader and craigslist to haggle with dealers. In fact, the number of shoppers who now haggle over a used car price has climbed from 71 percent in 2005 to more than 85 percent this year.
  • 7. Page 7… CNW Research: Retail Automotive Summary September 2012 Commercial-Fleet Jumps 96 Percent in August cy12 Jan Feb March April May June July August All Sales 912,874 1,148,975 1,404,100 1,184,069 1,334,150 1,285,005 1,153,269 1,285,292 Percent Change v Previous Year 11.4% 15.7% 12.7% 2.4% 25.9% 22.0% 8.9% 19.9% Fleet and Commercial Use 39.52% 36.48% 36.92% 38.09% 36.41% 38.25% 38.73% 44.38% Total Fleet (Monthly Approximates) 360,768 419,146 518,394 451,012 485,764 491,514 446,661 570,413 Percent Change v Previous Year 32.7% 40.5% 31.6% 22.4% 63.5% 77.2% 57.8% 96.1% FLEET COMMERCIAL VALUE -- Per Unit $27,219 $27,254 $27,614 $27,943 $27,904 $28,147 $28,221 $28,794 FLEET COMMERCIAL VALUE -- Total $Bllns $9.82 $11.42 $14.31 $12.60 $13.55 $13.83 $12.61 $16.42 Percent Change v Previous Year 40.92% 48.55% 39.68% 30.13% 69.34% 84.70% 64.12% 104.25% Government Fleet 18,805 23,439 28,222 24,747 25,616 25,315 22,373 40,358 Share Gov't of Total Sales 2.06% 2.04% 2.01% 2.09% 1.92% 1.97% 1.94% 3.14% Percent Change v Previous Year -27.6% -17.5% -16.7% -18.0% 3.3% 10.8% 2.5% 83.7% Small Business Fleet and Commercial Use 35,967 47,338 59,815 51,152 59,770 58,082 53,973 60,537 Share Small Business of Total Sales 3.94% 4.12% 4.26% 4.32% 4.48% 4.52% 4.68% 4.71% Percent Change v Previous Year 34.3% 29.1% 24.1% 13.1% 72.4% 81.4% 63.8% 73.2% Medium Business Fleet and Commercial Use 88,731 116,736 150,520 124,682 142,887 124,388 112,790 117,861 Share Medium Business of Total Sales 9.72% 10.16% 10.72% 10.53% 10.71% 9.68% 9.78% 9.17% Percent Change v Previous Year -3.6% 57.5% 67.6% 48.5% 104.6% 88.1% 66.6% 77.1% Large Business Fleet, Daily Rental, Commer. 217,264 231,633 279,837 250,431 257,491 283,729 257,525 351,656 Share Large Business of Total Sales 23.80% 20.16% 19.93% 21.15% 19.30% 22.08% 22.33% 27.36% Percent Change v Previous Year 71.0% 45.5% 26.1% 19.8% 53.5% 81.5% 60.4% 110.2% 40.00% 47.50% 55.00% 62.50% 70.00% Share Retail August 58.96% Fleet orders showed a staggering increasing vs. year ago, one that causes a bit of head-scratching and generates a lot of questions. For example, the 84 percent increase in government fleet orders and purchases is dramatically high compared to previous months causing some speculation that it is politically motivated to help automakers continue a positive sales run. Retail share of total sales fell again in August to under 60 percent reinforcing the 110 percent gain by large business fleets.
  • 8. Page 8… CNW Research: Retail Automotive Summary September 2012 Mobile Part 4: In Auto Market, What are They Using Mobile to Find Out? In the Purchase Process, consumers cycle through a series of stages in search of the right vehicle for individual driving needs. And a growing percentage of those new-car shoppers are using mobile devices to collect the appropriate information at the appropriate time. A quick overview of the process: When first considering a new-vehicle acquisition, a consumer looks at his/her personal and family needs. Seating for six, towing a boat, long distance vacations by car, for example. That example would obviously eliminate many segments (e.g. mini-pickups, sportscars). The typical shopper then looks at the market segments and models that meet those needs. This could well include minivans, small or large SUVs, crossovers. In the third stage of the Purchase Process, shopper will shuffle through the various models found in the previous stage then look at styling and personal considerations. For example, many will scratch My needs Models available Styling Features Price 61.62% 68.15% 27.61% 28.34% 73.94% Use Mobile minivans from the list because of the soccer mom stigma while others will drop large SUVs because of the fuel-hog image. The net result is a shopper with four to six specific vehicles on the list before moving on to compare the features each of those models have. This could include, in our example, a tow package, rear-view camera, easy installation of electric brake systems, high enough horsepower to tow a large boat, etc. As with the third stage, the fourth results in fewer vehicles on the list – typically no more than three – which are then price shopped online and directly at dealerships. Mobile’s Involvement In CNW’s mobile studies, as the chart at the left shows, mobile’s highest use is to compare prices among the “finalists” in the shopping process. But that’s not the only area mobile has a strong presence. When consumers are looking to define their “needs,” 62 percent use a mobile device to research potential vehicles meeting those needs or driving habits. An even larger percentage of new-car shoppers use a mobile device to search out models that meet those driving requirements. When asked if this is done in a single sitting or over multiple days, the vast majority – 88 percent – reported tapping into their mobile device “as time permitted.” Translation: Looking at a model or two over lunch or during a work break or while sitting in traffic. This is distinctly different from what CNW has seen with computer usage. Shoppers tend to do a large amount of research in a single session while mobile users spread the research out. When comparing styling and features, however, the small screen is a hindrance and mobile use diminishes only to increase again at the end of the Purchase Funnel when Price is the key information requirement.
  • 9. Toyota Motor Sales USA certainly seems to be rocking and rolling again, after several years in the barrel. The bleak years, lest we forget, were marked by massive recalls, embarrassing Congressional hearings, federal fines, red ink, then compounded by last year's earthquake and tsunami in Japan. But Toyota, Scion & Lexus are back in favor with Americans. The automaker reported selling 1.399 million Toyotas and Scions in the first 8 months of 2012 vs. just 1.07 million a year ago. Lexus “Split World,” click here. Jean Halliday’s Page 9… CNW Research: Retail Automotive Summary September 2012 Lexus sales are up nearly 25% in the same period to 150,604 units. Still, let's compare that to the first 8 months of 2007, when the OEM said it sold 1.569 million Toyotas and Scions, plus 220,000 from Lexus. In perspective, the whole industry has been in a funk in this country for several years. These days Toyota Motor is motoring right along. In general, the automaker's advertising hasn't been much to crow about. Over the years, Toyota's three brands have sold lots of new vehicles IN SPITE of their so-so advertising. But there's a couple of bright spots of late. Let's start with Lexus, which for the most part has used some of the Lexus “Future Unfolded,” click here. most mind-numbing ads in the luxury car segment pretty much since the new century started. Such a shame for a brand that once had some of the industry's most memorable ads, such as the champagne glasses balanced on the hood. Some Hits, Some Misses at Toyota ‘Split World’ from Team One Gets a ‘Bravo’; ‘Future Unfolded’ Not so Much
  • 10. For the launch of the new 2013 ES and first ES Hybrid comes this gem, called “Split World.” Bravo! This commercial from Team One is one of the best from Lexus in a long time. It's visually arresting, almost forcing you to watch. The montages portray modernism, cool technology and luxury. And the premise actually makes sense: “Introducing a reason to look twice.” It's not loaded with a bunch of mumbo-jumbo talk or list of features, which most people just go online to find out about anyway. But Lexus isn't out of the woods yet. How could the brand get it so right with that spot and so wrong with another ES launch commercial? Check out “Future Unfolded.” (Previous page.) Page 10… CNW Research: Retail Automotive Summary September 2012 Where are the ‘Old’ People? Lexus said this is one of 3 spots targeted at African-American, Hispanic and LGBT audiences. It's amazing how different the two spots are. This one is just lame. It tries too hard to be cool and young- two words not readily associated with Lexus. Why are all those young folks in the ES and dancing around it? They are no where near in age to the actual Lexus owner base. You can't fool people about this either. One sharp YouTuber commented “That's funny....I didn't see any old people” in that ad. One place the Lexus ES won't be taking these hip people is to a night club. The writing is forced, especially this line from the narrator, actor Jim Remar, “with technology and style to match your achievements and desires.” That's quite lofty and presumptuous of Lexus to think it knows what peoples' desires are. Those words are just wasting time and space in the ad. Lexus is taking a page from cousin Scion with a social media push reaching out to start-up innovators and the chance for four of them to each get $100,000 in seed money for their products. Voting will take place on a custom Facebook app. The ES also becomes the first auto brand with a brand magazine on mobile Flipboard. This is a smarter way to reach a younger audience. OK. Let's move onto the Toyota brand. It's been a while since Toyota has done any meaningful national advertising for its full-size Tundra pickup. Back in 2007, Toyota spent more than $100 million to launch the then-redone, more competitive Tundra in hopes of selling 200,000 of them that year. That was Toyota's biggest-ever launch. But Tundra still takes a back seat to Detroit's truck iron, selling only 65,600 Tundra's in the first 9 months of 2012. Now Toyota is beating the drums again for the pickup, starting a multi-media push this month about how the Tundra will tow “an American icon live before the whole world” on Oct. 13. Yup, the Tundra will haul the space shuttle Endeavour for the last leg of its trip from Los Angeles International Airport The Tundra Endeavour, click here. on city streets to the California Science Center. It's a big deal since a stock, 1/2-ton, 2012 Tundra CrewMax will be used to tow the 145-ton shuttle.Toyota's ad agency, Saatchi & Saatchi Los Angeles, handled the deal with the Science Center to show off the Tundra's towing toughness. Here's the promo, just one of lots of videos coming for the effort Toyota is encouraging people to follow the Tundra's adventure online at www.toyota.com/TundraEndeavour. People can sign up for email updates and Toyota will donate $50 to the science center for every Tweet on Twitter about the tow.
  • 11. There's just one little detail that's almost glossed over in Toyota's hype about this feat. The pickup is only going to tow the space shuttle the last quarter mile of its 12-mile trip leg to the Science Center!!! Doesn't all this hoopla seem a bit too much for that? Meanwhile, the Toyota brand just announced it is dropping its “Moving Forward” ad tag that's been used since 2004. That's great news! That line was a nothing but a corporate-driven theme from on high that really had little to do with the brand. It's generic and could have been used for lots of other car brands. I'll bet 9 out of 10 Americans couldn't identify it as Toyota's ad tag- even after 8 years and millions of dollars of advertising. Back in 2004, Toyota exec Jim Lentz admitted that the brand's “Oh, what a feeling” tag, which showed owners jumping for joy, had the most consumer awareness at the time, which makes you wonder why they dropped it. Toyota used that line from 1980 through '86. Toyota's new line, “Let's Go Places,” will bow late this year. New Tag Missing Something Ugh oh. Also sounds very generic and interchangeable with other car brands. Hey, it could be used for an airline or online travel site. Toyota Division's Bill Fay, group VP-general manager, gave this explanation, saying the new tag “speaks to the evolution of Toyota and our commitment to leading through innovation, enriching lives and connecting with customers in new ways they define.” He called the tag “energetic, aspirational, inclusive and very versatile. The phrase conveys a dual meaning of physically going places and taking off on an adventure, while also expressing optimism and the promise of exciting innovation that enriches people’s lives.” Okay then. Rationalize it any way you want. It would be better to have NO tag than to use one that isn't tied directly to one brand and one brand only. Page 11… CNW Research: Retail Automotive Summary September 2012 But here's something Toyota IS doing right. It has taken owner testimonial ads to a new level with its new Camry Effect blitz that includes this web site at http://toyota.com/camryeffect. Smart Site Sets the Industry Bar Billed as “real Owners. Real Stories,” the site is loaded with tons of great input from actual owners. The site has interesting factoids, like 79% of Camry owners know how to change a tire and 82% prefer an automatic. Toyota is pushing the site via TV ads like this one from Camry owner Ja Ne't Rommero Testimonial ads are nothing new in car advertising, but THIS is smart advertising and sets the bar for the industry. Toyota Camry: Ja Ne’t Rommero’s Story, click here
  • 12. This time of year always generates significant sales of smaller, less expensive vehicles as high school and college students and their parents enter the market looking for cars and trucks that provide reliable transportation. While most go into the used-car market, those lucky enough to come away with a new vehicle usually gravitate toward the lower end of the spectrum. That’s what happened in August. Budget cars had a slight uptick as did Economy cars, neither hitting their share-of-sales high water mark but clearly on the rise. Electric cars saw an increase in August, but mostly because of fleet not consumer purchases. The full-size pickup market is healthy again. For the fourth month in a row, this segment took a larger share of sales than the previous month and hit the highest share of sales of 2012 in August at 11.6 percent. Small businesses were the driving force here as they continue to see improvements in construction trades requiring pickup trucks as the key means of transportation. Page12... CNW Research: Retail Automotive Summary September 2012 12.09% 11.40% 11.87% 11.31% 11.78% 12.21% 12.48% Entry Level Utility Vehicle 2.09% 2.13% 1.96% 1.93% 1.70% 1.54% 1.68% 1.81% Budget Car 12.54% 13.45% 13.81% 12.34%12.41% 12.13% 12.24% 12.87% Economy Car 0.14% 0.13% 0.21% 0.16% 0.17% 0.18% 0.20% 0.28% Electric Car Back to School Smaller Vehicles Take the Prize; Small-Business Pickups Best of ‘12 89.7% of Sales Incentivized Of the vehicles sold in August, nearly 90 percent carried an incentive. That’s the highest percentage of 2012 and the highest since July of 2005. While the industry has gotten significantly better at targeting incentive dollars both by model and market, the need to offer some form of dealer or consumer “spiff” has grown with the ability of shoppers to research both MSRPs and discounts. As a share of total incentive dollars, Detroit was responsible for 45 percent; Asian 54 percent; European 1 percent. (See Doc 121m.)
  • 13. Page 13… CNW Research: Retail Automotive Summary September 2012 10.90% 10.56%10.37% 10.19% 10.46%10.58% 10.78% 11.63% Full Size Pickup 1.56% 1.71% 1.68% 1.99%2.05% 2.05% 2.08% 1.66% Full Size Van 1.32% 1.35% 1.38% 1.33% 1.46% 1.52% 1.67% 1.21% Luxury Car 10.78%11.04%11.43%11.87%12.44%11.96% 10.76%10.14% Lower Midrange 8.51% 8.20% 7.99% 8.20% 8.34% 8.28% 8.77% 8.53% Lower Mid Range Utility Vehicle 1.62% 1.46% 1.33% 1.49% 1.66% 1.74% 1.79% 1.38% Large Utility Vehicle
  • 14. 3.70% 3.52% 3.35% 3.35% 3.06% 3.51% 3.80% 3.71% Page 14… CNW Research: Retail Automotive Summary September 2012 Near Luxury Car 0.24% 0.20% 0.21% 0.24% 0.29% 0.21% 0.23% 0.26% Midi-Van 2.32% 2.27% 1.98% 2.17% 2.66% 2.70% 2.35% 2.34% Mid Range Utility-Vehicle 3.47% 3.86% 3.85% 4.01% 4.14% 3.72% 3.78% 4.28% Minivan 0.37% 0.28% 0.30%0.29% 0.31% 0.26% 0.37% 0.24% Premium Car 4.39% 4.64% 4.24% 4.63% 4.05% 4.52% 3.93% 3.76% Premium Mid-Range Car Noteworthy: Another sign that there is life in the small business community is the improved share-of-sales for Midi- Vans such as the Ford Transit Connect. As CNW pointed out a year ago, the Transit Connect has a strong consumer following with sales for non-business purposes running at 12 to 20 percent, depending on region.
  • 15. Page 15… CNW Research: Retail Automotive Summary September 2012 0.25% 0.25% 0.31% 0.34% 0.27% 0.34% 0.33% 0.33% Premium Sporty Car 3.24% 2.73% 2.50% 2.76% 2.72% 2.74% 2.72% 2.78% Premium Utility Vehicle 12.56%12.42% 12.87% 12.43% 11.54% 11.21% 11.85% 12.71% Standard Mid Range Car 2.54% 2.23% 2.07% 1.91% 1.91% 1.93% 2.02% 1.86% Small Pickup 0.19% 0.17% 0.16% 0.15% 0.17% 0.14% 0.17% 0.19% Sport Utility Pickup 1.75% 2.07% 2.19% 2.43% 2.39% 2.64% 2.28% 1.94% Touring Car Noteworthy: Toyota and Honda rebound is showing up as a share of Standard Mid- Range Car data. This segment (far left) had its best share-of-sales month of since March, second best of the year.
  • 16. Page 16… CNW Research: Retail Automotive Summary September 2012 0.07% 0.05% 0.03% 0.03% 0.02% 0.02% 0.02% 0.01% Traditional Car 0.02% 0.01% 0.02% 0.02% 0.02% 0.02% 0.02% 0.01% Ultra Upscale Car 0.05% 0.04% 0.04% 0.05% 0.04% 0.04% 0.05% 0.04% Ultra Luxury Sporty Car 1.61% 1.54% 1.37% 1.81% 1.90% 1.88% 1.79% 1.97% Upper Mid-Range Utility 0.04% 0.05% 0.02% 0.04% 0.06% 0.05% 0.03% 0.05% Ultra-Premium Utility Vehicle 0.17% 0.16% 0.12% 0.18% 0.19% 0.16% 0.19% 0.15% Upper Premium Sporty Car Noteworthy: The Traditional Car segment continues to decline as brands drop their historic models such as the Crown Victoria and Mercury Marque.
  • 17. Page 17… CNW Research: Retail Automotive Summary September 2012 Back Page *Deliveries not sales Sept 1-15 Sept 1-15 % Chng Actual Sales Sept '12 Full Mo cy2012 cy2011 12 v 11 Sept '11 Sales Change New Cars Extension Detroit 3 129,462 119,582 8.3% 149,373 161,714 8.3% Asian 156,904 131,646 19.2% 273,010 325,391 19.2% European 29,573 28,629 3.3% 73,993 76,433 3.3% Ttl Pass. Cars 315,939 279,857 12.9% 496,376 563,538 13.5% New Trucks Detroit 3 182,819 168,432 8.5% 357,193 387,703 8.5% Asian 51,376 43,628 17.8% 172,881 203,583 17.8% European 5,771 5,582 3.4% 26,860 27,769 3.4% Ttl Lt. Trucks 239,966 217,642 10.3% 556,934 619,056 11.2% Ttl Industry 555,905 497,499 11.7% 1,053,310 1,182,594 12.3% Sept 1-15 Full Sept % Chng Prev Mo Prev Mo % Chng cy2012 cy2011 12 v 11 cy2012 cy2011 12 v 11 Lease Share 27.9% 25.7% 8.6% 27.9% 25.3% 10.3% Floor Traffic - New 76.92 63.65 20.8% 76.25 64.53 18.2% Floor Traffic - Used 86.45 76.84 12.5% 86.22 77.42 11.4% Sept 1-15 Prev Yr % Chng % Chng Pent Up Demand Units cy2012 Full Sept Same Mo '11 Prev Mo Aug '12 96,700 Avg. New MSRP $37,224 $34,708 7.25% 0.18% Aug '11 182,250 Total Discounts $4,981 $4,956 0.50% 0.11% % Change -46.9% Manufacturer Incentives $3,642 $3,367 8.17% 0.22% Dealer Incentives $1,339 $1,589 -15.73% -0.19% Purchase Delay Months Core Transaction Price**** $32,243 $29,752 8.37% 0.19% Aug '12 3.47 % Mfg Incentive of MSRP 9.78% 9.70% 0.9% Aug '11 4.8 % Ttl Discounts of MSRP 13.38% 14.28% -6.3% % Change -27.7%