May Your Data be Measurable and Right
•
1 recomendación•661 vistas

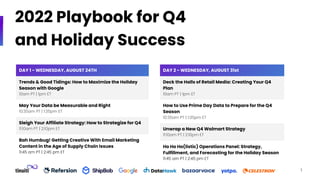
The document outlines an agenda for a two-day playbook on strategies for Q4 and the holiday season success. Day 1 includes sessions on maximizing the holiday season with Google, data measurement for Q4 planning, affiliate strategy, and email marketing creativity amid supply chain issues. Day 2 covers creating a Q4 retail media plan, using Prime Day data to prepare for Q4, developing a Q4 Walmart strategy, and a panel on holistic operations for the holidays.

Recomendados
Recomendados
Más contenido relacionado
Similar a May Your Data be Measurable and Right
Similar a May Your Data be Measurable and Right (20)
Más de Tinuiti
Más de Tinuiti (20)
May Your Data be Measurable and Right
- 1. 2022 Playbook for Q4 and Holiday Success DAY 1 - WEDNESDAY, AUGUST 24TH Trends & Good Tidings: How to Maximize the Holiday Season with Google 10am PT | 1pm ET May Your Data be Measurable and Right 10:35am PT | 1:35pm ET Sleigh Your Affiliate Strategy: How to Strategize for Q4 11:10am PT | 2:10pm ET Bah Humbug! Getting Creative With Email Marketing Content in the Age of Supply Chain Issues 11:45 am PT | 2:45 pm ET DAY 2 - WEDNESDAY, AUGUST 31st Deck the Halls of Retail Media: Creating Your Q4 Plan 10am PT | 1pm ET How to Use Prime Day Data to Prepare for the Q4 Season 10:35am PT | 1:35pm ET Unwrap a New Q4 Walmart Strategy 11:10am PT | 2:10pm ET Ho Ho Ho(listic) Operations Panel: Strategy, Fulfillment, and Forecasting for the Holiday Season 11:45 am PT | 2:45 pm ET 1
- 2. May Your Data be Measurable and Right 2
- 3. Today’s Logistics Kerry Mallett Senior Content Specialist, Webinar Recording & slides from today will be in your inbox tomorrow Download relevant resources Join our chat and submit questions for live Q&A Log back anytime with same link Join our poll questions - including if you want to talk to our teams after! 3
- 4. WE’VE MASTERED THE MEDIA THAT MATTERS MOST Tinuiti is the largest independent performance marketing firm across Streaming TV and the Triopoly of Google, Facebook, Amazon. Employees Media managed Award-winning culture* $3B #1 1000+ 4
- 5. Some of Our Clients Our Recognition For commerce leaders of today and the future 5
- 6. Our Speakers ANNICA NESTY Group Director, Integrated Intelligence DOUG MACDONALD Associate Director, Marketing Science 6
- 7. Agenda ● Things To Consider When Planning For Q4 ● Measurement Solutions That Can Be Used To Define A Strategic Q4 Plan That Will Deliver Growth ● Key Takeaways ● Q&A 7
- 8. Do your KPIs or performance goals change for Q4? ● They do a lot ● They do slightly ● We use the same KPIs all year POLL 8
- 9. How do you measure Q4 success? ● Last click CPMs ● ROAS ● Cost per acquisition ● YOY growth in sales revenue or volume ● Something else - tell us in the chat! POLL 9
- 10. Things to consider when planning for Q4 ● Seasonality/Holiday Trends ● Current macroeconomic trends ● Increase in marketing cost/ad spend ● Increase in competition ● Balancing the marketing mix to maximize return on investment ● Balancing for changes in buyers behavior across points of sale: In Store vs. Online Q4 October November December 10
- 11. 11 Analyzes sales patterns over time and determine contribution to sales across key inputs ( media channels, promotions etc...) Changes in efficiency and performance - CPA, ROAS, CPC Optimize budget allocation and forecast future sales across spend scenarios WHAT HAS HAPPENED? WHY IT HAPPENED? WHAT DO I DO ABOUT IT? Marketing effectiveness / efficiency and base trends are calculated to explain volume change Provide tangible recommendations to optimize future marketing plans Decompose engagement and product interest to understand volumetric impacts of marketing / operational activities Questions To Ask When Developing A Q4 Plan Using Data And Analytics
- 12. Measurement Solutions That Help Inform Q4 Strategy And Monitor Performance Pre ● Evaluating performance prior year Q4 and prior months leading up to Q4. ● Quantifying the contribution from holiday during prior Q4. ● Testing media mix scenarios to determine what is most optimal for your brand. ● Setting holiday goals based on media investment During ● Tracking performance against goal ● Monthly refresh Post ● Evaluating Q4 performance. Setting Q1 goals Pre ● Compare change in attribution during holiday vs. non holiday periods. ● Determine the ranking of channel effectiveness during the holiday season. ● Determine which channels drove high value customers during the holiday season. ● Determine which channels drove new customers during the holiday season. ● Determine which channels were most effective online vs. in store During & Post ● Daily, weekly or monthly tracking of contribution across channels vs. spend allocation Pre ● Using experimental frameworks to test, learn and measure the impact/lift associated with budget shifts, starts/stops, promos, new product/services During & Post ● Measure lift from the increase in budget and changes in investment across the funnel during holiday season using synthetic controls. Marketing Mix Modeling (MMM) Multi Touch Attribution (MTA) Incrementality Testing 12
- 13. Marketing Mix Modeling Marketing Impact, Response Curves, Budget Optimization & Scenario Testing 13
- 14. 14 Media Activity: Channel Level (Paid search, Social etc...) Operational Activity Promotions, product launch etc..) External Factors (Unemployment rate, Competitor Spend, COVID etc..) Sales Units or Sales Revenue TARGET MODEL DRIVERS DATA REQUIREMENTS MODEL REQUIREMENTS Minimum of 1-3 YEARs of historical data MARKETING MIX MODEL Review and assess historical performance Future forecasts Evaluate current marketing initiatives What if analysis Optimize spend across media channels Ongoing evaluation Evaluates past marketing performance to measure how media channels drives sales to determine “true” marketing ROI and optimal mix of media activity. Delivers multi channel attribution measurement Marketing Mix Modeling Overview
- 15. Current View Post MMM View OPTIMIZE Marketing Mix Models Help Us To Assess Opportunities For Growth And Identify Areas Where We Can Improve Efficiency In Q4 15 ● What is the optimal mix of media in Q4? ● How much should we change our level and allocation of our media investment to increase ROI in Q4? ● How should we be adapting our budget allocation strategy based on seasonal trends of Q4? ● What media investment is needed in Q4 to generate a 10% lift in sales YoY? Econometric models are used to decompose the contribution of Media MARKETING MIX MODEL
- 16. Your MMM Solution Should Include These Elements 16 Business Outcomes ● Sales Volume ● Sales Revenue ● New Customers ● Leads Key Segments ● Geos - DMAs| Region| Zip | Countries ● Business Type / Service Lines ● Product Type / Category ● Key points in time Media ● Online Media ( Search, Social,OTT, Display etc...) ● Offline Media ( TV, Direct Mail, Outdoor,OOH, Print, Radio etc..) ● Campaign ● Platform ● Tactic- Brand|Non Brand | Prospecting| Retargeting ● Upper | Mid | Lower Funnel ● Local vs. regional vs. national Non Media ● Promotions ● Product Launches ● Creative Macroeconomics ● GDP ● Unemployment ● CPI ● Volatility index ● COVID Impact ● Global Events Competitor Performance ● Media Spend Weather Holiday/Seasonality Because no model is perfect BUSINESS OUTCOME MARKETING FACTORS NON-MARKETING FACTORS ERROR
- 17. How Do We Use The Insights From An MMM To Drive Growth In Q4? ● Multi channel attribution ● Measure channel effectiveness and how that changes overtime ● Unique contribution of channel/tactics ● Assess channel spend saturation ● Explore sales response based on various levels of spend ● Determine channels that can be used to push spend and drive growth vs. channels where spend can be scaled back ● Determine the most effective budget allocation based on media mix channel ROI ● Test various budget allocations to forecast future performance and determine which plan provides the best return on investment over time ATTRIBUTION SATURATION & DIMINISHING RETURNS ASSESSMENT OPTIMIZATION AND FORECASTING 17
- 19. 19 Multi-Touch Attribution Overview This is achieved by mapping out the customer journey, and each step in that journey, that leads to a conversion. Relationships are examined between them to estimate the unique contribution each step has in the conversion path. Delivers multi touch attribution measurement beyond traditional last-click attribution. Media Activity - Individual Level (Paid search, Social etc...) Sales Units or Sales Revenue MOBIUS: DATA REQUIREMENTS MOBIUS: MODEL REQUIREMENTS Minimum of 1 MONTH of historical data TARGET MODEL DRIVERS MULTI-TOUCH ATTRIBUTION MODEL Review and assess historical attribution Ongoing evaluation Evaluate salience of channels in customer segments Future optimization Evaluate top converting paths Future execution
- 20. Assessing Changes In Unique Contribution During The Holiday Season 20
- 21. What Are The Top Converting Customer Journeys In Q4? 21
- 23. Incrementality Solutions Can Solve for Many Challenges INCREASE/DECREASE IN MEDIA SPEND CAMPAIGN EFFECTIVENESS; UPPER FUNNEL TACTIC EFFECTIVENESS CREATIVE, MESSAGING, OFFERS EXPANSION TO NEW MEDIA CHANNELS & NEW PRODUCT LINES 23 THIS EXPERIMENTAL FRAMEWORK ALLOWS US MEASURE AND QUANTIFY THE IMPACT OF: Be more informed about impact of changes in budgets, which helps improve optimization efforts Measure the impact on sales; analyze what is driving the strongest response across audience segments Using data to inform how effective changes in messaging and/or creative is at reaching target audience Test the impact of a new media channel, new product lines and leverage insights to scale investment. Ongoing measurement of impact of changes in advertising
- 24. GEO MATCH MARKET GEO / AUDIENCE SPLIT MARKET SYNTHETIC CONTROL Incrementality Measurement Types We Can Leverage In Q4 ● In this measurement approach the test or exposed group is a specific market(s). ● The remaining markets would be evaluated to determine if there is a single market or group of markets that is comparable to the exposed group (a “match”). ● We will use the difference between the matched markets to determine if there was a statistically significant incremental lift due to the intervention. ● In this measurement approach we split the audiences and/or markets - DMA, State, City or Zip level geos into randomized, comparable groups ● This is dependent on the ability to execute media at the specified audience and geo level. ● The test group would be exposed to the intervention, while the control group would remain business as usual. ● This approach is used if we are unable to define a balanced test/control group, or execute media on the geo/audience grouping approaches described. ● We will develop a predictive model based upon historical data before the intervention or change in strategy. ● The model will be used as a synthetic control to help us predict what the performance would have been if there was no intervention. 24 TEST CONTROL TEST CONTROL Recommended
- 25. Causal Analysis Using A Synthetic Control Enables Always On Incrementality Measurement Why Synthetic Incrementality Design? What insights can be gained from synthetic incrementality? ● A synthetic control framework is: ○ Always-On ○ Non-disruptive ○ Privacy robust (no user level data needed) ○ Reduces test contamination ● What media channel is driving the largest share of incremental sales? ● An “always on” measurement framework can track the effects of changes to the following: ○ Budgets ○ Bids ○ Targeting Type (Branded, Category, Conquesting) ○ Product Focuses ○ Placement Types ○ Total Investment Strategy (ads on or off) ● How do increase spend on non-brand campaigns impact incremental sales? ● How do pullbacks on brand spend impact total sales? ● Are there certain products that drive more incremental sales for the brand? ● What is the threshold for bid increases to impact sales? ● How does digital investment impact total incremental sales (in-store & ecomm)? 25
- 26. Agile incremental approach that provides granular insights 26 1. TRAIN Start Day 2. PREDICT 3. MEASURE Synthetic Control
- 27. Key Takeaways 1. Different analytics solutions answer different, but valid, questions for your business performance in Q4 2. Help your decision-making process with the question: “If I have this data, what can I do with it to drive results?” 3. Combining multiple measurement tools gives a more robust view of your performance than any single measurement technique can achieve alone. 27
- 28. Schedule Your Consultation with an Analytics Expert 28
- 29. Q&A ANNICA NESTY Group Director, Integrated Intelligence DOUG MACDONALD Associate Director, Marketing Science 29
- 30. 30 Stay informed on the future of digital marketing Visit our new content hub ➜
- 31. Thank you! 31
- 32. 2022 Playbook for Q4 and Holiday Success DAY 1 - WEDNESDAY, AUGUST 24TH Trends & Good Tidings: How to Maximize the Holiday Season with Google 10am PT | 1pm ET May Your Data be Measurable and Right 10:35am PT | 1:35pm ET Sleigh Your Affiliate Strategy: How to Strategize for Q4 11:10am PT | 2:10pm ET Bah Humbug! Getting Creative With Email Marketing Content in the Age of Supply Chain Issues 11:45 am PT | 2:45 pm ET DAY 2 - WEDNESDAY, AUGUST 31st Deck the Halls of Retail Media: Creating Your Q4 Plan 10am PT | 1pm ET How to Use Prime Day Data to Prepare for the Q4 Season 10:35am PT | 1:35pm ET Unwrap a New Q4 Walmart Strategy 11:10am PT | 2:10pm ET Ho Ho Ho(listic) Operations Panel: Strategy, Fulfillment, and Forecasting for the Holiday Season 11:45 am PT | 2:45 pm ET 32