Good Stuff Happens in 1:1 Meetings: Why you need them and how to do them well
RuralEMS_Lewman_PosterPresentation2015
1. ALS in Rural Townships in Hancock County
An EMS Environmental Scan
Katharina Lewman
MPH Candidate
Advisor: Ross Silverman JD
Preceptor: Randy Seals
Advanced Life Support (ALS) prehospital care is not available
from EMS providers within the geopolitical boundaries in the
three eastern, rural Hancock County townships (Blue River,
Brown & Jackson Townships).
Problem Statement
Primary data collection
included EMS trans-
portation run times from
GFT (n=363) and SWAS
(n=364). GFT provided
the data via MS Excel
reports. SWAS dictated
run data and provided
additional information.
Directed interviews with residents of the three townships
(n=13) during parent-teacher conferences at Eastern Hancock
Community School Corporation and at special service at
Warrington Nazarene Church.
Methods
There are approximately
100 square miles in the
three townships. There
are 2 BLS ambulances in
Brown Township (Shirley-
Wilkinson Ambulance
Service (SWAS)).
Greenfield Fire Territory
(GFT) provides BLS
transportation to southern Jackson and all of Blue River
Townships as well as ALS for all three through Interlocal
agreements. Hancock County has historically paid fees for
this subscription service but has notified townships that they
want to discontinue this practice.
Distance to a hospital, tax-based budget constraints, and
Indiana’s firefighting model for EMS have put ALS services at
risk for three rural townships in Hancock County. The purpose
of this environmental scan is to provide a picture of EMS as it
currently exists in rural Hancock County, to describe current
policy at the various levels of government that shapes
payment for EMS, and explore policy options to provide
optimal access to care in rural areas.
Background
Figure 1: Ambulance Locations in Hancock County
Source: Indiana Dept. of Homeland Security (2009). Infrastructure: Critical
Facilities, www.IndianaMap.org
13 interviews :
Females (n=12); Males (n=1) & Age <60 (n=10); age =>60 (n=3)
3 OK with raising taxes, 3 Not OK with raising taxes
All recognized complexity of the problem
Many wanted more information before expressing an
opinion
“EMS needs to be kept local.”
Qualitative Data
IU Richard M. Fairbanks School of Public Health I 714 North Senate Avenue I Indianapolis, IN 46202 I 317.274.3126 I www.pbhealth.iupui.edu
A correlation -0.6 < r > 0.6 will exist between total run time
(911 call to arrival at a hospital) and the time segments that
make up total run time for all groups when no
differentiation is made for ALS or BLS service.
Strong, positive correlations with Transport Dispatch to
Destination:
Transport Time (r = 0.752)
Time to Patient (r = 0.922)
Weak to moderate, positive correlations with Transport
Dispatch to Destination:
Scene Time (r= 0.480)
Response Time (r=331)
All correlations had two-tailed significance of α = .01.
The null hypothesis can only be rejected in part.
Hypothesis 3
BLS only transports will be shorter in total duration as well as segments
than ALS transports.
The null hypothesis is rejected for all but BLS Response Time categories.
The results of the ANOVA were significance for all five categories for ALS
(n=175) and BLS (n=189) runs. Response Time, Transport Time, Time to
Patient, and Scene Time were significant at the α = <.0001 level. The
significance between ALS and BLS for total Dispatch to Destination time
was at the α = 0.002 level. A summary of the descriptive statistics for this
dataset are shown in Table 2. With the exception of the Response Time,
mean SWAS BLS time segments are shorter than SWAS ALS time
segments.
Hypothesis 2
SWAS will reach patients in less time GFT will reach patients.
Average Response Time for SWAS was 8 minutes and the average for GFT
was 11 minutes. The null hypothesis is rejected.
Independent Samples T-Test showed significance (2-tailed) α = <.0001 for
all five measures.
Hypothesis 1
Provider N Mean Std. Deviation
Response Time
(Dispatch to On Scene)
GFT 378 0:11 0:04
SWAS 529 0:08 0:04
Transport Time
(Depart Scene to At
Destination)
GFT 363 0:15 0:09
SWAS 364 0:23 0:09
Time to Patient
(At scene to At Destination)
GFT 363 0:29 0:11
SWAS 364 0:37 0:10
Scene Time
(At Scene to Depart Scene)
GFT 363 0:13 0:07
SWAS 364 0:16 0:07
Transport Dispatch to
Destination
(Dispatch to At Destination)
GFT 363 0:41 0:13
SWAS 364 0:45 0:11
Shirley-Wilkinson Ambulance
Service (SWAS) Mean
Standard
Deviation Minimum Maximum
Response Time
(Dispatch to On Scene)
ALS 0:07 0:03 0:00 0:18
BLS 0:08 0:04 0:00 0:28
Transport Time
(Depart Scene to At
Destination)
ALS 0:25 0:10 0:07 1:34
BLS 0:22 0:07 0:04 1:06
Time to Patient
(At scene to At Destination)
ALS 0:40 0:11 0:17 1:47
BLS 0:34 0:09 0:17 1:17
Scene Time
(At Scene to Depart Scene)
ALS 0:20 0:07 0:03 0:53
BLS 0:12 0:05 0:00 0:45
Transport Dispatch to
Destination
(Dispatch to at Destination)
ALS 0:47 0:11 0:24 1:51
BLS 0:43 0:10 0:20 1:44
County wide EMS Commission
--Strengths: Continuity & economies of scale
--Weaknesses: Pre-existing VFDs may not want to share &
possible loss of local autonomy
Special Taxing Unit
--Strengths: Economies of scale & possible property tax cap
workaround
--Weaknesses: Historic lack of local support & tax hikes
Uber Model
--Strengths: Provides “right size” EMS & puts patient assist
calls in fee-based system
--Weaknesses: Retraining citizens to use a system other
than 911 for patient assist calls, perfecting algorithms to
get correct responder(s) & insurance payment barriers
Use existing resources
--Strengths: Keeps LOIT taxes local
--Weaknesses: Push-back from county stakeholders
Policy Options
1. Tax distributions to entity expected to provide services.
Source: Department of Local Government Finance. (2015).
Hancock. Retrieved from DLGF, County Specific Information:
http://www.in.gov/dlgf/2593.htm.
2. Change Indiana tax code to reflect value of health.
--Increased EMS Commission autonomy
--Move EMS from fire/trauma model to fire/medical care
model.
--Priority stroke EMS routing
Priorities
CAGITs/LOITs
Hancock
County
Blue River
Township
Brown
Township
Jackson
Township
1. 2015 CertifiedShares $5,324,790 $15,414 $13,943 $24,105
2. 2015 PropertyTax
ReplacementCredits
969,491 3,063 2,771 4,790
3. 2015 PublicSafety Local
OptionIncome Tax
1,938,473 0 0 0
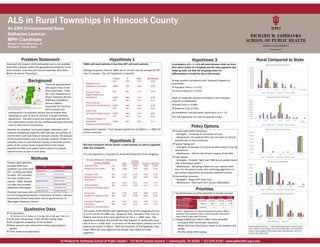
Rural Compared to State
State Average Data Source : Indiana State Department of Health. (2015,
April). Indiana Trauma Registry Pre-hospital Data Report. Retrieved from
Indiana Trauma Registry: http://www.in.gov/isdh/files/April_2015_Pre-
hospital_Data_Report.pdf