

Recomendados
Más contenido relacionado
La actualidad más candente
La actualidad más candente (20)
Similar a Va milestone
Similar a Va milestone (20)
Más de Clean Water
Más de Clean Water (20)
Último
Último (20)
Va milestone
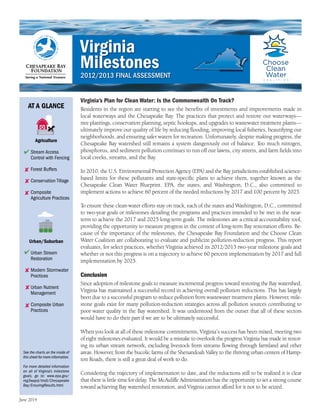
- 1. Virginia’s Plan for Clean Water: Is the Commonwealth On Track? Residents in the region are starting to see the benefits of investments and improvements made in local waterways and the Chesapeake Bay. The practices that protect and restore our waterways— tree plantings, conservation planning, septic hookups, and upgrades to wastewater treatment plants— ultimately improve our quality of life by reducing flooding, improving local fisheries, beautifying our neighborhoods, and ensuring safer waters for recreation. Unfortunately, despite making progress, the Chesapeake Bay watershed still remains a system dangerously out of balance. Too much nitrogen, phosphorus, and sediment pollution continues to run off our lawns, city streets, and farm fields into local creeks, streams, and the Bay. In 2010, the U.S. Environmental Protection Agency (EPA) and the Bay jurisdictions established science- based limits for these pollutants and state-specific plans to achieve them, together known as the Chesapeake Clean Water Blueprint. EPA, the states, and Washington, D.C., also committed to implement actions to achieve 60 percent of the needed reductions by 2017 and 100 percent by 2025. To ensure these clean-water efforts stay on track, each of the states and Washington, D.C., committed to two-year goals or milestones detailing the programs and practices intended to be met in the near- term to achieve the 2017 and 2025 long-term goals. The milestones are a critical accountability tool, providing the opportunity to measure progress in the context of long-term Bay restoration efforts. Be- cause of the importance of the milestones, the Chesapeake Bay Foundation and the Choose Clean Water Coalition are collaborating to evaluate and publicize pollution-reduction progress. This report evaluates, for select practices, whether Virginia achieved its 2012/2013 two-year milestone goals and whether or not this progress is on a trajectory to achieve 60 percent implementation by 2017 and full implementation by 2025. Conclusion Since adoption of milestone goals to measure incremental progress toward restoring the Bay watershed, Virginia has maintained a successful record in achieving overall pollution reductions. This has largely been due to a successful program to reduce pollution from wastewater treatment plants. However, mile- stone goals exist for many pollution-reduction strategies across all pollution sources contributing to poor water quality in the Bay watershed. It was understood from the outset that all of these sectors would have to do their part if we are to be ultimately successful. When you look at all of these milestone commitments, Virginia’s success has been mixed, meeting two of eight milestones evaluated. It would be a mistake to overlook the progress Virginia has made in restor- ing its urban stream network, excluding livestock from streams flowing through farmland and other areas. However, from the bucolic farms of the Shenandoah Valley to the thriving urban centers of Hamp- ton Roads, there is still a great deal of work to do. Considering the trajectory of implementation to date, and the reductions still to be realized it is clear that there is little time for delay. The McAuliffe Administration has the opportunity to set a strong course toward achieving Bay watershed restoration, and Virginia cannot afford for it not to be seized. June 2014 AT A GLANCE Agriculture Stream Access Control with Fencing Forest Buffers Conservation Tillage Composite Agriculture Practices Urban/Suburban Urban Stream Restoration Modern Stormwater Practices Urban Nutrient Management Composite Urban Practices See the charts on the inside of this sheet for more information. For more detailed information on all of Virginia’s milestone goals, go to: www.epa.gov/ reg3wapd/tmdl/Chesapeake Bay/EnsuringResults.html. 2012/2013 FINAL ASSESSMENT Virginia Milestones 6 Herndon Avenue | Annapolis, Maryland 21403 888/SAVEBAY | cbf.org How this Report was Compiled We selected a subset of implemented practices within three pol- lution source categories—agricultural runoff, urban/suburban sources, and wastewater treatment—based on their potential to provide substantial nitrogen, phosphorus, and sediment pollution reductions and offer important lessons for implementation mov- ing forward. For each practice, progress (% achievement) was eval- uated by looking at incremental progress between the base year, 2011, and 2013, compared to the 2013 milestone goal. Progress during this milestone period was also compared to the long-term (2017 and 2025) implementation benchmarks that the states and Washington, D.C., committed to in their Watershed Implemen- tation Plans. Data were provided by the U.S. Environmental Pro- tection Agency’s Chesapeake Bay Program Office. Pollution Reduction in Virginia at a Glance Virginia can celebrate its wastewater reductions, thanks to a sustained effort to reduce pollution from that sector. Virginia must now exercise that same level of commitment to the other sectors that have not performed as well. The McAuliffe Admin- istration can set Virginia on a strong course to achieve 2025 goals by accelerating programs to manage urban pollution and farm practice installation. 0 5 10 15 20 25 2025201720132011 2025 GOAL POLLUTED RUNOFF AGRICULTURE 2017 GOAL WASTEWATER/SEPTIC Modeled Nitrogen Loads and Long Term Goals in Virginia by Sector (millions of pounds) Source: Chesapeake Bay Program Watershed Model 5.3.2 Success Story Union First Market Bank purchased an abandoned lot on Barracks Road in Charlottesville,Virginia, and was building a new bank branch on the site. Rather than pave over a stream on the property to maximize parking, Union First’s management maintained and restored it, softening the stream banks and planting native trees and shrubs. Instead of a con- ventional large retention pond to collect runoff water, multiple smaller traps to infiltrate and filter runoff from the site were installed.This type of “low-impact” design is an alternative to traditional approaches. Low-impact designs like those at Union First reduce the pollution local streams receive.Although the payback on these investments can take longer than traditional approaches, when considered over the lifespan of the project, they are frequently the smarter investment. It is, how- ever, achieving more than just pollution reduction. Recreating a func- tioning ecosystem and a beautiful community space is an investment in the community. Union First’s management didn’t have to wait to see returns on this investment. “People come in and open up an account and say, ‘We want to do business with people who care about the environment,’” said Union First Market executive Rod Gentry.When you invest in your community, it will invest in you. That’s a powerful message everyone needs to hear. 0 1 2 3 4 6 2025201720132011 2025 GOAL POLLUTED RUNOFF WASTEWATER AGRICULTURE 5 2017 GOAL Modeled Phosphorus Loads and Long Term Goals in Virginia by Sector (millions of pounds) * *Pollution reduction is ahead of schedule for this sector. 706 Giddings Avenue Suite 1-B | Annapolis, Maryland 21401 443/759-3400 | choosecleanwater.org *
- 2. 0 50,000 100,000 200,000 2011 2015 2019 2021 2023 150,000 2013 2017 G 2025 0 300,000 600,000 1,500,000 2011 2015 2019 2021 2023 1,200,000 2013 2017 G 2025 900,000 MILESTONEPROGRESS MILESTONEPROGRESS 0 200,000 300,000 600,000 2011 2015 2019 2021 2023 500,000 2013 2017 G 2025 G 100,000 400,000 MILESTONEPROGRESS Assessment of Virginia’s Progress on Selected Pollution-Reduction Practices for 2013 Stream Access Control with Fencing acres Virginia exceeded its stream fencing milestone.That’s good news for the Bay, local waters, and farmers. Preventing livestock access im- proves herd health, protects shorelines, and keeps manure out of streams. Virginia should continue its successful fencing assistance program, combining state and federal resources to stretch limited dollars the farthest. 0 10,000 20,000 30,000 40,000 60,000 2011 2015 2019 2021 2023 0 50,000 2013 2017 2025 G Progress Relative to Long-Term Goals* (acres) Forest Buffers acres Virginia achieved just over half of the forest buffers called for this mile- stone period. Because of previous years’ successes, Virginia is very close to reaching 20,467 acres, the goal for 2013. However, growth of this practice must accelerate in order to reach Virginia’s 2025 goal of 100,000 acres. 0 20,000 40,000 100,000 2011 2015 2019 2021 2023 80,000 2013 2017 2025 G 60,000 Progress Relative to Long-Term Goals* (acres) Conservation Tillage acres Programs that incentivized this practice have declined as it becomes more routine for many farms.Consequently,reporting of this practice has dropped,highlighting the importance of improving systems to document farmers’efforts.Virginia intends to improve reporting through the Resource Man- agement Plan program. Enhanced outreach and adequate funding are critical. 0 100,000 200,000 600,000 2011 2015 2019 2021 2023 400,000 2013 2017 2025 300,000 500,000 Progress Relative to Long-Term Goals* (acres) Composite Agriculture Practices** acres Virginia collectively reviews farm practices to determine if two-year milestone efforts are on track.While Virginia generally met its overall agriculture goals for cropland and pasture, from 2012 to 2013, acceleration in effort will be necessary to achieve goals for 2017 and 2025. Further reflection on the status of specific practices is warranted. 0 500,000 1,000,000 3,000,000 2011 2015 2019 2021 2023 2,000,000 2013 2017 2025 G 1,500,000 2,500,000 Progress Relative to Long-Term Goals* (acres) Urban Stream Restoration feet Virginia exceeded its urban stream restoration target. This success was bolstered by increased reporting from localities during.Restoring streams enables them to flow into the floodplain during storm events, which reduces stream bank erosion. Stabilizing eroding banks reduces the detrimental downstream effects of sediment and reduces phosphorus pollution. 0 50,000 100,000 200,000 2011 2015 2019 2021 2023 150,000 2013 2017 G 2025 G Progress Relative to Long-Term Goals* (feet) Modern Stormwater (Polluted Runoff) Practices+ acres Virginia missed its milestone for installing modern polluted runoff prac- tices.Communities that implement these practices can reduce polluted runoff and recharge local groundwater systems. Providing consistent and adequate funding for these practices will encourage localities to invest in these practices. Improving urban tracking systems is also critical to success. Progress Relative to Long-Term Goals* Agriculture Urban/Suburban Polluted Runoff Urban Nutrient Management acres Although Virginia did not meet its milestone for this practice, it seems to have a specific plan going forward. In heavily populated areas of the state, the plan could focus on large homeowners’ associations to effect change on commonly managed open space, and provide access to reach the homeowners there. Progress Relative to Long-Term Goals* (acres) *2017 goals are calculated as 2009 Implementation +60% of the difference between 2009 Implementation and the 2025 Implementation goal. Composite Urban Practices++ acres Cumulative estimates of urban practice implementation indicates that Virginia is very slow in implementing measures to reduce polluted runoff. While reductions are occurring for agricultural runoff and from wastewater treatment facilities, polluted runoff efforts lag significantly. At a minimum, accelerating issuance of new permits for Virginia’s urban centers is critical. Progress Relative to Long-Term Goals* (acres) **Composite Agriculture Practices include Nutrient Management, Conservation Tillage, Cover Crops, and Pasture Management BMPs. +Modern Stormwater Practices include Infiltration Practices, Filtering Practices, Bioretention and Bioswales. ++Composite Urban Practices include stormwater management practices, erosion and sediment control, urban forest practices, urban nutrient management, abondoned mine reclamation and impervious surface reduction. 12,486 (2-YEAR INCREMENTAL PROGRESS) 2,105 (2-YEAR INCREMENTAL MILESTONE) = 593% 1,078 (2-YEAR INCREMENTAL PROGRESS) 1,838 (2-YEAR INCREMENTAL MILESTONE) = 59% -44,731 (2-YEAR INCREMENTAL PROGRESS) 103,755 (2-YEAR INCREMENTAL MILESTONE) = -43% 121,957 (2-YEAR INCREMENTAL PROGRESS) 131,641 (2-YEAR INCREMENTAL MILESTONE) = 93% 183,140 (2-YEAR INCREMENTAL PROGRESS) 42 (2-YEAR INCREMENTAL MILESTONE) = 436,048% 1,679 (2-YEAR INCREMENTAL PROGRESS) 7,950 (2-YEAR INCREMENTAL MILESTONE) = 21% -9,141 (2-YEAR INCREMENTAL PROGRESS) 22,152 (2-YEAR INCREMENTAL MILESTONE) = -41% 21,693 (2-YEAR INCREMENTAL PROGRESS) 42,504 (2-YEAR INCREMENTAL MILESTONE) = 51% P M P M P M P M P M P M P M P M P M P M P M M P M P P M P M M P MILESTONE P 2-YEAR INCREMENTAL PROGRESS M 2-YEAR INCREMENTAL MILESTONE MILESTONEPROGRESSMILESTONEPROGRESS MILESTONEPROGRESS PROGRESS MILESTONE PROGRESS
- 4. Virginia’s Plan for Clean Water: Is the Commonwealth On Track? Residents in the region are starting to see the benefits of investments and improvements made in local waterways and the Chesapeake Bay. The practices that protect and restore our waterways— tree plantings, conservation planning, septic hookups, and upgrades to wastewater treatment plants— ultimately improve our quality of life by reducing flooding, improving local fisheries, beautifying our neighborhoods, and ensuring safer waters for recreation. Unfortunately, despite making progress, the Chesapeake Bay watershed still remains a system dangerously out of balance. Too much nitrogen, phosphorus, and sediment pollution continues to run off our lawns, city streets, and farm fields into local creeks, streams, and the Bay. In 2010, the U.S. Environmental Protection Agency (EPA) and the Bay jurisdictions established science- based limits for these pollutants and state-specific plans to achieve them, together known as the Chesapeake Clean Water Blueprint. EPA, the states, and Washington, D.C., also committed to implement actions to achieve 60 percent of the needed reductions by 2017 and 100 percent by 2025. To ensure these clean-water efforts stay on track, each of the states and Washington, D.C., committed to two-year goals or milestones detailing the programs and practices intended to be met in the near- term to achieve the 2017 and 2025 long-term goals. The milestones are a critical accountability tool, providing the opportunity to measure progress in the context of long-term Bay restoration efforts. Be- cause of the importance of the milestones, the Chesapeake Bay Foundation and the Choose Clean Water Coalition are collaborating to evaluate and publicize pollution-reduction progress. This report evaluates, for select practices, whether Virginia achieved its 2012/2013 two-year milestone goals and whether or not this progress is on a trajectory to achieve 60 percent implementation by 2017 and full implementation by 2025. Conclusion Since adoption of milestone goals to measure incremental progress toward restoring the Bay watershed, Virginia has maintained a successful record in achieving overall pollution reductions. This has largely been due to a successful program to reduce pollution from wastewater treatment plants. However, mile- stone goals exist for many pollution-reduction strategies across all pollution sources contributing to poor water quality in the Bay watershed. It was understood from the outset that all of these sectors would have to do their part if we are to be ultimately successful. When you look at all of these milestone commitments, Virginia’s success has been mixed, meeting two of eight milestones evaluated. It would be a mistake to overlook the progress Virginia has made in restor- ing its urban stream network, excluding livestock from streams flowing through farmland and other areas. However, from the bucolic farms of the Shenandoah Valley to the thriving urban centers of Hamp- ton Roads, there is still a great deal of work to do. Considering the trajectory of implementation to date, and the reductions still to be realized it is clear that there is little time for delay. The McAuliffe Administration has the opportunity to set a strong course toward achieving Bay watershed restoration, and Virginia cannot afford for it not to be seized. June 2014 AT A GLANCE Agriculture Stream Access Control with Fencing Forest Buffers Conservation Tillage Composite Agriculture Practices Urban/Suburban Urban Stream Restoration Modern Stormwater Practices Urban Nutrient Management Composite Urban Practices See the charts on the inside of this sheet for more information. For more detailed information on all of Virginia’s milestone goals, go to: www.epa.gov/ reg3wapd/tmdl/Chesapeake Bay/EnsuringResults.html. 2012/2013 FINAL ASSESSMENT Virginia Milestones 6 Herndon Avenue | Annapolis, Maryland 21403 888/SAVEBAY | cbf.org How this Report was Compiled We selected a subset of implemented practices within three pol- lution source categories—agricultural runoff, urban/suburban sources, and wastewater treatment—based on their potential to provide substantial nitrogen, phosphorus, and sediment pollution reductions and offer important lessons for implementation mov- ing forward. For each practice, progress (% achievement) was eval- uated by looking at incremental progress between the base year, 2011, and 2013, compared to the 2013 milestone goal. Progress during this milestone period was also compared to the long-term (2017 and 2025) implementation benchmarks that the states and Washington, D.C., committed to in their Watershed Implemen- tation Plans. Data were provided by the U.S. Environmental Pro- tection Agency’s Chesapeake Bay Program Office. Pollution Reduction in Virginia at a Glance Virginia can celebrate its wastewater reductions, thanks to a sustained effort to reduce pollution from that sector. Virginia must now exercise that same level of commitment to the other sectors that have not performed as well. The McAuliffe Admin- istration can set Virginia on a strong course to achieve 2025 goals by accelerating programs to manage urban pollution and farm practice installation. 0 5 10 15 20 25 2025201720132011 2025 GOAL POLLUTED RUNOFF AGRICULTURE 2017 GOAL WASTEWATER/SEPTIC Modeled Nitrogen Loads and Long Term Goals in Virginia by Sector (millions of pounds) Source: Chesapeake Bay Program Watershed Model 5.3.2 Success Story Union First Market Bank purchased an abandoned lot on Barracks Road in Charlottesville,Virginia, and was building a new bank branch on the site. Rather than pave over a stream on the property to maximize parking, Union First’s management maintained and restored it, softening the stream banks and planting native trees and shrubs. Instead of a con- ventional large retention pond to collect runoff water, multiple smaller traps to infiltrate and filter runoff from the site were installed.This type of “low-impact” design is an alternative to traditional approaches. Low-impact designs like those at Union First reduce the pollution local streams receive.Although the payback on these investments can take longer than traditional approaches, when considered over the lifespan of the project, they are frequently the smarter investment. It is, how- ever, achieving more than just pollution reduction. Recreating a func- tioning ecosystem and a beautiful community space is an investment in the community. Union First’s management didn’t have to wait to see returns on this investment. “People come in and open up an account and say, ‘We want to do business with people who care about the environment,’” said Union First Market executive Rod Gentry.When you invest in your community, it will invest in you. That’s a powerful message everyone needs to hear. 0 1 2 3 4 6 2025201720132011 2025 GOAL POLLUTED RUNOFF WASTEWATER AGRICULTURE 5 2017 GOAL Modeled Phosphorus Loads and Long Term Goals in Virginia by Sector (millions of pounds) * *Pollution reduction is ahead of schedule for this sector. 706 Giddings Avenue Suite 1-B | Annapolis, Maryland 21401 443/759-3400 | choosecleanwater.org *