Know Your Market – Know Your Customer: What Web Data Reveals If You Know Where and How to Look

The Web contains billions of data points in news, opinions and conversations. Tapping into this publicly available resource is not as easy as it sounds. If you know where and how to look, you can expose fresh, new insights into markets, media and customer preferences – shortening product development cycles, maximizing revenue and gaining a competitive advantage. In this webinar deck, Connotate will share expertise gained from years of experience extracting data from the Web and making it usable. Connotate’s experts show why certain Web data sources are easy to tap into, why others aren’t – what to consider when scoping out a project. Also included: - Fundamentals of the Web data collection process (automation) - Basic differences in data sources (Deep Web, password-protected sites, social media) - How to compare cost/benefits of manual versus automated approaches - Fundamentals of sentiment analysis - Use cases illustrating how customers can gain business insights by aggregating data for cross-view comparison, interpreting online conversations to understand customer preferences, and more

Recommended
Recommended
More Related Content
Recently uploaded
Recently uploaded (20)
Featured
Featured (20)
Know Your Market – Know Your Customer: What Web Data Reveals If You Know Where and How to Look
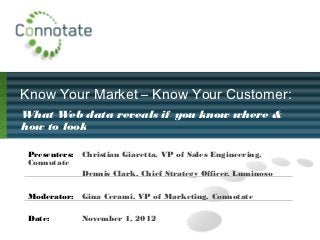
- 1. Know Your Market – Know Your Customer: What Web data reveals if you know where & how to look Presenters: Christian Giaretta, VP of Sales Engineering, Connotate Dennis Clark, Chief Strategy Officer, Luminoso Moderator: Gina Cerami, VP of Marketing, Connotate Date: November 1, 2012
- 2. Presenters Chris Giaretta Dennis Clark Vice President of Sales Engineering Chief Strategy Officer 2
- 3. Today’s Discussion • What Web Data Reveals: The Fundamentals • The business case • Where to start? Best practices and the automation process • Know Your Market • Use cases: market transparency, digital strategy, PDF extraction • Differences in data sources • Know Your Customer: Part 1 • Use case: online advertising - aggregating customer response to ads • Manual versus automated approaches • Know Your Customer: Part 2 • Text analysis – overview of options • Concept-based text analysis • Use case: consumer packaged goods • Other considerations • Q&A 3
- 4. What Web Data Reveals: The Fundamentals 4
- 5. The Business Case news – data points – public notices trillions of URLs online conversations 5
- 6. IDC Research – October 2012 • CEOs are looking at Big Data on the Web to understand their markets and customers • The number of sites with valuable content continues to expand at a tremendous rate • Factors to consider when collecting Web data • Timeliness • Legitimacy • Aggregation 6
- 7. Can I Trust Web Data for Market Research??? Good question! You may have to… factors to consider: • It’s harder and harder to get people to answer surveys • Focus groups take time – which you may not have • Proprietary data sources may not answer all of your important questions • Organizations and government agencies are moving more and more data, content and forms onto the Web 7
- 8. Can I Trust Web Data for Market Research??? Timely? Aggregate? Legitimate? YES!! YES!! Uhh… Refresh primary Volumes of data Be vigilant about research reveal insights spam and bias in Expose new The longer you Web data trends or retain it, the more Some sites are questions rapidly valuable it gets better than others 8
- 9. Polling Question: Web Data Collection Are you currently collecting data from the Web? Yes – we are doing this using an automated process Yes – however, we are collecting Web data using a manual process No – we are not collecting Web data
- 10. Where to Start? Follow Proven Best Practices Work with experts with deep experience evaluating Web sources for data extraction to help you… • Clarify “What do you really want to do with this data?” • Decide which sites to target • Identify how easy or difficult it will be to extract data from target sites • Outline the scope of the project • Estimate long-term maintenance costs (and how to minimize them) 10
- 11. Best Practices (cont’d) • Narrow your search • Scope the project • Think about the long term 11
- 12. An Overview of the Automation Process Collect Data Transform Deliver Internal Sources External Sources • Structure • Reports • Database • Social Media • Classify • Dashboards • Market Basket • Surface Web • Prep for Analysis • Workflow • Inventory, etc. • Hidden Web • BI Plug-ins •Secured Sites 12
- 13. Know Your Market: Use Cases 13
- 14. Know Your Market: Use Cases Automated, precise data collection is key to success 14
- 15. Know Your Market: What Job Postings Reveal
- 16. Know Your Market: Competitor’s Digital Strategies 16
- 17. Building Permits Reveal Construction Activity AP_Title Mr &Mrs PDF AP_Forename Samuel John AG_RefNo AG_Forename Sarah AP_Surname MacNaughton AG_Surname Bryden AP_CompanyName AG_CompanyName AP_Building Orana AG_Building 12 AP_AddressLine1 Easter Kinkell AG_AddressLine1 Southside Road AP_AddressLine2 Dingwall AG_AddressLine2 AP_Town AP_Postcode Ross-Shire IV7 8HY Excel AG_Town AG_Postcode Inverness IV2 3AU 17
- 18. Insurance Coverage Predicts Drug Sales PDF Document Excel File Drug Name Tier A/b otic 2 Abilify 4 Accolate 4 Accupril 4 Accuretic 4 Accutane 4 Acebutolol HCL 2 Aceon 4 (1/2) Acetaminophen w/ codeine 2 Acetasol HC 2 Acetazolamide 2 Aciphex X Aclovate ointment 4 Acticin 2 Activella 4 Actonel 4 Actoplus met 3 Actos 3 18
- 19. Benefits of Using Automation to Understand Markets and Market-Moving Events • Reduce costs associated with manual processes • Speed up processes by doing this continually instead of sporadically • Improve accuracy • Repurpose data for new uses by converting PDFs and other unstructured data into a Excel, XML or other usable formats 19
- 20. Differences in Web Sources 20
- 21. Automation Opens Access to Deep Web and Secured Sites 21
- 22. Know Your Customer: Buyer Behavior 22
- 23. Altitude Digital – Buyer Behavior in Real Time • Push the boundaries of “Big Data” in interactive advertising • Use Connotate to collect real-time Web data • Increase clients’ ad revenues by 30% - 300% • Continually display aggregated dynamic ad exchange data • Publishers view real-time, side-by-side comparisons of online ad traffic • They can instantaneously optimize ad placement Many of these sites are password-protected…. not a problem! 23
- 24. 24
- 25. Manual versus Automated Approaches Your Data Needs To Automate or Not? ? May want to consider Complex product-matching tasks crowd sourcing Small amount of data, needed a few ? A manual approach may times per year suffice Specific external data (under $5K/year) ? Purchase from 3rd party High volume data monitoring Automate Variety of sources Automate Frequent updates and/or monitoring Automate Need for data post-processing Automate 25
- 26. A Closer Look at Different Approaches Approach Considerations Manual offshore No economies of scale; human error compromises quality. A viable approach for complex tasks like product matching Crowdsourcing of apparel for one-shot projects; may be less reliable for ongoing monitoring and long-term projects. Not resilient; scrapers break when Web page HTML In-house or low-cost changes, creating a maintenance headache; scrapers Web scrapers may not monitor well or support scheduling. High degree of control; better resiliency to change but should Robust automation consider project complexity and future need to add new Web installed on-premise sources on short notice. Highest resiliency; no maintenance burden; 24/7 follow-the- Robust solution hosted sun support; infinitely scalable and no capital expenditures by vendor for hardware or IT resources. 26
- 27. Polling Question: Data Analysis What type of data analysis tools do you use? Only basic tools – Excel spreadsheets, etc. Text analysis and basic tools Applications built in-house and basic tools None
- 28. Know Your Customer: Sentiment Analysis 28
- 29. Text Analysis Options Main ‘Schools’ of Text Analytics Understanding through Data Machine Learners •Learn meaning through correlations Understanding through Instruction Ontologists •People tell computers what words mean Concept-based text analysis Luminoso Approach •Know the “Common Sense” about the world •Add new connections from datasets 29
- 30. Language is Creative It was really stuffy. It smelled terrible. It was like it had Smells like an been shut away old house. for a long time. Was like a wet dog. Smelled really musty. Reminds me of Really stale. a dusty closet.
- 31. Concept-based analytics has… • Shown how reaction to product scent changes with price point • Determined the customer segments for a sports Web site • Discovered if customers notice unannounced in-store policy changes • Matched those who should connect at a large enterprise software company’s user conference
- 32. Digital Intuition We boil down the meaning of text into actionable, mathematically justifiable insights.
- 33. Speed and Scale Big Data • Small Data • Streaming • Dynamic
- 34. Case Study: Swiffer SweeperVac Consumer product design example: Swiffer SweeperVac Use social data on Twitter to understand customer Idea reactions to product design Result Failure. Twitter lacks depth. Better Idea Product Reviews 34
- 35. Obtaining Customer Sentiment from YouTube Manually search YouTube for <“product name”> <“review”> Use the Connotate automation package to follow links to individual video reviews and more results Use Connotate to extract comment text Feed input into analytical engine to reveal sentiment Graphical User Interface/Presentation of Insights 35
- 36. Swiffer Dataset 36
- 37. Swiffer Features: 37
- 38. The Value of the Data is in the Delivery 38
- 39. Another Look at the Automation Process Connotate Connotat Connotat Partners e e Collect Data Transform Deliver Internal Sources External Sources • Classify • Reports • Database • Social Media • Structure • Dashboards • Market Basket • Surface Web • Prep for Analysis • Workflow • Inventory, etc. • Hidden Web •Secured Sites • BI Plug-ins • Connotate provides precise quality data, structured for delivery to your analysis and presentation tools. • Connotate maximizes the value of your investment in business intelligence, text analytics and semantic analysis tools. Excel Excel 39
- 40. Web Data Can Reveal Insights of Tremendous Value Automation Valid insights reduces the cost require precise, of monitoring quality data Web sites for updates Automation is the key to Automation extracting makes it easier precise, to collect data quality data for trending 40
- 41. Web Data Can Reveal Insights of Tremendous Value Spot market Detect changes trends faster to regulatory sites, download Detect shifts in PDFs and competitor’s extract data digital strategy Obtain new Monitor buyer insights into behavior online customer and in preferences aggregate 41
- 42. Q&A Connotate will email a link to this presentation as well as a copy of the slides to you within 2 business days. If you have an immediate need and would like us to contact you about a forthcoming project, please check the appropriate box in the last polling question or call (+1) 732-296-8844. For more information, you may also visit www.connotate.com or www.connotate.co.uk. 42
- 43. Thank You If you have an immediate need and would like us to contact you about a forthcoming project, please check the appropriate box in the last polling question or call (+1) 732-296-8844. For more information, visit www.connotate.com or www.connotate.co.uk 43
Editor's Notes
- Gina: Welcome to today ’s presentation, Know Your Market – Know Your Customer: What Web data reveals if you know where and how to look.“ My name is Gina Cerami, and I ’m the Vice President of Marketing here at Connotate. This presentation seeks to explore what Web data can reveal about markets, market-moving events, buyer behavior and customer preferences to help uncover real insights that create new value for your business. This presentation will last approximately 40 minutes, followed by a live question and answer session . Also, during the presentation, we will pose several survey questions which you may answer using the mechanism at the right of your screen.
- Gina: We still have some folks logging in. While we ’re waiting, I’d like to take a moment to provide a bit of background about Connotate. Our heritage is in leading-edge research conducted at Rutgers University, funded in part by DARPA. For over a decade, our focus has been to discover the most efficient ways to extract value from Web data. Connotate is an expert in this field. We have been helping global clients like the Associated Press, Thomson Reuters, Dow Jones and many others leverage “ free” Web data for strategic advantage. Today, we will share best practices that we’ve developed over the years. We hope this information will help you get more value out of any Web data project you may attempt, either now or in the future. Our presenters today are Chris Giaretta , Vice President of Sales Engineering at Connotate, and Dennis Clark , Chief Strategy Officer at Luminoso.
- <Gina> To set the foundation for our topic today I will take a few moments to talk about the importance of including web data in your market research efforts and then Chris will dive into a number of specific applications and use cases for bringing web data into your research mix. After Chris walks you through his series of case studies, Dennis Clark from Luminoso, our partner in the concept based text analysis space – will present an interesting way to visualize the market research data that they ’ve been collecting on a well-known consumer packaged goods item - Swiffer. Throughout the presentation, we will be conducting a series of polling questions to better understand you are using web data for their research efforts.
- <Gina> Now let ’s get started by discussing the Business Case for Using Web data, as well as the Fundamentals of Where and How to Look for Web data – and Why enterprises are doing this today.
- <Gina> Virtually every organization today is data-driven in some respect. The Internet is the largest storehouse of public data ever assembled. The business cases for tapping into the Web is compelling—the data is freely available, constantly updated and covers every topic imaginable. However, there are many pitfalls – is the data legitimate? Is it easy to get? Where do I start? Today ’s presentation looks to answer these questions. We’ll explain the technology that is commercially available today to help you capture the precise Web data you need to see market changes, understand your customer’s preferences in real time and refine product development. We ’ll look at the capabilities as well as the limitations of current technology, and how you can use this technology to turn the Internet into your own CONTENT data base.
- <Gina> According to independent research produced by IDC in October 2012, CEOs are looking to leverage Big Data for business advantage – and more and more, they are turning their attention to the Web to better understand their markets and their customers. At the same time, the number of Web sites continues to expand rapidly, and it ’s quite a challenge to collect the right data and pull it together in a useful way. So why try? According to IDC, there are three factors to consider: timeliness, legitimacy and aggregation.
- <Gina> When it comes to Market Research, seasoned professionals in the business understand the value of statistically accurate surveys and well-crafted focus groups, and how to use the data they produce. So, why use Web data? When you think about using Web data to better understand markets, customer preferences and buyer behavior, remember that you are supplementing traditional forms of research---not necessarily replacing them. Web data can reveal some insights that traditional research cannot….and vice versa. At the same time, it is getting harder and harder to get people to answer surveys, and this trend will continue. In addition, young adults do most of their commerce and conversations online and it makes sense to leverage this growing pool of data. On a final note, while there may be highly accurate, proprietary data sources available for a price, they may not answer all of your questions, or they may produce information overload….when you only want precise answers to very specific questions.
- <Gina> So, Web data can be very valuable…to supplement traditional research methods and answer very specific questions. Let ’s look a the three characteristics of Web data cited by IDC. First, Web data is timely- --the real-time nature of the Web can expose trends long before traditional research….as well as reveal pertinent, timely questions that may guide a traditional research effort. Next, Web data is ideal for aggregation and trending because there is lots of it. Later on, …we ’ll show how real-time comparisons of aggregated web data reveal buyer behavior in powerful ways that impact revenue. Finally, you must consider legitimacy . Many product reviews and posted comments are biased. Angry consumers are more likely to post negative reviews; companies pay writers to post reviews. In addition to bias, you need to be vigilant about spam. If you are indiscriminately scraping Web data, you will collect an enormous amount of spam. You need to choose your sources carefully and select a sophisticated automation solution that can precisely collect the data that will answer your questions. In a few minutes we ’ll talk about which Web sources might be more trustworthy.
- Gina Let ’s take a moment to ask our audience about their experiences with automating the process of collecting market intelligence from the Web. Is it an automated process? Are you doing it manually? Or, are you not collecting Web data at all? Also, I ’d like to remind the audience that they can use the Chat feature on their screen to submit questions to the presenters for our Q&A session at the end. Now I’m going to turn it over to Chris Giaretta of Connotate who will give you some tips on how to get started on a Web data collection project.
- <Chris> So, where do you start? Fortunately, best practices are emerging to help you answer this question. Speaking from years of experience helping clients, I ’d say you need to start with deciding, “what do I want to do with this data?” It sounds simple, but in many cases, it’s harder than it sounds to clarify your ultimate goal. Next, you decide which sites to target. Again, many customers say to me “I’m not sure where to start” and typically, I’ll say: Who are your competitors? (that ’s a good source of Web sites) How do you sell? Maybe your resellers or distributors ’ sites would give you more visibility into your customers as well as your supply chain What about user forums or blogs discussing your products or services? Government Web sites are often excellent sources – on the local, state and national levels. Government sites post court filings, building permit applications, insurance coverage limits and many other types of data
- <Chris> At this stage, after examining your options, if you still need to narrow down your options, it may be possible to apply automation to leverage Google and other search engines to refine the scope of your project. Once you have the list of URLs, we can help you identify the sites that are easy to access versus those that aren ’t. (Chris, can you give some examples?) Next, you need to think about scoping the project. How many sites? How often do you need to monitor and/or collect data? It ’s important to be flexible here and to work with someone who will take the time to understand your needs and adjust the scope/direction of the project, if needed to deliver you the most value. Finally, you ’ll want to look in the long-term and consider the maintenance costs of your project, and how to minimize them. Deploying software on-site gives you the most control, but you’re carrying the ball when it comes to maintaining the solution and expanding scope quickly if need be. A hosted deployment eliminates those headaches and can be more cost-effective in the long-run. Although each project is different, underlying fundamentals of the automation process are the same across virtually all projects. We will explore the automation process in the next slide.
- <Chris> Let ’s take a look at the automation process for leveraging Web data. Any automated approach will follow a process consists of three phases. The first phase is Collecting data. It is important to identify sources of reliable data and extract this information on a regular basis. We will talk about the differences in data sources in a minute. During the second phase, you need to convert this raw disorganized unstructured data into a format digestible by spreadsheets, text analytics tools, databases or business intelligence systems. It is during this transformation phase that data is cleansed, normalized, preprocessed and groomed for analysis. The last phase is Delivery, where the actual analysis of data occurs and there is a presentation of results via spreadsheets, data streams, dashboards or reports. Connotate handles the first two phases; our precise data collection makes it possible for analytics and business intelligence applications to analyze and present insights to help you make better business decisions. Luminoso is one example of a tool that handles the 3 rd phase of Delivery; Dennis Clark will explain Luminoso’s approach to analysis and delivery later on in this presentation.
- Chris Now, let ’s take a look at several cases where Web data, collected using automation, revealed new insights about markets and market-moving events.
- Chris: Here are three examples illustrating how Web data can reveal insights about markets and competitors. Case #1. Investors involved in buy-side or sell-side research can monitor company Web sites in a particular sector, collecting job postings, housing units available, hotel rooms booked and other metrics to gain transparency into market and company performance prior to quarterly earnings releases. Market researchers in this segment may also be interested in these findings. Case #2. An insurance company monitors Google paid ads and search rankings to better understand their competitor ’s Digital Strategies, how they are doing compared to their competitors and to spot shifts in competitors’ tactics. Case #3. A Market Research firm monitors the government Web sites for new postings of building permits to gain insight into the construction and real estate markets. The company also downloads the PDFs on the sites and automatically extracts data for further analysis. Another firm obtains transparency into predicting sales volume at pharmaceutical firms by monitoring regulatory sites posting changes in insurance coverage of specific drugs. Next, we ’ll show you the data collected for each use case. Later on in the presentation we will also discuss case studies in Online Advertising and Consumer Packaged Goods.
- Chris: In this first case study we are monitoring job postings on company web sites. The graph at the left shows job postings over 9 months for GE, Citigroup, Cisco and IBM. The data was collected by Connotate and fed into Excel spread sheet for analysis and display. This 9-month period happens to be a very interesting one…the first nine months of the recession that started in 2008. So, naturally there is an overall downward trend during this time period. But in mid-November, we see a huge drop off in job postings at Cisco, which is in light blue. This is an important data point for any firm tracking investments in Cisco. It might be of interest to Cisco ’ s competitors as well…or suppliers, for that matter. Two months after this drop in job postings, Cisco reported a 7.5% year-over-year decrease in net sales and a 27% decrease in net income. Would an investor have sold the stock in November based on job postings? Maybe not, but it is a valid data point that any investor would want to know as soon as it happens. At the top right, we ’ re tracking job postings over a shorter period – 3 months – for Walmart, UPS, and several other companies. We see that UPS had a big uptick in February—mid-quarter and prior to the earnings release. This could be an early indicator that quarterly earnings will beat estimates. In this case, that didn’t occur…but it still raises a question worth looking into. There are two important points to note here: first , over the collection period, no human had to go onto these sites and collect this manually. The entire process was automated…making it more cost-efficient and less error prone. The second point is that the timeliness of Web data can help you quickly identify questions for further investigation. Without the Web data, you might not know enough to ask the question…until after the fact.
- <Chris> Here, we are monitoring organic search rankings and paid ads of Insurance companies to reveal insight about the Digital strategies of these insurance companies. At the top, you see the data about paid ads for 10 insurance companies. The Pie chart at left represents the activity as a snap shot in time. The columns to the right show the average rankings over 90 days, 30 days and today. Looking at the trends, we can see that average rank today for most competitors is not that different than average ranking over 30 or 90 days. However, if a big change were to occur in one company, this might indicate a shift in tactics for that company’s digital strategy. At the bottom, we see are monitoring the First Page Results on keywords related to the term “Insurance”. You will notice that the top 5 Web sites with the most first page rankings aren’t insurance companies at all---but sights like wikipedia, amazon, linked in, the New York Times, etc. That may mean that your digital strategy should include exploring how you should be represented on those sites. It’s important to note that if you use a tool such as TrafficTravis or RankIt to monitor page rankings on competitior’s sites, your results are limited to the specific sites that you feed to the tool. That is certainly worth some value but additional insight can be gained by an open ended approach like this one which shows you the top places where people are directed to when they type your search terms into Google…and more importantly, how those results are tracking over time. Here ’ s how this process works. You are providing Connotate with a list of relevant search terms. Connotate collects the list of URLs showing up in the natural search results well as the results showing up in the paid ads. Connotate automates this process, doing in every day, converting the data into Excel to create a time series to see the trends. Doing this manually would be cumbersome and cost-prohibitive. Automation makes it easy. You set it up and it just keeps monitoring and collecting the data. With this information you can know more about trends in the Digital Strategies of yours competitors – and it can also spot shifts in tactics of specific competitors. We could also take this a step further….let’s say GEICO decided to dramatically decrease its investment in paid ads….and our Web data report shows this drop in rankings within days. You could peel behind the data a look for more specific terms…maybe there was a drop in ads for car insurance but not renters insurance. With Connotate, the data you collect can be filtered and aggregated in numerous ways to answer the precise questions that matter most to your business.
- <Chris> In this example, home construction permits are filed with a local government and made publicly available on the government web site. Each permit reveals insights into the planned work – materials used, types of enhancements, magnitude of work, etc. By collecting this data over time and viewing it in aggregate, you can detect trends, identify demands for certain materials, and, in general, keep a pulse on the construction industry as things are happening. With automation you can monitor this site 24/7 and detect when new permits are posted – AND you can also download the form and extract the data from the PDF and turn it into useable data such as Excel, XML, etc. We’ll show another example of PDF extraction in our next slide.
- <Chris> In this next case, we are monitoring web sites of government regulatory agencies where insurance companies must post the dollar amounts of coverage for different drugs. For example, Tier 2 coverage may equate to $10 while Tier 4 coverage indicates a different dollar amount. The dollar amount of coverage provided by insurers for that drug is a good indicator of future sales for that drug, as doctors will tend to prescribe the drugs that have better coverage. When insurers change their coverage of a particular drug, they must file with regulators. PDF documents with this information are posted on the government Web site. However, each document posted may be many pages long with only one or a few changes buried within the revised PDF. Today, companies who want to monitor these changes to predict drug sales often follow a manual process of logging on to regulator sites to check for updates, downloading the PDFs, reading through the document for the changes and typing in the new information. Connotate can automate four aspects of this process: Continually monitor the Web site for new postings Detect changes and download the revised PDF Extract the PDF data into usable format (Excel) Highlight the changes This automation process can save countless hours of manual labor devoted to watching Web sites, downloading documents and re-keying - as well as improving accuracy.
- <Chris> So we can see that another benefit of automation is the ability to extract data from PDFs, as well as continually monitor Web sites for changes. This combination is really powerful – instead of manually going on sites, downloading forms and re-typing, you can automate virtually the entire process, saving thousands of man hours of work. .
- Chris Since we ’ve been talking about collecting data from the Web, I’d like to drill down and talk about the differences in Web data sources – including how easy or hard it is to access those sources. Social media sites such as Facebook and Twitter offer APIs which make it easier to programmatically extract data, but many times they contain high volumes of irrelevant information, making it difficult to find valuable market intelligence or customer conversations revealing useful insights. Many times, valuable data comes from Niche Sites and microblogs that either do not have APIs or it is cost-prohibitive to implement API data interface. Sites like these offer the most valuable nuggets – that ’s where product fanatics congregate and you can find sincere reviews and opinions. These data points may be several layers deep into the site, and you must follow multiple links to get to the data. Often times, it is more likely to find posters with less bias further down in Deep Web. Password protected sites, requiring registration, are often good sources of information, as will see in our next Use Case example.
- Chris The right type of automation can ensure scalability, reliability and easier access to Deep Web and password-protected sites to obtain market research data. Connotate can help you with this process to deliver Web data automatically. Now I ’ll turn it back over to Gina to discuss how Web data can reveal insights about your customers in real time
- Gina Next, we ’ll take a look at what AGGREGATED web data can reveal about buyer behavior in real time.
- Gina In this case, we ’re looking at how customers are reacting to online advertisements in real time. Altitude Digital Partners is supply-side platform in the online advertising industry that empowers publishers to maximize their online revenue. Altitude Digital Partners was recently ranked #54 in the Inc. “Fastest Growing Company List”. Here ’s how Altitude Digital is using automation in Web data collection and aggregation: Connotate gathers real-time data from over 100 ad networks, many of which are password-protected Connotate structures the data so it can be displayed in aggregated format by Altitude Digital Partner ’s Next Generation SSP interface Altitude Digital can now update an entire month ’s worth of statistics in six minutes
- <Gina> This slide shows you the aggregation of the data across publishers and ad real estate—this is the REAL value of Connotate and what we can deliver….insights from the Web that can only be obtain from precise, real-time Web data collection. The beauty in this client application is that Altitude Digital is gathering data from 100 separate ad networks (including password protected ad networks). The data is aggregated into a single database and then presented to their clients via their ad optimization solution interface. Having the data from 20 ad networks in a single view benefits Altitude Digital because they have freed up 25 hours of work per day (yes, 25 hours per day so that ’s more than 3 people per day) – this is a cost savings for them of over $100,000 annually. On the client side, Altitude Digitals clients have more visibility into their ad spend and how effective it is across a network. So they now have the ability to quickly change and optimize ad spends which has resulted in an increase of clients ’ ad revenues by 30% - 300%.
- <Gina> All of these actual case studies mentioned achieved results by following a fully automated approach. But there may be certain instances when using a manual approach to capturing Web data is best. At Connotate, we hear a lot of different data needs from all different kinds of companies and we understand that an automated solution is not always the answer. There are times when we don ’t recommend changing your aggregation efforts to an automated solution. First… When we see a company that needs to do a lot of complex product matching---let ’s say, for apparel—we may recommend crowd sourcing as a viable approach. Or -- if you have a Small amount of data that you need only a few times a year – you may not need a scalable, automated approach. On the flip side, scenarios that warrant an automated solution include situations where A lot of internal and external data needs to be aggregated and / or you need to monitor a variety of sources. But if you are dealing with high volumes of data – or Web sites which change frequently, it quickly gets very expensive to have your staff continually check sites and look for changes.
- <Gina> Let ’s take a closer look at the pros and cons of various approaches. Some applications lend themselves to using manual approaches and crowdsourcing, but there is always the risk of introducing human error. A bigger concern is the fra gile nature of the Web. The Web changes all the time. Many projects require continual monitoring for changes; and change detection with highlighting to support workflow productivity. A robust automated solution such as Connotate ’s will provide that. More importantly, will the solution “break” when the HTML on the page changes. Connotate’s patented visual abstraction solution is designed to be resilient to certain changes; if the page is competely changed, customers using our hosted solution don’t have to worry – we get the automation up and running quickly which isn’t the case for scrapers and data providers. Without a true monitoring service and dynamic platform, a single pull system or fragile system only delivers a fragment of the value and doesn ’t allow for the time series analytics that organizations need today.
- Gina In a moment, we ’re going to turn our attention to using advanced analysis tools to understand customer preferences using social media. So I’d like to pause and ask our audience about their experiences with data analysis tools: What type of data analysis tools do you use? As you are answering those questions, I ’d like to introduce Dennis Clark from Luminoso, who will talk in more depth about Analysis Tools. As a spin-out of the MIT Media Lab, Luminoso brings an unparalleled level of insight to text data. While there are many tools on the market today that can interpret statistics, demographics and other quantitative data, Luminoso is instead focusing on bringing new discipline to the ability to analyze text (natural language processing). Luminoso addresses this need by providing a fast, scientific option for understanding text.
- Gina Next, we ’ll take a look at what web data reveals about customer sentiment. In order to see these insights, we’ll need to feed web data into an analysis tool. Dennis Clark of Luminoso will now walk us through the fundamentals of text analysis.
- Thanks Gina. <Dennis> Before I get started, it’s worth breaking down the field of text analysis a bit. First, machine learners. Machine learners try to use the statistical correlations between words in a corpus to understand what’s going on;
- <Dennis> Why concept-based text understanding?
- <Dennis> Over the past twelve years, we've built a unique model of how people think about the world. Big data and small data. This technology is incorporated into a software as a service dashboard product that is used it to turn text data into actionable business insights.
- <Dennis> Slides and narrative about the Swiffer example.
- <Dennis> Let ’s walk through the process of how we decided what sites to look at and how to extract the comments. <<Dennis…say something about how great Connotate is and what it does>> First we did manual trial and error to find the right message boards and other online sources with reliable data. Once we found them, we used Connotate to monitor these sites over a period of time. For example, for YouTube, we put in the search terms “review” and the name of the product. <Click> Then we used Connotate to automatically extract customer reviews <Click> Connotate was able to go deeper and follow relevant links to get additional product discussions. <Click> Using the analysis tool, the company was able to determine that even though the product was well-received, there was some dissatisfaction with certain aspects of <<<describe Insights gained>> when using this product. Customers were fine with the higher price as compared to the competition but they were expecting a more superior feel. Guess what? This manufacturer is already working on the necessary design adjustments without making any pricing changes. FOR THIS MANUFACTURER, obtaining RAPID consumer feedback for PRODUCT DESIGN improvements – a big win. Could the same insights be gathered via focus groups? Maybe. But it would have taken longer. In cases where focus groups are already taking place, results like these can confirm what focus groups find….or challenge those results and trigger a closer look.
- So this is our visualization of all the concepts that occur in the SweeperVac review dataset. Larger words are of course mentioned more relative to usage in standard English and …
- This view shows words that express more negative sentiment to the right and less to the left, along with words that are more related to “battery” towards the top and less related on the bottom. What we see is that the battery life is a negative -- negative terms like “gripe,” drawback, and quit show up on the list of top terms most related to battery life and we can see “battery life” in the upper-right Quadrant here, suggesting that there are substantial negative connotations. Digging down into the documents by simply clicking on “battery life” shows the complaints: the battery runs out very quickly for a Significant number of customers, a clear area to be addressed in the next generation of product design. Now I’ll turn it over to Gina, who will talk about various options for Data Delivery.
- <Gina> That was an excellent example of visualizing data using a concept-based analytics tool. It ’s important to note that Web data can be delivered in many different ways, it all depends on what strategic advantage you are trying to glean. For some organizations, all they want is the Web data to be delivered in a simple structured format like a table or xls file – this way they can feed the data directly into a database. For others, they want the Web data delievered as XML so that it can be fed directly into a system or workflow. Yet others, will feed the data into another 3 rd party analytics tool to visuallize entity relationships. The ways in which you can consume the data are endless. You just need to know what the strategic question is that your trying to answer.
- <Gina> During the past 30 minutes, we ’ve provided several real-world examples that used different tools at different points in the automation process. So let’s take a minute to look at what we’ve talked about and relate it to the three phrases of the automation process we discussed earlier.
- <Gina> Before we conclude the formal part of today ’s presentation, I’d like to offer some key take-away points the value that Web data might bring to your organization. There is a vast wealth of market research data on the Web; today we ’ve touched on just a small portion of what’s available. Automation is the key to success in obtaining precise, quality data which can provide insights for better decision making. With automation, you can easily monitor Web sites 365 days a year for changes and grab those changes as soon as they happen to make faster decisions. Automation also makes it easier to collect data over time for trending.
- <Gina> Advanced Analytics such as concept-based text understanding can help reveal brand new insights from Web data. We covered a number of use cases for collecting Web data - there are many other examples as well. You may be thinking of other strategic initiatives in your own organization. If so, we hope that you have found today ’s presentation helpful in discovering some of the aspects you need to consider as you decide the next steps in your project.
- <Gina> Now, for your questions. Several of you have asked about obtaining a copy of today ’s presentation. We will send you a link to the archived presentation within 2 business days. We also invite you to answer our last poll which appears on the right of your screen. (Poll) , “Do you believe automated Web data collection can provide value to your market research efforts?” -----------------
- Thank you for attending today ’s Webinar. Please visit our Web site for information about our products, services, and future Webinars. This concludes our presentation.