Boyle County, Kentucky Employment Report: Q1, 2012
•
0 likes•318 views

This is the First Quarter 2012 employment report for Boyle County, Kentucky, compiled from employment data monitored by the Boyle County Industrial Foundation.

Recommended
Recommended
More Related Content
What's hot
What's hot (18)
Similar to Boyle County, Kentucky Employment Report: Q1, 2012
Similar to Boyle County, Kentucky Employment Report: Q1, 2012 (20)
More from Danville-Boyle County Economic Development Partnership
More from Danville-Boyle County Economic Development Partnership (20)
Recently uploaded
Recently uploaded (20)
Boyle County, Kentucky Employment Report: Q1, 2012
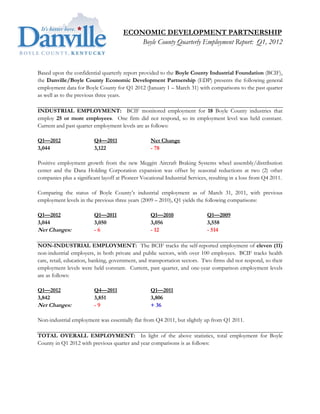
- 1. ECONOMIC DEVELOPMENT PARTNERSHIP Boyle County Quarterly Employment Report: Q1, 2012 Based upon the confidential quarterly report provided to the Boyle County Industrial Foundation (BCIF), the Danville/Boyle County Economic Development Partnership (EDP) presents the following general employment data for Boyle County for Q1 2012 (January 1 – March 31) with comparisons to the past quarter as well as to the previous three years. INDUSTRIAL EMPLOYMENT: BCIF monitored employment for 18 Boyle County industries that employ 25 or more employees. One firm did not respond, so its employment level was held constant. Current and past quarter employment levels are as follows: Q1—2012 Q4—2011 Net Change 3,044 3,122 - 78 Positive employment growth from the new Meggitt Aircraft Braking Systems wheel assembly/distribution center and the Dana Holding Corporation expansion was offset by seasonal reductions at two (2) other companies plus a significant layoff at Pioneer Vocational Industrial Services, resulting in a loss from Q4 2011. Comparing the status of Boyle County’s industrial employment as of March 31, 2011, with previous employment levels in the previous three years (2009 – 2010), Q1 yields the following comparisons: Q1—2012 Q1—2011 Q1—2010 Q1—2009 3,044 3,050 3,056 3,558 Net Changes: -6 - 12 - 514 NON-INDUSTRIAL EMPLOYMENT: The BCIF tracks the self-reported employment of eleven (11) non-industrial employers, in both private and public sectors, with over 100 employees. BCIF tracks health care, retail, education, banking, government, and transportation sectors. Two firms did not respond, so their employment levels were held constant. Current, past quarter, and one-year comparison employment levels are as follows: Q1—2012 Q4—2011 Q1—2011 3,842 3,851 3,806 Net Changes: -9 + 36 Non-industrial employment was essentially flat from Q4 2011, but slightly up from Q1 2011. TOTAL OVERALL EMPLOYMENT: In light of the above statistics, total employment for Boyle County in Q1 2012 with previous quarter and year comparisons is as follows:
- 2. Boyle County Employment Report: Q1, 2012 Page 2 Q1—2012 Q4—2011 Q1—2011 6,886 6,973 6,856 Net Changes: - 87 + 30 OVERALL LABOR FORCE STATISTICS: For all sectors of the Boyle County economy, the Kentucky Office of Employment & Training reports the following data for Boyle Countians in the most recent quarters available: Mar ’12 (Q1) Dec ’11 (Q4)* Change Employed 11,037 11,176 - 139 Unemployed 1,270 1,282 - 12 Unemployment Rate 10.3% 10.3% 0% (*adjusted) A map of unemployment rates for all Kentucky counties for March 2012 may be viewed at: www.workforcekentucky.ky.gov/admin/uploadedPublications/1248_March_2012_UR.pdf. An annual comparison of unemployment rates reveals the following: Mar ’12 Mar ‘11 Change Unemployment Rate 10.3% 11.9% - 1.6% A map of changes in unemployment rates for all Kentucky counties from March 2011 to March 2012 may be viewed at: www.workforcekentucky.ky.gov/admin/uploadedPublications/1247_March_2011_to_March_2012_Change.pdf. Please contact the EDP if you have any questions or have any suggestions about how this quarterly report can be more meaningful to you, your organization, or agency. For more information: Jody A. Lassiter, JD President/CEO Danville/Boyle County Economic Development Partnership (859) 236-2805 jody@betterindanville.com