
Recommended
Recommended
More Related Content
More from DataJournalismUK
More from DataJournalismUK (20)
Recently uploaded
Recently uploaded (20)
Christine Jeavans: The Year in Data Journalism at the BBC
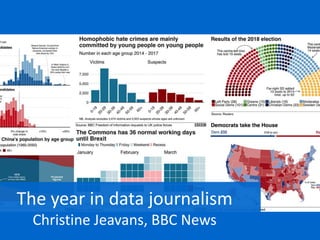
- 1. The year in data journalism Christine Jeavans, BBC News
- 2. • Stories and formats • Changes to how we work with R • Lookups and charts for Brexit votes
- 3. Global calculators How long are you going to live? - 14 May 2018
- 4. Investigation & analysis Fewer crimes ending with charges - 16 May 2018
- 5. FOI data Critically injured? The longest waits for 999 help - 6 March 2019
- 6. Changes in how we work with
- 7. Changes in how we work with
- 8. Changes in how we work with
- 9. Changes in how we work with
- 10. R cookbook
- 12. Brexit votes
- 13. Brexit votes
- 14. Brexit votes
- 15. Thank you! @bbcnewsgraphics @chrisjeavans Medium: @bbc_visual_and_data_journalism Cookbook: bbc.github.io/rcookbook/
Editor's Notes
- I work in the BBC’s data team in London. We are a group of data journalists with a range of skills and backgrounds. We also have a data designer, Irene, in our team. And we work with two data scientists – Maryam and Alison – and with Robert Cuffe who is the BBC’s head of statistics.
- These are examples of some of the work that we do. We do a lot of calculators with big data sets. Global life expectancy –This shows life expectancy at all ages. Global Burden of disease study – 198 countries. Five year age bands Do it once and then get lots of different uses out of it – stories, sections, audiences This was translated into 31 languages Hausa and Urdu had big reach also eight new languages for BBC inc Pidgin https://www.bbc.co.uk/news/health-44107940
- BBC Panorama Long investigation It was open data but very hard to find Millions of data points because had every permutation of a recorded crime with its outcome. Wesley’s data analysis underpinned panorama. Version for each Police Force – sent out a pack for all the Nations and regions so they could do their own versions Also explore data again Here is Manchester version Has led on to better understanding of crime data – work with the newsroom when new crime figures come out https://www.bbc.co.uk/news/uk-44044537
- FOI data Postcode DISTRICT Overview top line for the news story Overview map Explore map Regional stories https://www.bbc.co.uk/news/health-47362797 https://www.bbc.co.uk/news/uk-england-norfolk-47456439
- We have been increasingly using the programming language R for the past two years to carry out data analysis. Everyone on team has different levels of expertise. All learning from each other. It can handle complex tasks and is reproducible and highly adaptable. So R could cope with the heavy-lifting on this project with eight million residential property transactions to work out real terms house prices. https://www.bbc.co.uk/news/business-41582755 But for quick turnaround graphics we use in-house tool, which is easy but has limitations, or designers – not best workflow
- A year ago, we started to look into how we could make production ready graphics within R itself. This is what you normally get – ggplot2 chart
- This is with BBC styling
- Fully ready for the website with correct alignment and BBC blocks
- All these charts and maps were made with R. Team put together a cookbook so that everyone in Visual Journalism can do their own charts Frees up designers for more specialist work, illustration, UX, thematic graphics etc
- Made cookbook available as open source, along with bbplot package – so anyone now can reproduce graphics in BBC style, with their own logo. Or use the cookbook as basis for charts and then apply own style Medium post bit.ly/2Nkpk2d Cookbook on github bbc.github.io/rcookbook
- In the Autumn planning for meaningful vote. Maryam our data scientist looked into possibilities. Found Politics team were using the Commons Votes app and manually going through the list. Two person job, lengthy, error prone Found way to get API to turn into CSV files which we could use. Talked to Commons digital team. When there is a vote we can produce a lookup as soon as the division data comes through.
- We also use R scripts to do a very fast turnaround bar chart for live page And then when the division spreadsheet arrives we do a breakdown
- There have been 15 debates, some with multiple divisions so we have made great use of the lookup procedure and the R scripts