SlideShare a Scribd company logo
1 of 13
Download to read offline
Monthly IndicatorsA RESEARCH TOOL PROVIDED BY THE GREATER BOSTON ASSOCIATION OF REALTORS®
February 2014 Quick Facts
- 5.2%
Year-Over-Year
(YoY) Change in
Closed Sales
Single-Family Only
It's tempting to confuse market normalization with a possible slowdown. But
those equipped with high-quality MLS data know better. As mortgage
delinquencies fade, banks are listing bargain-priced product less often. That
means investor activity – which accounts for a substantial market share – is
moderating. That's not to say that rates and prices aren't still attractive to owner-
occupant buyers. They most certainly are. Some short-term volatility is
expected as part of a normal market readjustment.
- 4.4%
Year-Over-Year
(YoY) Change in
Closed Sales
Condominium Only
- 4.8%
Year-Over-Year
(YoY) Change in
Closed Sales
All Properties
2
3
4
5
6
7
8
9
10
11
12
13
Data is refreshed regularly to capture changes in market activity so figures shown may be different than previously reported. Current as of March 17, 2014. All data from MLS Property
Information Network, Inc. Provided by Greater Boston Association of REALTORS® and the Massachusetts Association of REALTORS®. Powered by 10K Research and Marketing.
New Listings in the Greater Boston region were down 4.7 percent for detached
homes and 7.1 percent for condominiums. Closed Sales decreased 5.2 percent
for detached homes and 4.4 percent for condominiums.
The Median Sales Price was up 11.4 percent to $478,900 for single-family
properties and 14.3 percent to $400,000 for condominiums. Months Supply of
Inventory decreased 22.5 percent for single-family units and 27.0 percent for
townhouse-condo units.
The economy has more or less shuffled along, despite some climate-induced
surprises to job growth and new construction. There is no denying the fact that
we've now seen 47 straight months of private job growth, creating 8.5 million
new payrolls. There's still work to be done. Thankfully, with such low inventory
levels, many builders are bullish on new construction. The spring market is
budding, and it should be an interesting one.
Single-Family Market Overview
Condominium Market Overview
Closed Sales
Median Sales Price
Housing Affordability Index
Inventory of Homes for Sale
Click on desired metric to jump to that page.
Months Supply of Inventory
Days On Market Until Sale
Percent of Original List Price Received
City of Boston Overview
Pending Sales
New Listings
Single-Family Market Overview
Key market metrics for the current month and year-to-date figures for Single-Family Homes Only.
Key Metrics Historical Sparklines Feb-2013 Feb-2014 + / – YTD 2013 YTD 2014 + / –
Median Sales Price
- 26.5% -- --
- 18.2% 122 98 - 19.1%
--
Housing Affordability Index
Inventory of Homes for Sale
$430,000 + 12.8%
122 99
2,401 1,764
$478,900 + 11.4% $430,000
969 - 5.2%Closed Sales 425 403 - 5.2% 1,022
$485,000
2-2011 2-2012 2-2013 2-2014
2-2011 2-2012 2-2013 2-2014
2-2011 2-2012 2-2013 2-2014
2-2011 2-2012 2-2013 2-2014
94.0% 95.8%
- 24.0%
+ 2.0%
Percent of Original
List Price Received
Days on Market Until Sale
94.1%
- 19.7%
+ 2.0%
89
96.0%
Pending Sales - 6.3%1,241702 708 + 0.9% 1,324
Months Supply of Inventory 5.6
111 83
-- -- --4.4 - 22.5%
110
All data from MLS Property Information Network, Inc. Provided by the Greater Boston Association of REALTORS® and the Massachusetts Association of REALTORS®. Powered by 10K Research and Marketing. | Click for Cover Page | 2
New Listings 984 938 - 4.7% 1,854 1,672 - 9.8%
2 2011 2 2012 2 2013 2 2014
2-2011 2-2012 2-2013 2-2014
2-2011 2-2012 2-2013 2-2014
2-2011 2-2012 2-2013 2-2014
2-2011 2-2012 2-2013 2-2014
2-2011 2-2012 2-2013 2-2014
Condominium Market Overview
Key market metrics for the current month and year-to-date figures for Condominium Properties Only.
Key Metrics Historical Sparklines Feb-2013 Feb-2014 + / – YTD 2013 YTD 2014 + / –
- 0.9%
Median Sales Price $350,000 $400,000 + 14.3% $360,000 $410,000 + 13.9%
Closed Sales 435 416 - 4.4% 949 940
- 19.7%
Inventory of Homes for Sale 1,700 1,187 - 30.2% -- -- --
Housing Affordability Index 146 117 - 19.9% 143 115
2-2011 2-2012 2-2013 2-2014
2-2011 2-2012 2-2013 2-2014
2-2011 2-2012 2-2013 2-2014
2-2011 2-2012 2-2013 2-2014
--
Days on Market Until Sale 95 77 - 19.7% 92 69 - 24.7%
Months Supply of Inventory 3.9 2.9 - 27.0% -- --
+ 1.5%
Pending Sales 712 747 + 4.9% 1,368 1,363 - 0.4%
Percent of Original
List Price Received
96.7% 98.1% + 1.5% 96.2% 97.7%
- 12.5%
All data from MLS Property Information Network, Inc. Provided by the Greater Boston Association of REALTORS® and the Massachusetts Association of REALTORS®. Powered by 10K Research and Marketing. | Click for Cover Page | 3
New Listings 950 883 - 7.1% 1,852 1,620
2 2011 2 2012 2 2013 2 2014
2-2011 2-2012 2-2013 2-2014
2-2011 2-2012 2-2013 2-2014
2-2011 2-2012 2-2013 2-2014
2-2011 2-2012 2-2013 2-2014
2-2011 2-2012 2-2013 2-2014
Closed Sales
A count of the actual sales that have closed in a given month.
Single-Family
YoY
Change
Condominium
YoY
Change
Mar-2013 616 - 3.8% 628 + 3.6%
Apr-2013 767 + 4.4% 805 + 6.5%
May-2013 1,096 + 10.0% 1,068 + 6.4%
Jun-2013 1,481 - 1.1% 1,246 - 1.0%
Jul-2013 1,488 + 18.0% 1,252 + 20.7%
Aug-2013 1,428 + 11.6% 1,276 + 6.2%
Sep-2013 919 + 22.4% 887 + 18.7%
Oct-2013 855 + 10.5% 764 + 7.5%
Nov-2013 791 - 11.4% 711 - 5.8%
Dec-2013 898 + 10.3% 790 + 3.1%
Jan-2014 566 - 5.2% 524 + 1.9%
Feb-2014 403 - 5.2% 416 - 4.4%
462
384
425 435
403 416
February
20142013 20142013
980
794
1,022
949969 940
Year to Date
20142013 201420132012 2012 2012 2012
Total 11,308 + 6.0% 10,367 + 5.9%
All data from MLS Property Information Network, Inc. Provided by the Greater Boston Association of REALTORS® and the Massachusetts Association of REALTORS®. Powered by 10K Research and Marketing. | Click for Cover Page | 4
Single-Family Condominium
200
400
600
800
1,000
1,200
1,400
1,600
1,800
Jan-2003 Jan-2004 Jan-2005 Jan-2006 Jan-2007 Jan-2008 Jan-2009 Jan-2010 Jan-2011 Jan-2012 Jan-2013 Jan-2014
Historical Closed Sales Activity Single-Family Condominium
-4.4%+13.3%-8.0%
Single-Family Condominium
-0.9%+19.5%+4.3%-5.2% -5.2%
Median Sales Price
Median price point for all closed sales, not accounting for seller concessions, in a given month.
Single-Family
YoY
Change
Condominium
YoY
Change
Mar-2013 $430,101 + 3.6% $405,000 + 19.1%
Apr-2013 $480,000 + 14.3% $387,500 + 4.3%
May-2013 $500,000 + 7.2% $410,000 + 7.5%
Jun-2013 $545,000 + 8.1% $420,000 + 5.0%
Jul-2013 $533,000 + 4.1% $400,500 + 3.5%
Aug-2013 $521,000 + 5.5% $416,250 + 9.5%
Sep-2013 $502,500 + 15.5% $410,000 + 9.3%
Oct-2013 $474,000 + 9.0% $416,750 + 13.8%
Nov-2013 $480,000 + 6.7% $410,500 + 8.0%
Dec-2013 $500,000 + 6.4% $420,400 + 10.5%
Jan-2014 $485,838 + 13.0% $420,500 + 13.9%
Feb-2014 $478,900 + 11.4% $400,000 + 14.3%
$397,000
$370,000
$430,000
$350,000
$478,900
$400,000
February
20142013 20142013
$403,000
$360,000
$430,000
$360,000
$485,000
$410,000
Year to Date
20142013 201420132012 2012 2012 2012
Median $501,000 + 7.7% $410,000 + 8.2%
All data from MLS Property Information Network, Inc. Provided by the Greater Boston Association of REALTORS® and the Massachusetts Association of REALTORS®. Powered by 10K Research and Marketing. | Click for Cover Page | 5
Single-Family Condominium
$250,000
$300,000
$350,000
$400,000
$450,000
$500,000
$550,000
Jan-2003 Jan-2004 Jan-2005 Jan-2006 Jan-2007 Jan-2008 Jan-2009 Jan-2010 Jan-2011 Jan-2012 Jan-2013 Jan-2014
Historical Median Sales Price Single-Family Condominium
+14.3%-5.4%+8.3%
Single-Family Condominium
+13.9%0.0%+6.7%+11.4% +12.8%
Housing Affordability Index
Single-Family
YoY
Change
Condominium
YoY
Change
Mar-2013 121 + 3.4% 128 - 8.8%
Apr-2013 112 - 5.3% 136 + 2.9%
May-2013 104 - 4.8% 124 - 4.9%
Jun-2013 90 - 11.8% 114 - 9.2%
Jul-2013 92 - 9.2% 120 - 8.5%
Aug-2013 93 - 11.2% 114 - 13.9%
Sep-2013 98 - 18.5% 118 - 14.0%
Oct-2013 103 - 13.4% 116 - 16.6%
Nov-2013 108 - 6.7% 125 - 7.6%
Dec-2013 99 - 11.9% 117 - 14.6%
Jan-2014 97 - 22.5% 110 - 22.9%
Feb-2014 99 - 18.2% 117 - 19.9%
This index measures housing affordability for the region. An index of 120 means the median household income was 120% of what is necessary
to qualify for the median-priced home under prevailing interest rates. A higher number means greater affordability.
124
132
122
146
99
117
February
122
135
122
143
98
115
Year to Date
20142013 20142013 20142013 201420132012 2012 2012 2012
Average 101 -10.8% 120 -11.5%
All data from MLS Property Information Network, Inc. Provided by the Greater Boston Association of REALTORS® and the Massachusetts Association of REALTORS®. Powered by 10K Research and Marketing. | Click for Cover Page | 6
Single-Family Condominium
60
70
80
90
100
110
120
130
140
150
160
Jan-2004 Jan-2005 Jan-2006 Jan-2007 Jan-2008 Jan-2009 Jan-2010 Jan-2011 Jan-2012 Jan-2013 Jan-2014
Historical Housing Affordability Index Single-Family Condominium
-19.9%+11.2%-1.6%
Single-Family Condominium
-19.7%+6.1%-0.3%-18.2% -19.1%
Inventory of Homes for Sale
The number of properties available for sale in active status at the end of a given month.
Single-Family
YoY
Change
Condominium
YoY
Change
Mar-2013 2,377 - 40.7% 1,732 - 47.0%
Apr-2013 2,769 - 34.8% 1,974 - 40.1%
May-2013 3,037 - 30.7% 2,070 - 35.0%
Jun-2013 3,029 - 26.7% 2,024 - 31.9%
Jul-2013 2,860 - 25.1% 1,856 - 32.3%
Aug-2013 2,752 - 23.6% 1,737 - 28.4%
Sep-2013 2,991 - 20.5% 1,950 - 22.9%
Oct-2013 2,864 - 17.6% 1,876 - 19.2%
Nov-2013 2,382 - 20.2% 1,556 - 22.4%
Dec-2013 1,779 - 22.5% 1,218 - 20.0%
Jan-2014 1,713 - 25.3% 1,178 - 25.5%
Feb-2014 1,764 - 26.5% 1,187 - 30.2%
3,557
2,905
2,401
1,7001,764
1,187
February
20142013 201420132012 2012
Average 2,526 - 26.8% 1,697 - 31.1%
All data from MLS Property Information Network, Inc. Provided by the Greater Boston Association of REALTORS® and the Massachusetts Association of REALTORS®. Powered by 10K Research and Marketing. | Click for Cover Page | 7
Single-Family Condominium
1,000
2,000
3,000
4,000
5,000
6,000
7,000
8,000
9,000
Jan-2003 Jan-2004 Jan-2005 Jan-2006 Jan-2007 Jan-2008 Jan-2009 Jan-2010 Jan-2011 Jan-2012 Jan-2013 Jan-2014
Historical Inventory of Homes for Sale Single-Family Condominium
-30.2%-41.5%-32.5% -26.5%
Months Supply of Inventory
The inventory of homes for sale at the end of a given month, divided by the average monthly pending sales from the last 12 months.
Single-Family
YoY
Change
Condominium
YoY
Change
Mar-2013 3.9 - 38.4% 2.8 - 48.9%
Apr-2013 3.6 - 37.6% 2.5 - 43.8%
May-2013 2.8 - 37.0% 1.9 - 38.9%
Jun-2013 2.0 - 25.9% 1.6 - 31.1%
Jul-2013 1.9 - 36.5% 1.5 - 43.9%
Aug-2013 1.9 - 31.5% 1.4 - 32.5%
Sep-2013 3.3 - 35.0% 2.2 - 35.0%
Oct-2013 3.3 - 25.4% 2.5 - 24.8%
Nov-2013 3.0 - 9.9% 2.2 - 17.6%
Dec-2013 2.0 - 29.8% 1.5 - 22.5%
Jan-2014 3.0 - 21.2% 2.2 - 27.0%
Feb-2014 4.4 - 22.5% 2.9 - 27.0%
7.7 7.6
5.6
3.9
4.4
2.9
February
20142013 201420132012 2012
Average 2.7 - 34.3% 2.0 - 40.1%
All data from MLS Property Information Network, Inc. Provided by the Greater Boston Association of REALTORS® and the Massachusetts Association of REALTORS®. Powered by 10K Research and Marketing. | Click for Cover Page | 8
Single-Family Condominium
0
2
4
6
8
10
12
14
16
Jan-2004 Jan-2005 Jan-2006 Jan-2007 Jan-2008 Jan-2009 Jan-2010 Jan-2011 Jan-2012 Jan-2013 Jan-2014
Historical Months Supply of Inventory Single-Family Condominium
-27.0%-48.3%-26.6% -22.5%
Days on Market Until Sale
Average number of days between when a property is listed and when an offer is accepted in a given month.
Single-Family
YoY
Change
Condominium
YoY
Change
Mar-2013 107 - 17.4% 71 - 39.0%
Apr-2013 93 - 22.8% 63 - 35.1%
May-2013 75 - 22.3% 51 - 40.3%
Jun-2013 56 - 37.8% 43 - 42.4%
Jul-2013 47 - 41.6% 38 - 46.2%
Aug-2013 48 - 45.1% 40 - 47.0%
Sep-2013 57 - 36.1% 49 - 42.0%
Oct-2013 59 - 33.7% 47 - 43.9%
Nov-2013 65 - 27.2% 51 - 33.6%
Dec-2013 70 - 28.0% 55 - 34.2%
Jan-2014 79 - 27.3% 63 - 28.7%
Feb-2014 89 - 19.7% 77 - 19.7%
134
123
111
95
89
77
February
132
124
110
92
83
69
Year to Date
20142013 20142013 20142013 201420132012 2012 2012 2012
Total 65 - 31.9% 49 - 37.5%
All data from MLS Property Information Network, Inc. Provided by the Greater Boston Association of REALTORS® and the Massachusetts Association of REALTORS®. Powered by 10K Research and Marketing. | Click for Cover Page | 9
Single-Family Condominium
30
50
70
90
110
130
150
Jan-2003 Jan-2004 Jan-2005 Jan-2006 Jan-2007 Jan-2008 Jan-2009 Jan-2010 Jan-2011 Jan-2012 Jan-2013 Jan-2014
Historical Days on Market Until Sale Single-Family Condominium
-19.7%-22.6%-16.7%
Single-Family Condominium
-24.7%-26.3%-17.1%-19.7% -24.0%
Percent of Original List Price Received
Single-Family
YoY
Change
Condominium
YoY
Change
Mar-2013 95.2% + 2.3% 97.6% + 3.8%
Apr-2013 96.7% + 3.5% 98.8% + 3.2%
May-2013 97.8% + 2.6% 99.5% + 3.5%
Jun-2013 98.4% + 3.3% 99.7% + 3.5%
Jul-2013 98.1% + 2.4% 99.9% + 3.5%
Aug-2013 97.9% + 3.3% 99.7% + 3.5%
Sep-2013 97.3% + 3.0% 99.0% + 2.6%
Oct-2013 97.2% + 3.0% 98.8% + 3.1%
Nov-2013 96.3% + 1.7% 98.9% + 2.8%
Dec-2013 95.9% + 1.7% 98.0% + 1.9%
Jan-2014 95.7% + 1.9% 97.4% + 1.6%
Feb-2014 96.0% + 2.0% 98.1% + 1.5%
Percentage found when dividing a property’s sales price by its original list price, then taking the average for all properties sold in a given month,
not accounting for seller concessions.
91.3% 93.4%94.1% 96.7%96.0% 98.1%
February
90.8% 93.2%94.0% 96.2%95.8% 97.7%
Year to Date
20142013 20142013 20142013 201420132012 2012 2012 2012
Average 97.2% + 2.7% 99.0% + 3.1%
All data from MLS Property Information Network, Inc. Provided by the Greater Boston Association of REALTORS® and the Massachusetts Association of REALTORS®. Powered by 10K Research and Marketing. | Click for Cover Page | 10
Single-Family Condominium
89%
91%
93%
95%
97%
99%
101%
Jan-2003 Jan-2004 Jan-2005 Jan-2006 Jan-2007 Jan-2008 Jan-2009 Jan-2010 Jan-2011 Jan-2012 Jan-2013 Jan-2014
Historical Percent of Original List Price Received Single-Family Condominium
+1.5%+3.5%+3.2%
Single-Family Condominium
+1.5%+3.2%+3.5%+2.0% +2.0%
Pending Sales
A count of the properties in UAG status between the first and last day in a given month, regardless of current status (based on Off Market Date).
Single-Family
YoY
Change
Condominium
YoY
Change
Mar-2013 1,164 + 1.9% 1,164 + 9.3%
Apr-2013 1,380 + 12.4% 1,270 + 9.2%
May-2013 1,479 + 15.7% 1,257 + 6.7%
Jun-2013 1,284 + 9.5% 1,089 + 9.9%
Jul-2013 978 + 4.8% 952 + 19.7%
Aug-2013 887 + 15.2% 759 + 4.1%
Sep-2013 836 - 1.9% 785 + 7.2%
Oct-2013 942 + 8.5% 814 + 3.0%
Nov-2013 704 + 3.5% 635 + 6.9%
Dec-2013 478 - 4.6% 422 - 8.1%
Jan-2014 533 - 14.3% 616 - 6.1%
Feb-2014 708 + 0.9% 747 + 4.9%
753 744
702 712708
747
February
1,358
1,2971,324 1,368
1,241
1,363
Year to Date
20142013 20142013 20142013 201420132012 2012 2012 2012
Total 11,373 + 5.8% 10,510 + 6.5%
All data from MLS Property Information Network, Inc. Provided by the Greater Boston Association of REALTORS® and the Massachusetts Association of REALTORS®. Powered by 10K Research and Marketing. | Click for Cover Page | 11
Single-Family Condominium
200
400
600
800
1,000
1,200
1,400
1,600
1,800
2,000
2,200
Jan-2003 Jan-2004 Jan-2005 Jan-2006 Jan-2007 Jan-2008 Jan-2009 Jan-2010 Jan-2011 Jan-2012 Jan-2013 Jan-2014
Historical Pending Sales Activity Single-Family Condominium
+4.9%-4.3%-6.8%
Single-Family Condominium
-0.4%+5.5%-2.5%+0.9% -6.3%
New Listings
A count of the properties that have been newly listed on the market in a given month.
Single-Family
YoY
Change
Condominium
YoY
Change
Mar-2013 1,343 - 30.6% 1,342 - 21.1%
Apr-2013 1,995 + 14.7% 1,661 + 13.5%
May-2013 1,981 + 14.4% 1,531 + 12.6%
Jun-2013 1,505 + 15.1% 1,223 + 7.9%
Jul-2013 1,116 + 12.4% 993 + 12.3%
Aug-2013 1,030 + 6.0% 867 + 11.7%
Sep-2013 1,456 + 6.4% 1,253 + 11.0%
Oct-2013 1,218 + 18.6% 1,010 + 17.3%
Nov-2013 651 + 4.5% 554 + 0.4%
Dec-2013 395 + 12.9% 362 + 17.9%
Jan-2014 734 - 15.6% 737 - 18.3%
Feb-2014 938 - 4.7% 883 - 7.1%
1,268
1,112
984 950938
883
February
2,191
2,038
1,854 1,852
1,672 1,620
Year to Date
20142013 20142013 20142013 201420132012 2012 2012 2012
Total 14,362 + 3.3% 12,416 + 3.3%
All data from MLS Property Information Network, Inc. Provided by the Greater Boston Association of REALTORS® and the Massachusetts Association of REALTORS®. Powered by 10K Research and Marketing. | Click for Cover Page | 12
Single-Family Condominium
0
250
500
750
1,000
1,250
1,500
1,750
2,000
2,250
2,500
2,750
Jan-2003 Jan-2004 Jan-2005 Jan-2006 Jan-2007 Jan-2008 Jan-2009 Jan-2010 Jan-2011 Jan-2012 Jan-2013 Jan-2014
Historical New Listing Activity Single-Family Condominium
-7.1%-14.6%-22.4%
Single-Family Condominium
-12.5%-9.1%-15.4%-4.7% -9.8%
City of Boston – Market Overview
Key market metrics for the current month and year-to-date figures for the City of Boston.
Key Metrics Historical Sparklines Feb-2013 Feb-2014 + / – YTD 2013 YTD 2014 + / –
+ 7.0%
Median Sales Price $384,000 $478,000 + 24.5% $405,000 $469,750 + 16.0%
Closed Sales 226 240 + 6.2% 497 532
- 19.1%
Inventory of Homes for Sale 832 618 - 25.7% -- -- --
Housing Affordability Index 122 99 - 18.2% 122 98
2-2011 2-2012 2-2013 2-2014
2-2011 2-2012 2-2013 2-2014
2-2011 2-2012 2-2013 2-2014
2-2011 2-2012 2-2013 2-2014
--
Days on Market Until Sale 82 78 - 5.2% 79 68 - 13.8%
Months Supply of Inventory 3.7 2.6 - 30.1% -- --
+ 1.3%
Pending Sales 406 394 - 3.0% 738 716 - 3.0%
Percent of Original
List Price Received
96.7% 98.1% + 1.4% 96.5% 97.7%
- 15.3%
All data from MLS Property Information Network, Inc. Provided by the Greater Boston Association of REALTORS® and the Massachusetts Association of REALTORS®. Powered by 10K Research and Marketing. | Click for Cover Page | 13
New Listings 559 483 - 13.6% 1,033 875
2 2011 2 2012 2 2013 2 2014
2-2011 2-2012 2-2013 2-2014
2-2011 2-2012 2-2013 2-2014
2-2011 2-2012 2-2013 2-2014
2-2011 2-2012 2-2013 2-2014
2-2011 2-2012 2-2013 2-2014

More Related Content

More from Unit Realty Group

February 2015 Greater Boston Real Estate Market Trends Report
February 2015 Greater Boston Real Estate Market Trends ReportFebruary 2015 Greater Boston Real Estate Market Trends Report
February 2015 Greater Boston Real Estate Market Trends ReportUnit Realty Group
 
January 2015′s Monthly Multi-family Housing Activity Report
January 2015′s Monthly Multi-family Housing Activity ReportJanuary 2015′s Monthly Multi-family Housing Activity Report
January 2015′s Monthly Multi-family Housing Activity ReportUnit Realty Group
 
January 2015 Greater Boston Real Estate Market Trends Report
January 2015 Greater Boston Real Estate Market Trends ReportJanuary 2015 Greater Boston Real Estate Market Trends Report
January 2015 Greater Boston Real Estate Market Trends ReportUnit Realty Group
 
December 2014 Greater Boston Real Estate Market Trends Report
December 2014 Greater Boston Real Estate Market Trends ReportDecember 2014 Greater Boston Real Estate Market Trends Report
December 2014 Greater Boston Real Estate Market Trends ReportUnit Realty Group
 
November 2014 Greater Boston Real Estate Market Trends Report
November 2014 Greater Boston Real Estate Market Trends ReportNovember 2014 Greater Boston Real Estate Market Trends Report
November 2014 Greater Boston Real Estate Market Trends ReportUnit Realty Group
 
November 2014 Multi-family Housing Activity Report – Boston, MA Real Estate
November 2014 Multi-family Housing Activity Report – Boston, MA Real EstateNovember 2014 Multi-family Housing Activity Report – Boston, MA Real Estate
November 2014 Multi-family Housing Activity Report – Boston, MA Real EstateUnit Realty Group
 
October 2014 Greater Boston Real Estate Market Trends Report
October 2014 Greater Boston Real Estate Market Trends ReportOctober 2014 Greater Boston Real Estate Market Trends Report
October 2014 Greater Boston Real Estate Market Trends ReportUnit Realty Group
 
September 2014 Multi-family Housing Activity Report – Boston, MA Real Estate
September 2014 Multi-family Housing Activity Report – Boston, MA Real EstateSeptember 2014 Multi-family Housing Activity Report – Boston, MA Real Estate
September 2014 Multi-family Housing Activity Report – Boston, MA Real EstateUnit Realty Group
 
Boston By The Numbers - Boston Housing Stock (Report)
Boston By The Numbers - Boston Housing Stock (Report)Boston By The Numbers - Boston Housing Stock (Report)
Boston By The Numbers - Boston Housing Stock (Report)Unit Realty Group
 
May 2014 Multi-family Housing Activity Report – Boston, MA Real Estate
May 2014 Multi-family Housing Activity Report – Boston, MA Real EstateMay 2014 Multi-family Housing Activity Report – Boston, MA Real Estate
May 2014 Multi-family Housing Activity Report – Boston, MA Real EstateUnit Realty Group
 
January 2014 Greater Boston Real Estate Market Trends Report
January 2014 Greater Boston Real Estate Market Trends ReportJanuary 2014 Greater Boston Real Estate Market Trends Report
January 2014 Greater Boston Real Estate Market Trends ReportUnit Realty Group
 
November 2013 Multi-family Housing Activity Report – Boston, MA Real Estate
November 2013 Multi-family Housing Activity Report – Boston, MA Real EstateNovember 2013 Multi-family Housing Activity Report – Boston, MA Real Estate
November 2013 Multi-family Housing Activity Report – Boston, MA Real EstateUnit Realty Group
 
October 2013 Multi-family Housing Activity Report – Boston, MA Real Estate
October 2013 Multi-family Housing Activity Report – Boston, MA Real EstateOctober 2013 Multi-family Housing Activity Report – Boston, MA Real Estate
October 2013 Multi-family Housing Activity Report – Boston, MA Real EstateUnit Realty Group
 
September 2013 Multifamily Housing Activity Report – Boston, MA Real Estate
September 2013 Multifamily Housing Activity Report – Boston, MA Real EstateSeptember 2013 Multifamily Housing Activity Report – Boston, MA Real Estate
September 2013 Multifamily Housing Activity Report – Boston, MA Real EstateUnit Realty Group
 
August 2013 Multifamily Housing Activity Report – Boston, MA Real Estate
August 2013 Multifamily Housing Activity Report – Boston, MA Real EstateAugust 2013 Multifamily Housing Activity Report – Boston, MA Real Estate
August 2013 Multifamily Housing Activity Report – Boston, MA Real EstateUnit Realty Group
 
July 2013 Multifamily Housing Activity Report – Boston, MA Real Estate
July 2013 Multifamily Housing Activity Report – Boston, MA Real EstateJuly 2013 Multifamily Housing Activity Report – Boston, MA Real Estate
July 2013 Multifamily Housing Activity Report – Boston, MA Real EstateUnit Realty Group
 
July 2013's Monthly Indicators report - Boston Real Estate Market Trends
July 2013's Monthly Indicators report - Boston Real Estate Market TrendsJuly 2013's Monthly Indicators report - Boston Real Estate Market Trends
July 2013's Monthly Indicators report - Boston Real Estate Market TrendsUnit Realty Group
 
June 2013 Multifamily Housing Activity Report – Boston, MA Real Estate
June 2013 Multifamily Housing Activity Report – Boston, MA Real EstateJune 2013 Multifamily Housing Activity Report – Boston, MA Real Estate
June 2013 Multifamily Housing Activity Report – Boston, MA Real EstateUnit Realty Group
 
June 2013's Monthly Indicators report - Boston Real Estate Market Trends
June 2013's Monthly Indicators report - Boston Real Estate Market TrendsJune 2013's Monthly Indicators report - Boston Real Estate Market Trends
June 2013's Monthly Indicators report - Boston Real Estate Market TrendsUnit Realty Group
 
May 2013's Monthly Indicators report - Boston Real Estate Market Trends
May 2013's Monthly Indicators report - Boston Real Estate Market Trends May 2013's Monthly Indicators report - Boston Real Estate Market Trends
May 2013's Monthly Indicators report - Boston Real Estate Market Trends Unit Realty Group
 

More from Unit Realty Group (20)

February 2015 Greater Boston Real Estate Market Trends Report
February 2015 Greater Boston Real Estate Market Trends ReportFebruary 2015 Greater Boston Real Estate Market Trends Report
February 2015 Greater Boston Real Estate Market Trends Report
 
January 2015′s Monthly Multi-family Housing Activity Report
January 2015′s Monthly Multi-family Housing Activity ReportJanuary 2015′s Monthly Multi-family Housing Activity Report
January 2015′s Monthly Multi-family Housing Activity Report
 
January 2015 Greater Boston Real Estate Market Trends Report
January 2015 Greater Boston Real Estate Market Trends ReportJanuary 2015 Greater Boston Real Estate Market Trends Report
January 2015 Greater Boston Real Estate Market Trends Report
 
December 2014 Greater Boston Real Estate Market Trends Report
December 2014 Greater Boston Real Estate Market Trends ReportDecember 2014 Greater Boston Real Estate Market Trends Report
December 2014 Greater Boston Real Estate Market Trends Report
 
November 2014 Greater Boston Real Estate Market Trends Report
November 2014 Greater Boston Real Estate Market Trends ReportNovember 2014 Greater Boston Real Estate Market Trends Report
November 2014 Greater Boston Real Estate Market Trends Report
 
November 2014 Multi-family Housing Activity Report – Boston, MA Real Estate
November 2014 Multi-family Housing Activity Report – Boston, MA Real EstateNovember 2014 Multi-family Housing Activity Report – Boston, MA Real Estate
November 2014 Multi-family Housing Activity Report – Boston, MA Real Estate
 
October 2014 Greater Boston Real Estate Market Trends Report
October 2014 Greater Boston Real Estate Market Trends ReportOctober 2014 Greater Boston Real Estate Market Trends Report
October 2014 Greater Boston Real Estate Market Trends Report
 
September 2014 Multi-family Housing Activity Report – Boston, MA Real Estate
September 2014 Multi-family Housing Activity Report – Boston, MA Real EstateSeptember 2014 Multi-family Housing Activity Report – Boston, MA Real Estate
September 2014 Multi-family Housing Activity Report – Boston, MA Real Estate
 
Boston By The Numbers - Boston Housing Stock (Report)
Boston By The Numbers - Boston Housing Stock (Report)Boston By The Numbers - Boston Housing Stock (Report)
Boston By The Numbers - Boston Housing Stock (Report)
 
May 2014 Multi-family Housing Activity Report – Boston, MA Real Estate
May 2014 Multi-family Housing Activity Report – Boston, MA Real EstateMay 2014 Multi-family Housing Activity Report – Boston, MA Real Estate
May 2014 Multi-family Housing Activity Report – Boston, MA Real Estate
 
January 2014 Greater Boston Real Estate Market Trends Report
January 2014 Greater Boston Real Estate Market Trends ReportJanuary 2014 Greater Boston Real Estate Market Trends Report
January 2014 Greater Boston Real Estate Market Trends Report
 
November 2013 Multi-family Housing Activity Report – Boston, MA Real Estate
November 2013 Multi-family Housing Activity Report – Boston, MA Real EstateNovember 2013 Multi-family Housing Activity Report – Boston, MA Real Estate
November 2013 Multi-family Housing Activity Report – Boston, MA Real Estate
 
October 2013 Multi-family Housing Activity Report – Boston, MA Real Estate
October 2013 Multi-family Housing Activity Report – Boston, MA Real EstateOctober 2013 Multi-family Housing Activity Report – Boston, MA Real Estate
October 2013 Multi-family Housing Activity Report – Boston, MA Real Estate
 
September 2013 Multifamily Housing Activity Report – Boston, MA Real Estate
September 2013 Multifamily Housing Activity Report – Boston, MA Real EstateSeptember 2013 Multifamily Housing Activity Report – Boston, MA Real Estate
September 2013 Multifamily Housing Activity Report – Boston, MA Real Estate
 
August 2013 Multifamily Housing Activity Report – Boston, MA Real Estate
August 2013 Multifamily Housing Activity Report – Boston, MA Real EstateAugust 2013 Multifamily Housing Activity Report – Boston, MA Real Estate
August 2013 Multifamily Housing Activity Report – Boston, MA Real Estate
 
July 2013 Multifamily Housing Activity Report – Boston, MA Real Estate
July 2013 Multifamily Housing Activity Report – Boston, MA Real EstateJuly 2013 Multifamily Housing Activity Report – Boston, MA Real Estate
July 2013 Multifamily Housing Activity Report – Boston, MA Real Estate
 
July 2013's Monthly Indicators report - Boston Real Estate Market Trends
July 2013's Monthly Indicators report - Boston Real Estate Market TrendsJuly 2013's Monthly Indicators report - Boston Real Estate Market Trends
July 2013's Monthly Indicators report - Boston Real Estate Market Trends
 
June 2013 Multifamily Housing Activity Report – Boston, MA Real Estate
June 2013 Multifamily Housing Activity Report – Boston, MA Real EstateJune 2013 Multifamily Housing Activity Report – Boston, MA Real Estate
June 2013 Multifamily Housing Activity Report – Boston, MA Real Estate
 
June 2013's Monthly Indicators report - Boston Real Estate Market Trends
June 2013's Monthly Indicators report - Boston Real Estate Market TrendsJune 2013's Monthly Indicators report - Boston Real Estate Market Trends
June 2013's Monthly Indicators report - Boston Real Estate Market Trends
 
May 2013's Monthly Indicators report - Boston Real Estate Market Trends
May 2013's Monthly Indicators report - Boston Real Estate Market Trends May 2013's Monthly Indicators report - Boston Real Estate Market Trends
May 2013's Monthly Indicators report - Boston Real Estate Market Trends
 

Recently uploaded

9990771857 Call Girls in Dwarka Sector 07 Delhi (Call Girls) Delhi
9990771857 Call Girls in Dwarka Sector 07 Delhi (Call Girls) Delhi9990771857 Call Girls in Dwarka Sector 07 Delhi (Call Girls) Delhi
9990771857 Call Girls in Dwarka Sector 07 Delhi (Call Girls) Delhidelhimodel235
 
Mahindra Happinest Tathawade Pune Brochure.pdf
Mahindra Happinest Tathawade Pune Brochure.pdfMahindra Happinest Tathawade Pune Brochure.pdf
Mahindra Happinest Tathawade Pune Brochure.pdfBabyrudram
 
Cheap Rate ✨➥9711108085▻✨Call Girls In Bhajanpura (Delhi)
Cheap Rate ✨➥9711108085▻✨Call Girls In Bhajanpura (Delhi)Cheap Rate ✨➥9711108085▻✨Call Girls In Bhajanpura (Delhi)
Cheap Rate ✨➥9711108085▻✨Call Girls In Bhajanpura (Delhi)delhi24hrs1
 
Purva Soukhyam in Guduvancheri Chennai.pdf
Purva Soukhyam in Guduvancheri Chennai.pdfPurva Soukhyam in Guduvancheri Chennai.pdf
Purva Soukhyam in Guduvancheri Chennai.pdfpritika141199
 
Enjoy Night ≽ 8448380779 ≼ Call Girls In Huda City Centre (Gurgaon)
Enjoy Night ≽ 8448380779 ≼ Call Girls In Huda City Centre (Gurgaon)Enjoy Night ≽ 8448380779 ≼ Call Girls In Huda City Centre (Gurgaon)
Enjoy Night ≽ 8448380779 ≼ Call Girls In Huda City Centre (Gurgaon)Delhi Call girls
 
Kolte Patil Kharadi Pune E Brochure.pdf
Kolte Patil Kharadi Pune E  Brochure.pdfKolte Patil Kharadi Pune E  Brochure.pdf
Kolte Patil Kharadi Pune E Brochure.pdfabbu831446
 
Nyati Elite NIBM Road Pune E Brochure.pdf
Nyati Elite NIBM Road Pune E Brochure.pdfNyati Elite NIBM Road Pune E Brochure.pdf
Nyati Elite NIBM Road Pune E Brochure.pdfabbu831446
 
Mapusa Beach ( Call Girls ) Goa ✔ 8617370543 ✅ By Goa Call Girls For Pick Up ...
Mapusa Beach ( Call Girls ) Goa ✔ 8617370543 ✅ By Goa Call Girls For Pick Up ...Mapusa Beach ( Call Girls ) Goa ✔ 8617370543 ✅ By Goa Call Girls For Pick Up ...
Mapusa Beach ( Call Girls ) Goa ✔ 8617370543 ✅ By Goa Call Girls For Pick Up ...Nitya salvi
 
Kohinoor Teiko Hinjewadi Phase 2 Pune E-Brochure.pdf
Kohinoor Teiko Hinjewadi Phase 2 Pune  E-Brochure.pdfKohinoor Teiko Hinjewadi Phase 2 Pune  E-Brochure.pdf
Kohinoor Teiko Hinjewadi Phase 2 Pune E-Brochure.pdfManishSaxena95
 
Sector 62, Noida Call girls :8448380779 Model Escorts | 100% verified
Sector 62, Noida Call girls :8448380779 Model Escorts | 100% verifiedSector 62, Noida Call girls :8448380779 Model Escorts | 100% verified
Sector 62, Noida Call girls :8448380779 Model Escorts | 100% verifiedDelhi Call girls
 
Enjoy Night ≽ 8448380779 ≼ Call Girls In Iffco Chowk (Gurgaon)
Enjoy Night ≽ 8448380779 ≼ Call Girls In Iffco Chowk (Gurgaon)Enjoy Night ≽ 8448380779 ≼ Call Girls In Iffco Chowk (Gurgaon)
Enjoy Night ≽ 8448380779 ≼ Call Girls In Iffco Chowk (Gurgaon)Delhi Call girls
 
Acibadem Konaklari Uskudar - Listin Turkey
Acibadem Konaklari Uskudar - Listin TurkeyAcibadem Konaklari Uskudar - Listin Turkey
Acibadem Konaklari Uskudar - Listin TurkeyListing Turkey
 
9990771857 Call Girls in Dwarka Sector 2 Delhi (Call Girls) Delhi
9990771857 Call Girls in Dwarka Sector 2 Delhi (Call Girls) Delhi9990771857 Call Girls in Dwarka Sector 2 Delhi (Call Girls) Delhi
9990771857 Call Girls in Dwarka Sector 2 Delhi (Call Girls) Delhidelhimodel235
 
Rohan Harita Tathawade Pune Brochure.pdf
Rohan Harita Tathawade Pune Brochure.pdfRohan Harita Tathawade Pune Brochure.pdf
Rohan Harita Tathawade Pune Brochure.pdfabbu831446
 
MEQ Mainstreet Equity Corp Q2 2024 Investor Presentation
MEQ Mainstreet Equity Corp Q2 2024 Investor PresentationMEQ Mainstreet Equity Corp Q2 2024 Investor Presentation
MEQ Mainstreet Equity Corp Q2 2024 Investor PresentationMEQ - Mainstreet Equity Corp.
 
Bptp The Amaario Launch Luxury Project Sector 37D Gurgaon Dwarka Expressway...
Bptp The Amaario Launch  Luxury Project  Sector 37D Gurgaon Dwarka Expressway...Bptp The Amaario Launch  Luxury Project  Sector 37D Gurgaon Dwarka Expressway...
Bptp The Amaario Launch Luxury Project Sector 37D Gurgaon Dwarka Expressway...ApartmentWala1
 
Call Girls In Krishna Nagar Delhi (Escort)↫8447779280↬@SHOT 1500- NIGHT 5500→...
Call Girls In Krishna Nagar Delhi (Escort)↫8447779280↬@SHOT 1500- NIGHT 5500→...Call Girls In Krishna Nagar Delhi (Escort)↫8447779280↬@SHOT 1500- NIGHT 5500→...
Call Girls In Krishna Nagar Delhi (Escort)↫8447779280↬@SHOT 1500- NIGHT 5500→...asmaqueen5
 
Sector 62, Noida Call girls :8448380779 Noida Escorts | 100% verified
Sector 62, Noida Call girls :8448380779 Noida Escorts | 100% verifiedSector 62, Noida Call girls :8448380779 Noida Escorts | 100% verified
Sector 62, Noida Call girls :8448380779 Noida Escorts | 100% verifiedDelhi Call girls
 
9990771857 Call Girls Dwarka Sector 9 Delhi (Call Girls ) Delhi
9990771857 Call Girls Dwarka Sector 9 Delhi (Call Girls ) Delhi9990771857 Call Girls Dwarka Sector 9 Delhi (Call Girls ) Delhi
9990771857 Call Girls Dwarka Sector 9 Delhi (Call Girls ) Delhidelhimodel235
 
Call Girls in Karkardooma Delhi +91 84487779280}Woman Seeking Man in Delhi NCR
Call Girls in Karkardooma Delhi +91 84487779280}Woman Seeking Man in Delhi NCRCall Girls in Karkardooma Delhi +91 84487779280}Woman Seeking Man in Delhi NCR
Call Girls in Karkardooma Delhi +91 84487779280}Woman Seeking Man in Delhi NCRasmaqueen5
 

Recently uploaded (20)

9990771857 Call Girls in Dwarka Sector 07 Delhi (Call Girls) Delhi
9990771857 Call Girls in Dwarka Sector 07 Delhi (Call Girls) Delhi9990771857 Call Girls in Dwarka Sector 07 Delhi (Call Girls) Delhi
9990771857 Call Girls in Dwarka Sector 07 Delhi (Call Girls) Delhi
 
Mahindra Happinest Tathawade Pune Brochure.pdf
Mahindra Happinest Tathawade Pune Brochure.pdfMahindra Happinest Tathawade Pune Brochure.pdf
Mahindra Happinest Tathawade Pune Brochure.pdf
 
Cheap Rate ✨➥9711108085▻✨Call Girls In Bhajanpura (Delhi)
Cheap Rate ✨➥9711108085▻✨Call Girls In Bhajanpura (Delhi)Cheap Rate ✨➥9711108085▻✨Call Girls In Bhajanpura (Delhi)
Cheap Rate ✨➥9711108085▻✨Call Girls In Bhajanpura (Delhi)
 
Purva Soukhyam in Guduvancheri Chennai.pdf
Purva Soukhyam in Guduvancheri Chennai.pdfPurva Soukhyam in Guduvancheri Chennai.pdf
Purva Soukhyam in Guduvancheri Chennai.pdf
 
Enjoy Night ≽ 8448380779 ≼ Call Girls In Huda City Centre (Gurgaon)
Enjoy Night ≽ 8448380779 ≼ Call Girls In Huda City Centre (Gurgaon)Enjoy Night ≽ 8448380779 ≼ Call Girls In Huda City Centre (Gurgaon)
Enjoy Night ≽ 8448380779 ≼ Call Girls In Huda City Centre (Gurgaon)
 
Kolte Patil Kharadi Pune E Brochure.pdf
Kolte Patil Kharadi Pune E  Brochure.pdfKolte Patil Kharadi Pune E  Brochure.pdf
Kolte Patil Kharadi Pune E Brochure.pdf
 
Nyati Elite NIBM Road Pune E Brochure.pdf
Nyati Elite NIBM Road Pune E Brochure.pdfNyati Elite NIBM Road Pune E Brochure.pdf
Nyati Elite NIBM Road Pune E Brochure.pdf
 
Mapusa Beach ( Call Girls ) Goa ✔ 8617370543 ✅ By Goa Call Girls For Pick Up ...
Mapusa Beach ( Call Girls ) Goa ✔ 8617370543 ✅ By Goa Call Girls For Pick Up ...Mapusa Beach ( Call Girls ) Goa ✔ 8617370543 ✅ By Goa Call Girls For Pick Up ...
Mapusa Beach ( Call Girls ) Goa ✔ 8617370543 ✅ By Goa Call Girls For Pick Up ...
 
Kohinoor Teiko Hinjewadi Phase 2 Pune E-Brochure.pdf
Kohinoor Teiko Hinjewadi Phase 2 Pune  E-Brochure.pdfKohinoor Teiko Hinjewadi Phase 2 Pune  E-Brochure.pdf
Kohinoor Teiko Hinjewadi Phase 2 Pune E-Brochure.pdf
 
Sector 62, Noida Call girls :8448380779 Model Escorts | 100% verified
Sector 62, Noida Call girls :8448380779 Model Escorts | 100% verifiedSector 62, Noida Call girls :8448380779 Model Escorts | 100% verified
Sector 62, Noida Call girls :8448380779 Model Escorts | 100% verified
 
Enjoy Night ≽ 8448380779 ≼ Call Girls In Iffco Chowk (Gurgaon)
Enjoy Night ≽ 8448380779 ≼ Call Girls In Iffco Chowk (Gurgaon)Enjoy Night ≽ 8448380779 ≼ Call Girls In Iffco Chowk (Gurgaon)
Enjoy Night ≽ 8448380779 ≼ Call Girls In Iffco Chowk (Gurgaon)
 
Acibadem Konaklari Uskudar - Listin Turkey
Acibadem Konaklari Uskudar - Listin TurkeyAcibadem Konaklari Uskudar - Listin Turkey
Acibadem Konaklari Uskudar - Listin Turkey
 
9990771857 Call Girls in Dwarka Sector 2 Delhi (Call Girls) Delhi
9990771857 Call Girls in Dwarka Sector 2 Delhi (Call Girls) Delhi9990771857 Call Girls in Dwarka Sector 2 Delhi (Call Girls) Delhi
9990771857 Call Girls in Dwarka Sector 2 Delhi (Call Girls) Delhi
 
Rohan Harita Tathawade Pune Brochure.pdf
Rohan Harita Tathawade Pune Brochure.pdfRohan Harita Tathawade Pune Brochure.pdf
Rohan Harita Tathawade Pune Brochure.pdf
 
MEQ Mainstreet Equity Corp Q2 2024 Investor Presentation
MEQ Mainstreet Equity Corp Q2 2024 Investor PresentationMEQ Mainstreet Equity Corp Q2 2024 Investor Presentation
MEQ Mainstreet Equity Corp Q2 2024 Investor Presentation
 
Bptp The Amaario Launch Luxury Project Sector 37D Gurgaon Dwarka Expressway...
Bptp The Amaario Launch  Luxury Project  Sector 37D Gurgaon Dwarka Expressway...Bptp The Amaario Launch  Luxury Project  Sector 37D Gurgaon Dwarka Expressway...
Bptp The Amaario Launch Luxury Project Sector 37D Gurgaon Dwarka Expressway...
 
Call Girls In Krishna Nagar Delhi (Escort)↫8447779280↬@SHOT 1500- NIGHT 5500→...
Call Girls In Krishna Nagar Delhi (Escort)↫8447779280↬@SHOT 1500- NIGHT 5500→...Call Girls In Krishna Nagar Delhi (Escort)↫8447779280↬@SHOT 1500- NIGHT 5500→...
Call Girls In Krishna Nagar Delhi (Escort)↫8447779280↬@SHOT 1500- NIGHT 5500→...
 
Sector 62, Noida Call girls :8448380779 Noida Escorts | 100% verified
Sector 62, Noida Call girls :8448380779 Noida Escorts | 100% verifiedSector 62, Noida Call girls :8448380779 Noida Escorts | 100% verified
Sector 62, Noida Call girls :8448380779 Noida Escorts | 100% verified
 
9990771857 Call Girls Dwarka Sector 9 Delhi (Call Girls ) Delhi
9990771857 Call Girls Dwarka Sector 9 Delhi (Call Girls ) Delhi9990771857 Call Girls Dwarka Sector 9 Delhi (Call Girls ) Delhi
9990771857 Call Girls Dwarka Sector 9 Delhi (Call Girls ) Delhi
 
Call Girls in Karkardooma Delhi +91 84487779280}Woman Seeking Man in Delhi NCR
Call Girls in Karkardooma Delhi +91 84487779280}Woman Seeking Man in Delhi NCRCall Girls in Karkardooma Delhi +91 84487779280}Woman Seeking Man in Delhi NCR
Call Girls in Karkardooma Delhi +91 84487779280}Woman Seeking Man in Delhi NCR
 

February 2014 Greater Boston Real Estate Market Trends Report

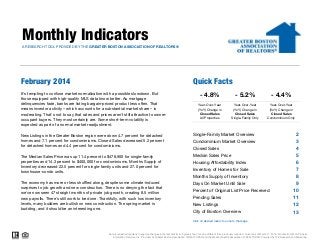
  • 1. Monthly IndicatorsA RESEARCH TOOL PROVIDED BY THE GREATER BOSTON ASSOCIATION OF REALTORS® February 2014 Quick Facts - 5.2% Year-Over-Year (YoY) Change in Closed Sales Single-Family Only It's tempting to confuse market normalization with a possible slowdown. But those equipped with high-quality MLS data know better. As mortgage delinquencies fade, banks are listing bargain-priced product less often. That means investor activity – which accounts for a substantial market share – is moderating. That's not to say that rates and prices aren't still attractive to owner- occupant buyers. They most certainly are. Some short-term volatility is expected as part of a normal market readjustment. - 4.4% Year-Over-Year (YoY) Change in Closed Sales Condominium Only - 4.8% Year-Over-Year (YoY) Change in Closed Sales All Properties 2 3 4 5 6 7 8 9 10 11 12 13 Data is refreshed regularly to capture changes in market activity so figures shown may be different than previously reported. Current as of March 17, 2014. All data from MLS Property Information Network, Inc. Provided by Greater Boston Association of REALTORS® and the Massachusetts Association of REALTORS®. Powered by 10K Research and Marketing. New Listings in the Greater Boston region were down 4.7 percent for detached homes and 7.1 percent for condominiums. Closed Sales decreased 5.2 percent for detached homes and 4.4 percent for condominiums. The Median Sales Price was up 11.4 percent to $478,900 for single-family properties and 14.3 percent to $400,000 for condominiums. Months Supply of Inventory decreased 22.5 percent for single-family units and 27.0 percent for townhouse-condo units. The economy has more or less shuffled along, despite some climate-induced surprises to job growth and new construction. There is no denying the fact that we've now seen 47 straight months of private job growth, creating 8.5 million new payrolls. There's still work to be done. Thankfully, with such low inventory levels, many builders are bullish on new construction. The spring market is budding, and it should be an interesting one. Single-Family Market Overview Condominium Market Overview Closed Sales Median Sales Price Housing Affordability Index Inventory of Homes for Sale Click on desired metric to jump to that page. Months Supply of Inventory Days On Market Until Sale Percent of Original List Price Received City of Boston Overview Pending Sales New Listings
  • 2. Single-Family Market Overview Key market metrics for the current month and year-to-date figures for Single-Family Homes Only. Key Metrics Historical Sparklines Feb-2013 Feb-2014 + / – YTD 2013 YTD 2014 + / – Median Sales Price - 26.5% -- -- - 18.2% 122 98 - 19.1% -- Housing Affordability Index Inventory of Homes for Sale $430,000 + 12.8% 122 99 2,401 1,764 $478,900 + 11.4% $430,000 969 - 5.2%Closed Sales 425 403 - 5.2% 1,022 $485,000 2-2011 2-2012 2-2013 2-2014 2-2011 2-2012 2-2013 2-2014 2-2011 2-2012 2-2013 2-2014 2-2011 2-2012 2-2013 2-2014 94.0% 95.8% - 24.0% + 2.0% Percent of Original List Price Received Days on Market Until Sale 94.1% - 19.7% + 2.0% 89 96.0% Pending Sales - 6.3%1,241702 708 + 0.9% 1,324 Months Supply of Inventory 5.6 111 83 -- -- --4.4 - 22.5% 110 All data from MLS Property Information Network, Inc. Provided by the Greater Boston Association of REALTORS® and the Massachusetts Association of REALTORS®. Powered by 10K Research and Marketing. | Click for Cover Page | 2 New Listings 984 938 - 4.7% 1,854 1,672 - 9.8% 2 2011 2 2012 2 2013 2 2014 2-2011 2-2012 2-2013 2-2014 2-2011 2-2012 2-2013 2-2014 2-2011 2-2012 2-2013 2-2014 2-2011 2-2012 2-2013 2-2014 2-2011 2-2012 2-2013 2-2014
  • 3. Condominium Market Overview Key market metrics for the current month and year-to-date figures for Condominium Properties Only. Key Metrics Historical Sparklines Feb-2013 Feb-2014 + / – YTD 2013 YTD 2014 + / – - 0.9% Median Sales Price $350,000 $400,000 + 14.3% $360,000 $410,000 + 13.9% Closed Sales 435 416 - 4.4% 949 940 - 19.7% Inventory of Homes for Sale 1,700 1,187 - 30.2% -- -- -- Housing Affordability Index 146 117 - 19.9% 143 115 2-2011 2-2012 2-2013 2-2014 2-2011 2-2012 2-2013 2-2014 2-2011 2-2012 2-2013 2-2014 2-2011 2-2012 2-2013 2-2014 -- Days on Market Until Sale 95 77 - 19.7% 92 69 - 24.7% Months Supply of Inventory 3.9 2.9 - 27.0% -- -- + 1.5% Pending Sales 712 747 + 4.9% 1,368 1,363 - 0.4% Percent of Original List Price Received 96.7% 98.1% + 1.5% 96.2% 97.7% - 12.5% All data from MLS Property Information Network, Inc. Provided by the Greater Boston Association of REALTORS® and the Massachusetts Association of REALTORS®. Powered by 10K Research and Marketing. | Click for Cover Page | 3 New Listings 950 883 - 7.1% 1,852 1,620 2 2011 2 2012 2 2013 2 2014 2-2011 2-2012 2-2013 2-2014 2-2011 2-2012 2-2013 2-2014 2-2011 2-2012 2-2013 2-2014 2-2011 2-2012 2-2013 2-2014 2-2011 2-2012 2-2013 2-2014
  • 4. Closed Sales A count of the actual sales that have closed in a given month. Single-Family YoY Change Condominium YoY Change Mar-2013 616 - 3.8% 628 + 3.6% Apr-2013 767 + 4.4% 805 + 6.5% May-2013 1,096 + 10.0% 1,068 + 6.4% Jun-2013 1,481 - 1.1% 1,246 - 1.0% Jul-2013 1,488 + 18.0% 1,252 + 20.7% Aug-2013 1,428 + 11.6% 1,276 + 6.2% Sep-2013 919 + 22.4% 887 + 18.7% Oct-2013 855 + 10.5% 764 + 7.5% Nov-2013 791 - 11.4% 711 - 5.8% Dec-2013 898 + 10.3% 790 + 3.1% Jan-2014 566 - 5.2% 524 + 1.9% Feb-2014 403 - 5.2% 416 - 4.4% 462 384 425 435 403 416 February 20142013 20142013 980 794 1,022 949969 940 Year to Date 20142013 201420132012 2012 2012 2012 Total 11,308 + 6.0% 10,367 + 5.9% All data from MLS Property Information Network, Inc. Provided by the Greater Boston Association of REALTORS® and the Massachusetts Association of REALTORS®. Powered by 10K Research and Marketing. | Click for Cover Page | 4 Single-Family Condominium 200 400 600 800 1,000 1,200 1,400 1,600 1,800 Jan-2003 Jan-2004 Jan-2005 Jan-2006 Jan-2007 Jan-2008 Jan-2009 Jan-2010 Jan-2011 Jan-2012 Jan-2013 Jan-2014 Historical Closed Sales Activity Single-Family Condominium -4.4%+13.3%-8.0% Single-Family Condominium -0.9%+19.5%+4.3%-5.2% -5.2%
  • 5. Median Sales Price Median price point for all closed sales, not accounting for seller concessions, in a given month. Single-Family YoY Change Condominium YoY Change Mar-2013 $430,101 + 3.6% $405,000 + 19.1% Apr-2013 $480,000 + 14.3% $387,500 + 4.3% May-2013 $500,000 + 7.2% $410,000 + 7.5% Jun-2013 $545,000 + 8.1% $420,000 + 5.0% Jul-2013 $533,000 + 4.1% $400,500 + 3.5% Aug-2013 $521,000 + 5.5% $416,250 + 9.5% Sep-2013 $502,500 + 15.5% $410,000 + 9.3% Oct-2013 $474,000 + 9.0% $416,750 + 13.8% Nov-2013 $480,000 + 6.7% $410,500 + 8.0% Dec-2013 $500,000 + 6.4% $420,400 + 10.5% Jan-2014 $485,838 + 13.0% $420,500 + 13.9% Feb-2014 $478,900 + 11.4% $400,000 + 14.3% $397,000 $370,000 $430,000 $350,000 $478,900 $400,000 February 20142013 20142013 $403,000 $360,000 $430,000 $360,000 $485,000 $410,000 Year to Date 20142013 201420132012 2012 2012 2012 Median $501,000 + 7.7% $410,000 + 8.2% All data from MLS Property Information Network, Inc. Provided by the Greater Boston Association of REALTORS® and the Massachusetts Association of REALTORS®. Powered by 10K Research and Marketing. | Click for Cover Page | 5 Single-Family Condominium $250,000 $300,000 $350,000 $400,000 $450,000 $500,000 $550,000 Jan-2003 Jan-2004 Jan-2005 Jan-2006 Jan-2007 Jan-2008 Jan-2009 Jan-2010 Jan-2011 Jan-2012 Jan-2013 Jan-2014 Historical Median Sales Price Single-Family Condominium +14.3%-5.4%+8.3% Single-Family Condominium +13.9%0.0%+6.7%+11.4% +12.8%
  • 6. Housing Affordability Index Single-Family YoY Change Condominium YoY Change Mar-2013 121 + 3.4% 128 - 8.8% Apr-2013 112 - 5.3% 136 + 2.9% May-2013 104 - 4.8% 124 - 4.9% Jun-2013 90 - 11.8% 114 - 9.2% Jul-2013 92 - 9.2% 120 - 8.5% Aug-2013 93 - 11.2% 114 - 13.9% Sep-2013 98 - 18.5% 118 - 14.0% Oct-2013 103 - 13.4% 116 - 16.6% Nov-2013 108 - 6.7% 125 - 7.6% Dec-2013 99 - 11.9% 117 - 14.6% Jan-2014 97 - 22.5% 110 - 22.9% Feb-2014 99 - 18.2% 117 - 19.9% This index measures housing affordability for the region. An index of 120 means the median household income was 120% of what is necessary to qualify for the median-priced home under prevailing interest rates. A higher number means greater affordability. 124 132 122 146 99 117 February 122 135 122 143 98 115 Year to Date 20142013 20142013 20142013 201420132012 2012 2012 2012 Average 101 -10.8% 120 -11.5% All data from MLS Property Information Network, Inc. Provided by the Greater Boston Association of REALTORS® and the Massachusetts Association of REALTORS®. Powered by 10K Research and Marketing. | Click for Cover Page | 6 Single-Family Condominium 60 70 80 90 100 110 120 130 140 150 160 Jan-2004 Jan-2005 Jan-2006 Jan-2007 Jan-2008 Jan-2009 Jan-2010 Jan-2011 Jan-2012 Jan-2013 Jan-2014 Historical Housing Affordability Index Single-Family Condominium -19.9%+11.2%-1.6% Single-Family Condominium -19.7%+6.1%-0.3%-18.2% -19.1%
  • 7. Inventory of Homes for Sale The number of properties available for sale in active status at the end of a given month. Single-Family YoY Change Condominium YoY Change Mar-2013 2,377 - 40.7% 1,732 - 47.0% Apr-2013 2,769 - 34.8% 1,974 - 40.1% May-2013 3,037 - 30.7% 2,070 - 35.0% Jun-2013 3,029 - 26.7% 2,024 - 31.9% Jul-2013 2,860 - 25.1% 1,856 - 32.3% Aug-2013 2,752 - 23.6% 1,737 - 28.4% Sep-2013 2,991 - 20.5% 1,950 - 22.9% Oct-2013 2,864 - 17.6% 1,876 - 19.2% Nov-2013 2,382 - 20.2% 1,556 - 22.4% Dec-2013 1,779 - 22.5% 1,218 - 20.0% Jan-2014 1,713 - 25.3% 1,178 - 25.5% Feb-2014 1,764 - 26.5% 1,187 - 30.2% 3,557 2,905 2,401 1,7001,764 1,187 February 20142013 201420132012 2012 Average 2,526 - 26.8% 1,697 - 31.1% All data from MLS Property Information Network, Inc. Provided by the Greater Boston Association of REALTORS® and the Massachusetts Association of REALTORS®. Powered by 10K Research and Marketing. | Click for Cover Page | 7 Single-Family Condominium 1,000 2,000 3,000 4,000 5,000 6,000 7,000 8,000 9,000 Jan-2003 Jan-2004 Jan-2005 Jan-2006 Jan-2007 Jan-2008 Jan-2009 Jan-2010 Jan-2011 Jan-2012 Jan-2013 Jan-2014 Historical Inventory of Homes for Sale Single-Family Condominium -30.2%-41.5%-32.5% -26.5%
  • 8. Months Supply of Inventory The inventory of homes for sale at the end of a given month, divided by the average monthly pending sales from the last 12 months. Single-Family YoY Change Condominium YoY Change Mar-2013 3.9 - 38.4% 2.8 - 48.9% Apr-2013 3.6 - 37.6% 2.5 - 43.8% May-2013 2.8 - 37.0% 1.9 - 38.9% Jun-2013 2.0 - 25.9% 1.6 - 31.1% Jul-2013 1.9 - 36.5% 1.5 - 43.9% Aug-2013 1.9 - 31.5% 1.4 - 32.5% Sep-2013 3.3 - 35.0% 2.2 - 35.0% Oct-2013 3.3 - 25.4% 2.5 - 24.8% Nov-2013 3.0 - 9.9% 2.2 - 17.6% Dec-2013 2.0 - 29.8% 1.5 - 22.5% Jan-2014 3.0 - 21.2% 2.2 - 27.0% Feb-2014 4.4 - 22.5% 2.9 - 27.0% 7.7 7.6 5.6 3.9 4.4 2.9 February 20142013 201420132012 2012 Average 2.7 - 34.3% 2.0 - 40.1% All data from MLS Property Information Network, Inc. Provided by the Greater Boston Association of REALTORS® and the Massachusetts Association of REALTORS®. Powered by 10K Research and Marketing. | Click for Cover Page | 8 Single-Family Condominium 0 2 4 6 8 10 12 14 16 Jan-2004 Jan-2005 Jan-2006 Jan-2007 Jan-2008 Jan-2009 Jan-2010 Jan-2011 Jan-2012 Jan-2013 Jan-2014 Historical Months Supply of Inventory Single-Family Condominium -27.0%-48.3%-26.6% -22.5%
  • 9. Days on Market Until Sale Average number of days between when a property is listed and when an offer is accepted in a given month. Single-Family YoY Change Condominium YoY Change Mar-2013 107 - 17.4% 71 - 39.0% Apr-2013 93 - 22.8% 63 - 35.1% May-2013 75 - 22.3% 51 - 40.3% Jun-2013 56 - 37.8% 43 - 42.4% Jul-2013 47 - 41.6% 38 - 46.2% Aug-2013 48 - 45.1% 40 - 47.0% Sep-2013 57 - 36.1% 49 - 42.0% Oct-2013 59 - 33.7% 47 - 43.9% Nov-2013 65 - 27.2% 51 - 33.6% Dec-2013 70 - 28.0% 55 - 34.2% Jan-2014 79 - 27.3% 63 - 28.7% Feb-2014 89 - 19.7% 77 - 19.7% 134 123 111 95 89 77 February 132 124 110 92 83 69 Year to Date 20142013 20142013 20142013 201420132012 2012 2012 2012 Total 65 - 31.9% 49 - 37.5% All data from MLS Property Information Network, Inc. Provided by the Greater Boston Association of REALTORS® and the Massachusetts Association of REALTORS®. Powered by 10K Research and Marketing. | Click for Cover Page | 9 Single-Family Condominium 30 50 70 90 110 130 150 Jan-2003 Jan-2004 Jan-2005 Jan-2006 Jan-2007 Jan-2008 Jan-2009 Jan-2010 Jan-2011 Jan-2012 Jan-2013 Jan-2014 Historical Days on Market Until Sale Single-Family Condominium -19.7%-22.6%-16.7% Single-Family Condominium -24.7%-26.3%-17.1%-19.7% -24.0%
  • 10. Percent of Original List Price Received Single-Family YoY Change Condominium YoY Change Mar-2013 95.2% + 2.3% 97.6% + 3.8% Apr-2013 96.7% + 3.5% 98.8% + 3.2% May-2013 97.8% + 2.6% 99.5% + 3.5% Jun-2013 98.4% + 3.3% 99.7% + 3.5% Jul-2013 98.1% + 2.4% 99.9% + 3.5% Aug-2013 97.9% + 3.3% 99.7% + 3.5% Sep-2013 97.3% + 3.0% 99.0% + 2.6% Oct-2013 97.2% + 3.0% 98.8% + 3.1% Nov-2013 96.3% + 1.7% 98.9% + 2.8% Dec-2013 95.9% + 1.7% 98.0% + 1.9% Jan-2014 95.7% + 1.9% 97.4% + 1.6% Feb-2014 96.0% + 2.0% 98.1% + 1.5% Percentage found when dividing a property’s sales price by its original list price, then taking the average for all properties sold in a given month, not accounting for seller concessions. 91.3% 93.4%94.1% 96.7%96.0% 98.1% February 90.8% 93.2%94.0% 96.2%95.8% 97.7% Year to Date 20142013 20142013 20142013 201420132012 2012 2012 2012 Average 97.2% + 2.7% 99.0% + 3.1% All data from MLS Property Information Network, Inc. Provided by the Greater Boston Association of REALTORS® and the Massachusetts Association of REALTORS®. Powered by 10K Research and Marketing. | Click for Cover Page | 10 Single-Family Condominium 89% 91% 93% 95% 97% 99% 101% Jan-2003 Jan-2004 Jan-2005 Jan-2006 Jan-2007 Jan-2008 Jan-2009 Jan-2010 Jan-2011 Jan-2012 Jan-2013 Jan-2014 Historical Percent of Original List Price Received Single-Family Condominium +1.5%+3.5%+3.2% Single-Family Condominium +1.5%+3.2%+3.5%+2.0% +2.0%
  • 11. Pending Sales A count of the properties in UAG status between the first and last day in a given month, regardless of current status (based on Off Market Date). Single-Family YoY Change Condominium YoY Change Mar-2013 1,164 + 1.9% 1,164 + 9.3% Apr-2013 1,380 + 12.4% 1,270 + 9.2% May-2013 1,479 + 15.7% 1,257 + 6.7% Jun-2013 1,284 + 9.5% 1,089 + 9.9% Jul-2013 978 + 4.8% 952 + 19.7% Aug-2013 887 + 15.2% 759 + 4.1% Sep-2013 836 - 1.9% 785 + 7.2% Oct-2013 942 + 8.5% 814 + 3.0% Nov-2013 704 + 3.5% 635 + 6.9% Dec-2013 478 - 4.6% 422 - 8.1% Jan-2014 533 - 14.3% 616 - 6.1% Feb-2014 708 + 0.9% 747 + 4.9% 753 744 702 712708 747 February 1,358 1,2971,324 1,368 1,241 1,363 Year to Date 20142013 20142013 20142013 201420132012 2012 2012 2012 Total 11,373 + 5.8% 10,510 + 6.5% All data from MLS Property Information Network, Inc. Provided by the Greater Boston Association of REALTORS® and the Massachusetts Association of REALTORS®. Powered by 10K Research and Marketing. | Click for Cover Page | 11 Single-Family Condominium 200 400 600 800 1,000 1,200 1,400 1,600 1,800 2,000 2,200 Jan-2003 Jan-2004 Jan-2005 Jan-2006 Jan-2007 Jan-2008 Jan-2009 Jan-2010 Jan-2011 Jan-2012 Jan-2013 Jan-2014 Historical Pending Sales Activity Single-Family Condominium +4.9%-4.3%-6.8% Single-Family Condominium -0.4%+5.5%-2.5%+0.9% -6.3%
  • 12. New Listings A count of the properties that have been newly listed on the market in a given month. Single-Family YoY Change Condominium YoY Change Mar-2013 1,343 - 30.6% 1,342 - 21.1% Apr-2013 1,995 + 14.7% 1,661 + 13.5% May-2013 1,981 + 14.4% 1,531 + 12.6% Jun-2013 1,505 + 15.1% 1,223 + 7.9% Jul-2013 1,116 + 12.4% 993 + 12.3% Aug-2013 1,030 + 6.0% 867 + 11.7% Sep-2013 1,456 + 6.4% 1,253 + 11.0% Oct-2013 1,218 + 18.6% 1,010 + 17.3% Nov-2013 651 + 4.5% 554 + 0.4% Dec-2013 395 + 12.9% 362 + 17.9% Jan-2014 734 - 15.6% 737 - 18.3% Feb-2014 938 - 4.7% 883 - 7.1% 1,268 1,112 984 950938 883 February 2,191 2,038 1,854 1,852 1,672 1,620 Year to Date 20142013 20142013 20142013 201420132012 2012 2012 2012 Total 14,362 + 3.3% 12,416 + 3.3% All data from MLS Property Information Network, Inc. Provided by the Greater Boston Association of REALTORS® and the Massachusetts Association of REALTORS®. Powered by 10K Research and Marketing. | Click for Cover Page | 12 Single-Family Condominium 0 250 500 750 1,000 1,250 1,500 1,750 2,000 2,250 2,500 2,750 Jan-2003 Jan-2004 Jan-2005 Jan-2006 Jan-2007 Jan-2008 Jan-2009 Jan-2010 Jan-2011 Jan-2012 Jan-2013 Jan-2014 Historical New Listing Activity Single-Family Condominium -7.1%-14.6%-22.4% Single-Family Condominium -12.5%-9.1%-15.4%-4.7% -9.8%
  • 13. City of Boston – Market Overview Key market metrics for the current month and year-to-date figures for the City of Boston. Key Metrics Historical Sparklines Feb-2013 Feb-2014 + / – YTD 2013 YTD 2014 + / – + 7.0% Median Sales Price $384,000 $478,000 + 24.5% $405,000 $469,750 + 16.0% Closed Sales 226 240 + 6.2% 497 532 - 19.1% Inventory of Homes for Sale 832 618 - 25.7% -- -- -- Housing Affordability Index 122 99 - 18.2% 122 98 2-2011 2-2012 2-2013 2-2014 2-2011 2-2012 2-2013 2-2014 2-2011 2-2012 2-2013 2-2014 2-2011 2-2012 2-2013 2-2014 -- Days on Market Until Sale 82 78 - 5.2% 79 68 - 13.8% Months Supply of Inventory 3.7 2.6 - 30.1% -- -- + 1.3% Pending Sales 406 394 - 3.0% 738 716 - 3.0% Percent of Original List Price Received 96.7% 98.1% + 1.4% 96.5% 97.7% - 15.3% All data from MLS Property Information Network, Inc. Provided by the Greater Boston Association of REALTORS® and the Massachusetts Association of REALTORS®. Powered by 10K Research and Marketing. | Click for Cover Page | 13 New Listings 559 483 - 13.6% 1,033 875 2 2011 2 2012 2 2013 2 2014 2-2011 2-2012 2-2013 2-2014 2-2011 2-2012 2-2013 2-2014 2-2011 2-2012 2-2013 2-2014 2-2011 2-2012 2-2013 2-2014 2-2011 2-2012 2-2013 2-2014