September 2015 Greater Boston Real Estate Market Trends Report
•
0 likes•391 views

The real estate market in the Greater Boston region experienced positive trends in the third quarter of 2015. New listings increased 10.9% for single-family homes and 11.3% for condominiums. Closed sales rose 15% for single-family homes and 4.1% for condominiums. Median sales prices increased 7.5% for single-family homes to $455,000 and 3.4% for condominiums to $428,500. Months of inventory decreased significantly. Overall, the housing market remains healthy with continued job growth and low interest rates.

Recommended
Recommended
More Related Content
What's hot
What's hot (20)
Viewers also liked
Viewers also liked (15)
Similar to September 2015 Greater Boston Real Estate Market Trends Report
Similar to September 2015 Greater Boston Real Estate Market Trends Report (18)
More from Unit Realty Group
More from Unit Realty Group (19)
Recently uploaded
Recently uploaded (20)
September 2015 Greater Boston Real Estate Market Trends Report
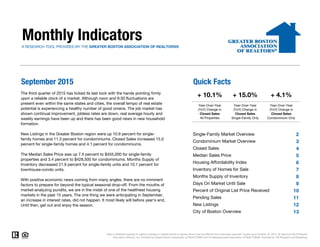
- 1. Monthly IndicatorsA RESEARCH TOOL PROVIDED BY THE GREATER BOSTON ASSOCIATION OF REALTORS® September 2015 Quick Facts 2 3 4 5 6 7 8 9 10 11 12 13 Data is refreshed regularly to capture changes in market activity so figures shown may be different than previously reported. Current as of October 16, 2015. All data from MLS Property Information Network, Inc. Provided by Greater Boston Association of REALTORS® and the Massachusetts Association of REALTORS®. Powered by 10K Research and Marketing. + 15.0% Year-Over-Year (YoY) Change in Closed Sales Single-Family Only The third quarter of 2015 has ticked its last tock with the hands pointing firmly upon a reliable clock of a market. Although noon and 6:30 fluctuations are present even within the same states and cities, the overall tempo of real estate potential is experiencing a healthy number of good omens. The job market has shown continual improvement, jobless rates are down, real average hourly and weekly earnings have been up and there has been good news in new household formation. New Listings in the Greater Boston region were up 10.9 percent for single- family homes and 11.3 percent for condominiums. Closed Sales increased 15.0 percent for single-family homes and 4.1 percent for condominiums. The Median Sales Price was up 7.5 percent to $455,000 for single-family properties and 3.4 percent to $428,500 for condominiums. Months Supply of Inventory decreased 21.9 percent for single-family units and 10.1 percent for townhouse-condo units. With positive economic news coming from many angles, there are no imminent factors to prepare for beyond the typical seasonal drop-off. From the mouths of market-analyzing pundits, we are in the midst of one of the healthiest housing markets in the past 15 years. The one thing we were anticipating in September, an increase in interest rates, did not happen. It most likely will before year's end. Until then, get out and enjoy the season. + 4.1% Year-Over-Year (YoY) Change in Closed Sales Condominium Only + 10.1% Year-Over-Year (YoY) Change in Closed Sales All Properties Single-Family Market Overview Condominium Market Overview Closed Sales Median Sales Price Housing Affordability Index Inventory of Homes for Sale Months Supply of Inventory Days On Market Until Sale Percent of Original List Price Received City of Boston Overview Pending Sales New Listings
- 2. Single-Family Market Overview Key market metrics for the current month and year-to-date figures for Single-Family Homes Only. Key Metrics Historical Sparklines Sep-2014 Sep-2015 + / – YTD 2014 YTD 2015 + / – 97.5% 98.0% + 3.0% + 0.5% Percent of Original List Price Received Days on Market Until Sale 96.7% - 4.7% + 0.8% 64 97.5% Pending Sales Median Sales Price + 10.4%11,6401,058 1,350 + 27.6% 10,539 - 10.1% -- -- - 4.0% 94 93 - 1.1% -- Housing Affordability Index Inventory of Homes for Sale Months Supply of Inventory 4.0 $423,450 + 4.3% 67 103 99 70 -- -- -- 4,306 3,870 3.2 - 21.9% $455,000 + 7.5% $465,000 68 10,616 + 5.8% All data from MLS Property Information Network, Inc. Provided by the Greater Boston Association of REALTORS® and the Massachusetts Association of REALTORS®. Powered by 10K Research and Marketing. | 2 New Listings 1,839 2,040 + 10.9% 15,178 15,805 + 4.1% Closed Sales 1,066 1,226 + 15.0% 10,036 $485,000 9-2012 9-2013 9-2014 9-2015 9-2012 9-2013 9-2014 9-2015 9-2012 9-2013 9-2014 9-2015 9-2012 9-2013 9-2014 9-2015 9-2012 9-2013 9-2014 9-2015 9-2012 9-2013 9-2014 9-2015 9-2012 9-2013 9-2014 9-2015 9-2012 9-2013 9-2014 9-2015 9-2012 9-2013 9-2014 9-2015
- 3. Condominium Market Overview Key market metrics for the current month and year-to-date figures for Condominium Properties Only. Key Metrics Historical Sparklines Sep-2014 Sep-2015 + / – YTD 2014 YTD 2015 + / – - 1.0% Median Sales Price $414,500 $428,500 + 3.4% $417,000 $450,000 + 7.9% Closed Sales 862 897 + 4.1% 8,041 7,960 - 4.4% Inventory of Homes for Sale 1,958 1,832 - 6.4% -- -- -- Housing Affordability Index 106 105 - 0.2% 105 100 -- Days on Market Until Sale 53 52 - 2.8% 56 51 - 8.6% Months Supply of Inventory 2.3 2.0 - 10.1% -- -- + 0.7% Pending Sales 836 895 + 7.1% 8,407 8,682 + 3.3% Percent of Original List Price Received 99.0% 99.4% + 0.4% 99.5% 100.2% + 3.6% All data from MLS Property Information Network, Inc. Provided by the Greater Boston Association of REALTORS® and the Massachusetts Association of REALTORS®. Powered by 10K Research and Marketing. | 3 New Listings 1,277 1,421 + 11.3% 10,512 10,893 9-2012 9-2013 9-2014 9-2015 9-2012 9-2013 9-2014 9-2015 9-2012 9-2013 9-2014 9-2015 9-2012 9-2013 9-2014 9-2015 9-2012 9-2013 9-2014 9-2015 9-2012 9-2013 9-2014 9-2015 9-2012 9-2013 9-2014 9-2015 9-2012 9-2013 9-2014 9-2015 9-2012 9-2013 9-2014 9-2015
- 4. Closed Sales A count of the actual sales that have closed in a given month. Single-Family YoY Change Condominium YoY Change Oct-2014 1,048 - 3.8% 865 + 7.1% Nov-2014 960 - 7.8% 651 - 14.2% Dec-2014 1,116 + 3.2% 811 - 2.9% Jan-2015 742 + 1.4% 481 - 15.3% Feb-2015 554 + 6.5% 449 - 0.2% Mar-2015 711 - 0.1% 579 - 16.3% Apr-2015 787 - 8.7% 677 - 21.9% May-2015 1,084 - 10.1% 948 - 5.1% Jun-2015 1,872 + 11.2% 1,376 + 8.4% Jul-2015 1,911 + 9.9% 1,342 + 12.2% Aug-2015 1,729 + 14.1% 1,211 + 6.4% Sep-2015 1,226 + 15.0% 897 + 4.1% Total 13,740 + 3.7% 10,287 - 1.5% All data from MLS Property Information Network, Inc. Provided by the Greater Boston Association of REALTORS® and the Massachusetts Association of REALTORS®. Powered by 10K Research and Marketing. | 4 1,139 932 1,066 862 1,226 897 Single-Family Condominium September 200 400 600 800 1,000 1,200 1,400 1,600 1,800 2,000 Jan-2003 Jan-2004 Jan-2005 Jan-2006 Jan-2007 Jan-2008 Jan-2009 Jan-2010 Jan-2011 Jan-2012 Jan-2013 Jan-2014 Jan-2015 Historical Closed Sales Activity Single-Family Condominium +4.1%-7.5%-6.4% 20152014 20152014 10,678 8,524 10,036 8,041 10,616 7,960 Single-Family Condominium Year to Date -1.0%-5.7%-6.0% 20152014 20152014 +15.0% +5.8% 2013 2013 2013 2013
- 5. Median Sales Price Median price point for all closed sales, not accounting for seller concessions, in a given month. Single-Family YoY Change Condominium YoY Change Oct-2014 $435,000 + 3.6% $394,000 - 0.6% Nov-2014 $450,000 + 8.4% $415,000 + 5.1% Dec-2014 $443,500 + 2.0% $425,000 + 4.9% Jan-2015 $446,000 + 6.7% $443,000 + 10.9% Feb-2015 $438,500 + 7.6% $407,135 + 4.4% Mar-2015 $432,500 + 1.3% $449,000 + 6.9% Apr-2015 $470,000 + 6.8% $438,500 + 10.5% May-2015 $480,000 + 3.4% $456,325 + 9.3% Jun-2015 $526,655 + 3.3% $459,500 + 4.5% Jul-2015 $525,000 + 4.0% $460,000 + 9.8% Aug-2015 $497,100 + 1.4% $460,000 + 9.8% Sep-2015 $455,000 + 7.5% $428,500 + 3.4% Median $475,000 + 5.0% $440,000 + 6.7% All data from MLS Property Information Network, Inc. Provided by the Greater Boston Association of REALTORS® and the Massachusetts Association of REALTORS®. Powered by 10K Research and Marketing. | 5 $431,500 $395,000 $423,450 $414,500 $455,000 $428,500 Single-Family Condominium September $250,000 $300,000 $350,000 $400,000 $450,000 $500,000 $550,000 $600,000 Jan-2003 Jan-2004 Jan-2005 Jan-2006 Jan-2007 Jan-2008 Jan-2009 Jan-2010 Jan-2011 Jan-2012 Jan-2013 Jan-2014 Jan-2015 Historical Median Sales Price Single-Family Condominium +3.4%+4.9%-1.9% 20152014 20152014 $440,000 $390,000 $465,000 $417,000 $485,000 $450,000 Single-Family Condominium Year to Date +7.9%+6.9%+5.7% 20152014 20152014 +7.5% +4.3% 2013 2013 2013 2013
- 6. Housing Affordability Index Single-Family YoY Change Condominium YoY Change Oct-2014 102 - 3.0% 113 + 1.1% Nov-2014 99 - 12.1% 108 - 9.3% Dec-2014 101 - 1.4% 106 - 4.2% Jan-2015 103 + 1.0% 103 - 2.8% Feb-2015 105 - 1.2% 113 + 1.9% Mar-2015 105 + 3.4% 101 - 2.0% Apr-2015 97 - 0.3% 104 - 3.6% May-2015 96 + 0.4% 101 - 5.0% Jun-2015 86 - 1.1% 98 - 2.3% Jul-2015 84 - 3.1% 96 - 8.2% Aug-2015 90 - 0.4% 97 - 8.0% Sep-2015 99 - 4.0% 105 - 0.2% Average 97 -1.8% 104 -3.6% This index measures housing affordability for the region. An index of 120 means the median household income was 120% of what is necessary to qualify for the median-priced home under prevailing interest rates. A higher number means greater affordability. All data from MLS Property Information Network, Inc. Provided by the Greater Boston Association of REALTORS® and the Massachusetts Association of REALTORS®. Powered by 10K Research and Marketing. | 6 103 112 103 106 99 105 Single-Family Condominium September 50 60 70 80 90 100 110 120 130 140 150 Jan-2004 Jan-2005 Jan-2006 Jan-2007 Jan-2008 Jan-2009 Jan-2010 Jan-2011 Jan-2012 Jan-2013 Jan-2014 Jan-2015 Historical Housing Affordability Index Single-Family Condominium -0.2%-5.9%+0.7% 101 114 94 105 93 100 Single-Family Condominium Year to Date -4.4%-7.6%-6.5% 20152014 20152014 20152014 20152014 -4.0% -1.1% 2013 2013 2013 2013
- 7. Inventory of Homes for Sale The number of properties available for sale in active status at the end of a given month. Single-Family YoY Change Condominium YoY Change Oct-2014 4,189 + 7.6% 1,969 - 8.8% Nov-2014 3,501 + 3.8% 1,650 - 10.1% Dec-2014 2,774 + 2.7% 1,298 - 13.4% Jan-2015 2,638 - 1.7% 1,310 - 13.2% Feb-2015 2,431 - 14.2% 1,249 - 20.8% Mar-2015 2,603 - 15.7% 1,395 - 17.1% Apr-2015 3,331 - 7.6% 1,765 - 5.9% May-2015 3,866 - 7.3% 1,942 - 4.8% Jun-2015 3,995 - 5.7% 1,910 - 4.8% Jul-2015 3,936 - 5.5% 1,804 - 6.5% Aug-2015 3,736 - 7.2% 1,648 - 6.6% Sep-2015 3,870 - 10.1% 1,832 - 6.4% Average 3,406 - 5.1% 1,648 - 9.5% All data from MLS Property Information Network, Inc. Provided by the Greater Boston Association of REALTORS® and the Massachusetts Association of REALTORS®. Powered by 10K Research and Marketing. | 7 4,062 2,229 4,306 1,958 3,870 1,832 Single-Family Condominium September 1,000 2,000 3,000 4,000 5,000 6,000 7,000 8,000 9,000 10,000 Jan-2003 Jan-2004 Jan-2005 Jan-2006 Jan-2007 Jan-2008 Jan-2009 Jan-2010 Jan-2011 Jan-2012 Jan-2013 Jan-2014 Jan-2015 Historical Inventory of Homes for Sale Single-Family Condominium -6.4%-12.2%+6.0% 20152014 20152014 -10.1% 2013 2013
- 8. Months Supply of Inventory The inventory of homes for sale at the end of a given month, divided by the average monthly pending sales from the last 12 months. Single-Family YoY Change Condominium YoY Change Oct-2014 4.0 + 11.8% 2.3 - 14.8% Nov-2014 3.6 + 12.5% 2.5 + 4.8% Dec-2014 2.5 - 0.5% 1.6 - 10.8% Jan-2015 3.6 - 3.0% 2.7 + 2.5% Feb-2015 4.4 - 19.4% 2.8 - 20.7% Mar-2015 3.7 - 15.6% 2.4 - 0.9% Apr-2015 4.2 + 1.2% 2.6 + 20.6% May-2015 3.6 + 3.1% 2.0 + 0.3% Jun-2015 2.1 - 15.2% 1.4 - 12.2% Jul-2015 2.1 - 14.0% 1.3 - 16.7% Aug-2015 2.2 - 18.6% 1.4 - 12.2% Sep-2015 3.2 - 21.9% 2.0 - 10.1% Average 3.1 - 2.5% 1.9 - 4.0% All data from MLS Property Information Network, Inc. Provided by the Greater Boston Association of REALTORS® and the Massachusetts Association of REALTORS®. Powered by 10K Research and Marketing. | 8 3.6 2.4 4.0 2.3 3.2 2.0 Single-Family Condominium September 0 2 4 6 8 10 12 14 16 Jan-2004 Jan-2005 Jan-2006 Jan-2007 Jan-2008 Jan-2009 Jan-2010 Jan-2011 Jan-2012 Jan-2013 Jan-2014 Jan-2015 Historical Months Supply of Inventory Single-Family Condominium -10.1%-5.0%+13.3% 20152014 20152014 -21.9% 2013 2013
- 9. Days on Market Until Sale Average number of days between when a property is listed and when an offer is accepted in a given month. Single-Family YoY Change Condominium YoY Change Oct-2014 71 + 13.0% 53 + 10.2% Nov-2014 75 + 6.8% 57 + 0.5% Dec-2014 79 + 11.2% 55 - 2.9% Jan-2015 90 + 10.7% 63 - 3.5% Feb-2015 105 + 11.2% 78 - 2.2% Mar-2015 100 + 12.9% 69 - 0.4% Apr-2015 90 + 4.7% 59 + 1.2% May-2015 71 + 9.1% 47 - 8.4% Jun-2015 60 + 2.0% 42 - 9.7% Jul-2015 55 - 3.5% 41 - 18.7% Aug-2015 61 + 2.8% 46 - 11.8% Sep-2015 64 - 4.7% 52 - 2.8% Total 71 + 4.7% 50 - 5.6% All data from MLS Property Information Network, Inc. Provided by the Greater Boston Association of REALTORS® and the Massachusetts Association of REALTORS®. Powered by 10K Research and Marketing. | 9 64 50 67 53 64 52 Single-Family Condominium September 30 50 70 90 110 130 150 170 Jan-2003 Jan-2004 Jan-2005 Jan-2006 Jan-2007 Jan-2008 Jan-2009 Jan-2010 Jan-2011 Jan-2012 Jan-2013 Jan-2014 Jan-2015 Historical Days on Market Until Sale Single-Family Condominium -2.8%+6.3%+4.9% 73 55 68 56 70 51 Single-Family Condominium Year to Date -8.6%+0.2%-7.0% 20152014 20152014 20152014 20152014 -4.7% +3.0% 2013 2013 2013 2013
- 10. Percent of Original List Price Received Single-Family YoY Change Condominium YoY Change Oct-2014 96.5% - 0.4% 98.5% - 0.1% Nov-2014 96.3% + 0.2% 98.2% - 0.4% Dec-2014 95.3% - 0.6% 97.9% + 0.1% Jan-2015 95.6% + 0.3% 97.8% + 0.7% Feb-2015 95.1% - 0.7% 97.9% - 0.1% Mar-2015 96.2% - 0.2% 98.6% - 0.2% Apr-2015 97.2% - 0.2% 100.3% + 1.0% May-2015 98.8% + 0.6% 100.8% + 0.2% Jun-2015 99.2% + 0.5% 101.6% + 0.9% Jul-2015 99.1% + 1.0% 101.1% + 1.3% Aug-2015 98.2% + 0.5% 100.5% + 0.5% Sep-2015 97.5% + 0.8% 99.4% + 0.4% Average 97.5% + 0.3% 99.8% + 0.5% All data from MLS Property Information Network, Inc. Provided by the Greater Boston Association of REALTORS® and the Massachusetts Association of REALTORS®. Powered by 10K Research and Marketing. | 10 Percentage found when dividing a property’s sales price by its original list price, then taking the average for all properties sold in a given month, not accounting for seller concessions. 96.9% 98.8%96.7% 99.0%97.5% 99.4% Single-Family Condominium September 89% 91% 93% 95% 97% 99% 101% 103% 105% Jan-2003 Jan-2004 Jan-2005 Jan-2006 Jan-2007 Jan-2008 Jan-2009 Jan-2010 Jan-2011 Jan-2012 Jan-2013 Jan-2014 Jan-2015 Historical Percent of Original List Price Received Single-Family Condominium +0.4%+0.2%-0.2% 96.8% 98.8%97.5% 99.5%98.0% 100.2% Single-Family Condominium Year to Date +0.7%+0.8%+0.8% 20152014 20152014 20152014 20152014 +0.8% +0.5% 2013 2013 2013 2013
- 11. Pending Sales A count of the properties in UAG status between the first and last day in a given month, regardless of current status (based on Off Market Date). Single-Family YoY Change Condominium YoY Change Oct-2014 1,171 + 2.8% 823 - 4.5% Nov-2014 916 + 3.9% 654 - 2.5% Dec-2014 651 + 9.6% 447 + 1.8% Jan-2015 718 + 11.3% 558 - 11.7% Feb-2015 667 - 15.9% 568 - 23.9% Mar-2015 1,154 - 8.0% 981 - 6.8% Apr-2015 1,581 + 7.2% 1,266 + 3.3% May-2015 1,767 + 9.5% 1,279 + 13.4% Jun-2015 1,824 + 20.5% 1,363 + 19.5% Jul-2015 1,354 + 13.6% 958 + 3.3% Aug-2015 1,225 + 23.2% 814 + 13.2% Sep-2015 1,350 + 27.6% 895 + 7.1% Total 14,378 + 9.3% 10,606 + 2.2% All data from MLS Property Information Network, Inc. Provided by the Greater Boston Association of REALTORS® and the Massachusetts Association of REALTORS®. Powered by 10K Research and Marketing. | 11 1,058 815 1,058 836 1,350 895 Single-Family Condominium September 200 400 600 800 1,000 1,200 1,400 1,600 1,800 2,000 Jan-2003 Jan-2004 Jan-2005 Jan-2006 Jan-2007 Jan-2008 Jan-2009 Jan-2010 Jan-2011 Jan-2012 Jan-2013 Jan-2014 Jan-2015 Historical Pending Sales Activity Single-Family Condominium +7.1%+2.6%0.0% 11,317 9,043 10,539 8,407 11,640 8,682 Single-Family Condominium Year to Date +3.3%-7.0%-6.9% 20152014 20152014 20152014 20152014 +27.6% +10.4% 2013 2013 2013 2013
- 12. New Listings A count of the properties that have been newly listed on the market in a given month. Single-Family YoY Change Condominium YoY Change Oct-2014 1,545 + 5.2% 1,081 + 0.3% Nov-2014 794 - 10.1% 602 + 0.8% Dec-2014 591 + 9.9% 395 + 0.5% Jan-2015 894 - 4.6% 709 - 10.5% Feb-2015 697 - 38.9% 616 - 33.5% Mar-2015 1,545 - 13.0% 1,253 - 4.0% Apr-2015 2,525 + 12.6% 1,746 + 11.4% May-2015 2,584 + 4.2% 1,620 + 9.6% Jun-2015 2,361 + 18.2% 1,542 + 16.5% Jul-2015 1,715 + 14.5% 1,078 + 1.3% Aug-2015 1,444 + 14.0% 908 + 16.9% Sep-2015 2,040 + 10.9% 1,421 + 11.3% Total 18,735 + 3.7% 12,971 + 3.1% All data from MLS Property Information Network, Inc. Provided by the Greater Boston Association of REALTORS® and the Massachusetts Association of REALTORS®. Powered by 10K Research and Marketing. | 12 1,800 1,317 1,839 1,277 2,040 1,421 Single-Family Condominium September 0 250 500 750 1,000 1,250 1,500 1,750 2,000 2,250 2,500 2,750 Jan-2003 Jan-2004 Jan-2005 Jan-2006 Jan-2007 Jan-2008 Jan-2009 Jan-2010 Jan-2011 Jan-2012 Jan-2013 Jan-2014 Jan-2015 Historical New Listing Activity Single-Family Condominium +11.3%-3.0%+2.2% 15,253 11,359 15,178 10,512 15,805 10,893 Single-Family Condominium Year to Date +3.6%-7.5%-0.5% 20152014 20152014 20152014 20152014 +10.9% +4.1% 2013 2013 2013 2013
- 13. City of Boston – Market Overview Key market metrics for the current month and year-to-date figures for the City of Boston. Key Metrics Historical Sparklines Sep-2014 Sep-2015 + / – YTD 2014 YTD 2015 + / – - 1.4% Median Sales Price $461,000 $500,000 + 8.5% $469,000 $510,000 + 8.7% Closed Sales 429 441 + 2.8% 4,122 4,064 - 1.1% Inventory of Homes for Sale 986 960 - 2.6% -- -- -- Housing Affordability Index 103 99 - 4.0% 94 93 -- Days on Market Until Sale 50 48 - 4.2% 49 48 - 2.0% Months Supply of Inventory 2.3 2.2 - 5.3% -- -- + 0.4% Pending Sales 424 443 + 4.5% 4,289 4,403 + 2.7% Percent of Original List Price Received 98.5% 98.9% + 0.4% 99.5% 99.9% + 1.8% All data from MLS Property Information Network, Inc. Provided by the Greater Boston Association of REALTORS® and the Massachusetts Association of REALTORS®. Powered by 10K Research and Marketing. | 13 New Listings 684 764 + 11.7% 5,481 5,580 9-2012 9-2013 9-2014 9-2015 9-2012 9-2013 9-2014 9-2015 9-2012 9-2013 9-2014 9-2015 9-2012 9-2013 9-2014 9-2015 9-2012 9-2013 9-2014 9-2015 9-2012 9-2013 9-2014 9-2015 9-2012 9-2013 9-2014 9-2015 9-2012 9-2013 9-2014 9-2015 9-2012 9-2013 9-2014 9-2015