

Recomendados
Más contenido relacionado
La actualidad más candente
La actualidad más candente (12)
Similar a Ch08
Similar a Ch08 (20)
Último
Último (20)
Ch08
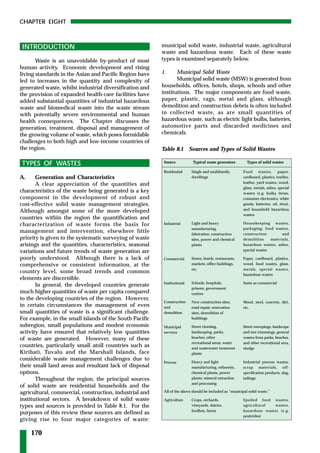
- 1. CHAPTER EIGHT INTRODUCTION municipal solid waste, industrial waste, agricultural waste and hazardous waste. Each of these waste Waste is an unavoidable by-product of most types is examined separately below. human activity. Economic development and rising living standards in the Asian and Pacific Region have 1. Municipal Solid Waste led to increases in the quantity and complexity of Municipal solid waste (MSW) is generated from generated waste, whilst industrial diversification and households, offices, hotels, shops, schools and other the provision of expanded health-care facilities have institutions. The major components are food waste, added substantial quantities of industrial hazardous paper, plastic, rags, metal and glass, although waste and biomedical waste into the waste stream demolition and construction debris is often included with potentially severe environmental and human in collected waste, as are small quantities of health consequences. The Chapter discusses the hazardous waste, such as electric light bulbs, batteries, generation, treatment, disposal and management of automotive parts and discarded medicines and the growing volume of waste, which poses formidable chemicals. challenges to both high and low-income countries of the region. Table 8.1 Sources and Types of Solid Wastes TYPES OF WASTES Source Typical waste generators Types of solid wastes Residential Single and multifamily Food wastes, paper, A. Generation and Characteristics dwellings cardboard, plastics, textiles, leather, yard wastes, wood, A clear appreciation of the quantities and glass, metals, ashes, special characteristics of the waste being generated is a key wastes (e.g. bulky items, component in the development of robust and consumer electronics, white cost-effective solid waste management strategies. goods, batteries, oil, tires), and household hazardous Although amongst some of the more developed wastes countries within the region the quantification and characterization of waste forms the basis for Industrial Light and heavy Housekeeping wastes, manufacturing, packaging, food wastes, management and intervention, elsewhere little fabrication, construction construction and priority is given to the systematic surveying of waste sites, power and chemical demolition materials, arisings and the quantities, characteristics, seasonal plants hazardous wastes, ashes, variations and future trends of waste generation are special wastes poorly understood. Although there is a lack of Commercial Stores, hotels, restaurants, Paper, cardboard, plastics, comprehensive or consistent information, at the markets, office buildings, wood, food wastes, glass, etc. metals, special wastes, country level, some broad trends and common hazardous wastes elements are discernible. Institutional Schools, hospitals, Same as commercial In general, the developed countries generate prisons, government much higher quantities of waste per capita compared centres to the developing countries of the region. However, Construction New construction sites, Wood, steel, concrete, dirt, in certain circumstances the management of even and road repair, renovation etc. small quantities of waste is a significant challenge. demolition sites, demolition of For example, in the small islands of the South Pacific buildings subregion, small populations and modest economic Municipal Street cleaning, Street sweepings, landscape activity have ensured that relatively low quantities services landscaping, parks, and tree trimmings, general of waste are generated. However, many of these beaches, other wastes from parks, beaches, recreational areas, water and other recreational area, countries, particularly small atoll countries such as and wastewater treatment sludge Kiribati, Tuvalu and the Marshall Islands, face plants considerable waste management challenges due to Heavy and light Process Industrial process wastes, their small land areas and resultant lack of disposal manufacturing, refineries, scrap materials, off- options. chemical plants, power specification products, slag, Throughout the region, the principal sources plants, mineral extraction tailings and processing of solid waste are residential households and the agricultural, commercial, construction, industrial and All of the above should be included as “municipal solid waste.” institutional sectors. A breakdown of solid waste Agriculture Crops, orchards, Spoiled food wastes, types and sources is provided in Table 8.1. For the vineyards, dairies, agricultural wastes, feedlots, farms hazardous wastes (e.g. purposes of this review these sources are defined as pesticides) giving rise to four major categories of waste: 170
- 2. WASTE Generation rates for MSW vary from city to cold months. The basic infrastructure brings other city and from season to season and have a strong variations in cities and towns (such as Calcutta, correlation with levels of economic development and Dhaka, and Hanoi) with unpaved or poorly paved activity. High-income countries (such as Australia, streets that have large amounts of dust and dirt from Japan, Hong Kong, China, Republic of Korea, and street sweeping. There are big differences in amounts Singapore) produce between 1.1 and 5.0 kg/capita/ of organic waste among cities according to the day; middle-income countries (such as Indonesia, number of trees and shrubs in public places. Large Malaysia and Thailand) generate between 0.52 and and bulky waste items such as abandoned motorcars, 1.0 kg/capita/day, whilst low-income countries (such furniture and packaging are found in the higher- as Bangladesh, India, Viet Nam and Myanmar) have income economies such as Brunei Darussalam, Japan, generation rates of between 0.45 and 0.89 kg/capita/ Republic of Korea and Singapore, but not in day. Figure 8.1 shows MSW generation by the high, low-income countries such as Bangladesh, Cambodia, middle and low-income countries of the region. Myanmar, Nepal, Sri Lanka and Viet Nam. Table 8.2 Taken as a whole, the Asian and Pacific Region provides an illustration of the quantities and types currently produces some 1.5 million tonnes of MSW of MSW generated in selected countries of the South each day and this is expected to more than double Pacific subregion. by 2025 (World Bank 1999). The current estimate for waste generation may be considered as extremely Figure 8.2 Estimated Generation of Municipal Solid conservative; the actual levels are probably more than Waste in Different Subregions double this amount. Figure 8.2 presents the current 2.0 contribution of the various subregions to the waste Total quantity Southeast Asia generated by the region (United Nations 1995, World Northeast Asia Central Asia Bank 1995 and 1998, UNEP/SPREP 1997). 1.5 South Asia The Pacific The composition of municipal solid waste Million tonnes varies significantly across the region (see Figure 8.3) 1.0 with some middle and low income countries generating waste containing over 70 per cent organic content, with a corresponding moisture content in 0.5 excess of 50 per cent. Differences in the characterization and reporting of waste types also 0.0 differ with some municipal authorities including 1992 2000 2010 construction and demolition waste and industrial Year waste as part of the municipal waste stream. Source: United Nations 1995, World Bank 1995 and 1998, UNEP/ Some inter-urban differences relate to climate SPREP 1997 and fuel use. The cities where heating is needed in winter such as Beijing, Shanghai, Seoul and Tokyo Figure 8.3 Approximate Composition of Municipal and where coal is the main source of energy, have Solid Waste in Selected Cities of ESCAP much greater amount of ash in the waste in those Member Countries 100 Figure 8.1 Municipal Solid Waste Generation in 75 Different Groups of Countries in the Percentage Region 2.0 50 Total quantity High-income countries Middle-income countries 25 1.5 Low-income countries Million tonnes 1.0 0 bo ila o e k y hi ng r ai ng l or ou pu ky ko ba ac an gh om iji ap To Se ng m m ar Be M an ol Bo Lu K Ba Sh C Si a 0.5 al Lu Organic waste Plastic Mixed non-organic waste Paper, cardboard 0.0 1992 2000 2010 Year Source: United Nations 1995, World Bank 1995 and 1998, UNEP/ Source: World Bank 1999 SPREP 1997 171
- 3. CHAPTER EIGHT Table 8.2 Quantities and Types of MSW Generated Figure 8.4 Waste Intensity of Industrial Production in Selected South Pacific Countries in Selected Countries in the Region Selected Types of waste % of total Total Amount of PR China Countries generated MSW generated (tonnes per day) Japan Cook Islands 4.75 Australia Organic 32% Glass 24% Plastic 12% Rep. of Korea Metals 10% Hong Kong, China Fiji (Suva, 35.6 the capital) Singapore Metal 10-16% Glass 5-10% 0.0 0.5 1.0 1.5 2.0 2.5 Plastic 7-12% Waste intensity, kg per US$ industrial production Vegetative debris 25-39% Paper 27-34% Source: ESCAP 1997 Vanuatu 15 Vegetative debris 35-40% Wood 25-30% Australia and Japan, the ratio is one to eight. Paper 10-12% However, based on an average ratio for the region, Plastic 6-8% the industrial solid waste generation in the region is Glass/Ceramic 3-5% equivalent to 1 900 million tonnes per annum. This Metals 2-3% amount is expected to increase substantially and at Textile 3-6% the current growth rates, it is estimated that it will Source: World Bank 1997 double in less than 20 years. As the existing industrial solid waste collection, processing and disposal The amount of human faeces in the MSW is systems of many countries are grossly inadequate, significant in squatter areas of many Asian and Pacific such incremental growth will pose very serious cities where “wrap and throw” sanitation is practised challenges. or bucket latrines are emptied into waste containers. The latter is common in many cities (such as Calcutta, 3. Agricultural Waste and Residues Dhaka and Hanoi) of the region where sewerage Expanding agricultural production has systems are minimal. naturally resulted in increased quantities of livestock waste, agricultural crop residues and agro-industrial 2. Industrial Solid Waste by-products. Table 8.3 provides an estimate of annual Industrial solid waste in the Asian and Pacific production of agricultural waste and residues in some Region, as elsewhere, encompasses a wide range of selected countries in the region (ESCAP 1997); the materials of varying environmental toxicity. Typically implications of liquid and slurry waste for receiving this range would include paper, packaging materials, inland and coastal waters is examined in Chapter 4. waste from food processing, oils, solvents, resins, Among the countries in the Asian and Pacific paints and sludges, glass, ceramics, stones, metals, Region, People’s Republic of China produces the plastics, rubber, leather, wood, cloth, straw, abrasives, largest quantities of agriculture waste and crop etc. As with municipal solid waste, the absence of a residues followed by India. In People’s Republic of regularly up-dated and systematic database on China, some 587 million tonnes of residues are industrial solid waste ensures that the exact rates of generated annually from the production of rice, corn generation are largely unknown. and wheat alone (see Figure 8.5). Figure 8.6 illustrates Industrial solid waste generation varies, not the proportions of waste that Malaysia generates from only between countries at different stages of the production of rice, palm oil, rubber, coconut and development but also between developing countries forest products (ESCAP 1997). In Myanmar, crop (see Figure 8.4). In People’s Republic of China, for waste and residues amount to some 4 million tonnes example, the generation ratio of municipal to per year (of which more than half constitutes rice industrial solid waste is one to three. In Bangladesh, husk), whilst annual animal waste production is Sri Lanka and Pakistan, however, this ratio is much about 28 million tonnes with more than 80 per cent less. In high-income, developed countries, such as of this coming from cattle husbandry. 172
- 4. WASTE Table 8.3 Approximate Estimate of Annual Figure 8.6 Proportionate Annual Production of Production of Agricultural Waste and Agricultural Waste in Malaysia Residues in Selected Countries in the 2.2% Region 10.7% (0.676 million tonnes) (3.30 million tonnes) Annual production, million tonnes 11.2% (3.434 million tonnes) Country Agricultural waste Crop Total (manure/animal residues dung) 54.5% (16.77 million tonnes) Bangladesh 15 30 45 PR China 255 587 842 21.4% India 240 320 560 (6.58 million tonnes) Coconut Indonesia 32 90 122 Oil palm Wood Malaysia 12 30 42 Rice Myanmar 28 4 32 Rubber Nepal 4 12 16 Pakistan 16 68 84 Source: ESCAP 1997 Philippines 20 12 32 Rep. of Korea 15 10 25 Sri Lanka 6 3 9 Thailand 25 47 72 mustard stalks, sesame sticks, castor seed stalks, Source: ESCAP 1997 sunflower stalks and tobacco stalks (ESCAP 1997). In Sri Lanka, agricultural waste comprises animal waste, paddy husk, straw, coir fibre and coir Figure 8.5 Proportionate Annual Production of dust, bagasse, as well as the waste from the timber Agricultural Waste in People’s Republic industry, which comprises sawdust, off-cuts and of China charcoal. Commercial rice milling generates around 2 million tonnes of paddy husk per annum, whilst 2.33% 1.87% coir (the fibres from coconut husks) processing (13 million tonnes) (11 million tonnes) 5.45% generates an annual 700 000 tonnes of coir dust (32 million tonnes) (ESCAP 1997). Each year, Thailand produces about 6.23% (36 million tonnes) 4.6 million tonnes of paddy husk, 35 million tonnes 35.44% (208 million tonnes) of rice straw, 7 million tonnes of bagasse and more than 25 million tonnes of animal waste (ESCAP 1997). Corn Other countries such as Australia, Cambodia, Japan, 18.22% (107 million tonnes) Rice Lao People’s Democratic Republic, Nepal, New Wheat Zealand, Republic of Korea, Viet Nam and Small Oil-crop Island States in the South Pacific also generate huge Tuber quantities of agricultural waste and residues (ESCAP Soybean 1997, UNEP/SREP 1997). 30.46% Cotton (108 million tonnes) 4. Hazardous Waste Source: ESCAP 1997 With rapid development in agriculture, industry, commerce, hospital and health-care facilities, the Asian and Pacific Region is consuming significant In Pakistan, about 56.22 million tonnes of quantities of toxic chemicals and producing a large different crop residues are generated of which amount of hazardous waste. Currently, there are 12.46 million tonnes originate from cotton, about 110 000 types of toxic chemicals commercially 2.90 million tonnes from maize, 12.87 million tonnes available. Each year, another 1 000 new chemicals from sugarcane, 8.16 million tonnes from rice and are added to the market for industrial and other uses. 19.83 million tonnes from wheat. In addition, The availability of robust data on the Pakistan produces other wastes amounting to some generation of hazardous waste for the Asian and 28 million tonnes of which 58 per cent is animal Pacific Region is limited by the reliability of waste, 40 per cent is sugarcane bagasse and the information on the quantities and types of hazardous remaining two per cent comprises a mix of jute sticks, waste produced at the country level. This is due to a 173
- 5. CHAPTER EIGHT variety of reasons, including the lack of qualified Table 8.4 Conservative Estimate of Annual personnel to undertake the necessary assessment, Production of Hazardous Waste in the reluctance of industries to provide process Selected Countries and Territories in the information (including waste arising data) and a poor Asian and Pacific Region appreciation of the extent to which generated waste is hazardous. Where data is available, significant Estimated annual production, tonnes x 103 Country/Territory difficulties are encountered in seeking to draw 1993 2000 2010 international comparisons due to differences in classification and definition of hazardous waste from Australia 109 275 514 country to country within in the region. Bangladesh 738 1 075 1 560 Most hazardous waste is the by-product of a PR China 50 000 130 000 250 000 broad spectrum of industrial, agricultural and Hong Kong, China 35 88 165 manufacturing processes, nuclear establishments, India 39 000 82 000 156 000 hospitals and health-care facilities. Primarily, Indonesia 5 000 12 000 23 000 high-volume generators of industrial hazardous waste Japan 82 220 415 are the chemical, petrochemical, petroleum, metals, Malaysia 377 400 1 750 wood treatment, pulp and paper, leather, textiles and Mongolia 15 26 45 energy production plants (coal-fired and nuclear Nepal 130 260 450 power plants and petroleum production plants). New Zealand 22 62 120 Small- and medium-sized industries that generate Pakistan 786 1 735 3 100 hazardous waste include auto and equipment repair Philippines 115 285 530 shops, electroplating and metal finishing shops, textile Papua New Guinea 25 45 80 factories, hospital and health-care centres, dry Rep. of Korea 269 670 1 265 cleaners and pesticide users. Singapore 28 72 135 The principal types of hazardous waste Sri Lanka 114 250 460 generated in the Asian and Pacific Region, include Thailand 882 2 215 4 120 waste solvents, chlorine bearing waste and pesticide- Viet Nam 460 910 1 560 organophosphate-herbicide-urea-fungicide bearing Source: Hernandez 1993, UNEP 1994, United Nations 1995, and Nelson waste. In particular, solvents are extensively used in 1997 the region and, as a consequence, large quantities of waste solvents are produced. The types, quantities and sources of hazardous are generated annually (Malaysia Environmental waste vary significantly from country to country and Quality Report 1998), whilst it is reported that Fiji, are influenced by the extent and diversity of industrial Solomon Islands, Papua New Guinea, Federated activity. Table 8.4 provides a conservative estimate States of Micronesia, Samoa, Vanuatu, Tonga, of the past, current and future hazardous waste Marshall Islands, Nauru, Cooks Islands, Kiribati generation trends in a number of selected countries and Tuvalu collectively generate approximately (Hernandez 1993, UNEP 1994, United Nations 1995, 10.55 million litres of waste oil per year (UNEP/ Nelson 1997). However, it must be stressed that such SPREP 1997). estimations are founded on data that may be considered incomplete and unverified. In the absence B. Environmental Impacts of Waste of reliable regional data, a study by the World Bank The economic growth and urbanization (WRI 1995) estimated the hazardous waste toxic experienced in many parts of the Asian and Pacific releases in the Asian and Pacific region and predicted Region over the past 10-15 years, has significantly significant increases in hazardous waste production escalated the quantities of MSW being generated in each year in People’s Republic of China, India, many cities, including Bangkok, Beijing, Mumbai, Indonesia, the Philippines, and Thailand. An even Calcutta, Colombo, Dhaka, Hanoi, Jakarta, Kuala more significant conclusion of the study was that the Lumpur, Manila and Shanghai (United Nations 1995, intensity of hazardous waste generation per unit of Koe and Aziz 1995). Uncontrolled, open dumping output is also set to increase (WRI 1995). on the peripheries of many of the region’s cities has Better and more reliable data are available for resulting in the degradation of valuable land the quantities of petroleum waste produced in resources and the creation of long-term environmental countries that extract or process crude oil such as in and human health problems. The events of July 2000 Brunei Darussalam, People’s Republic of China, India, at the Quezon City garbage dump on the outskirts of Indonesia, Malaysia, Japan and Republic of Korea. Manila, where hundreds of people were killed by In Malaysia, 0.71 metric tonnes of petroleum waste the collapse of a “seven storey high” open dump, 174
- 6. WASTE stands testament to the direct potential consequences been accompanied by a commensurate expansion in of uncontrolled dumping. the provision of waste treatment and management Throughout the region, indiscriminate facilities. The uncontrolled dumping of biomedical dumping has led to the contamination of surface and waste has the potential for transporting pathogens groundwater supplies, whilst open burning of waste (disease producing organisms), whilst the contributes significantly to urban air pollution. At a indiscriminate disposal of oils, used batteries, global level, the uncontrolled release of methane, discarded paints, spent chemicals and carcinogens, which is produced as a by-product of the such as asbestos, can cause significant adverse decomposition of organic wastes, represents a impacts on human health and the environment. significant proportion of the region’s contribution to Various incidents of pollution have also been the greenhouse effect. reported from industrial waste, abattoirs or food The increase in potentially hazardous processing plants along with biocides and toxic industrial, biomedical and nuclear wastes has not effluents from sawmills and timber processing areas Table 8.5 Impacts of Various Categories of Wastes on Water, Soil and Air in Selected Countries of Different Subregions Agricultural wastes and residues Municipal wastes Industrial wastes Hazardous wastes Water Land Air Water Land Air Water Land Air Water Land Air Pollution Pollution Pollution Pollution Pollution Pollution Pollution Pollution Pollution Pollution Pollution Pollution Australia ⊕ ⊕ ❍ ⊕ ⊕ ❍ ⊕ ⊕ ❍ ⊕ ⊕ ❍ Bangladesh • ⊕ ❍ • ⊕ ⊕ • ⊕ ❍ • ⊕ ❍ Brunei Darussalam ❍ ❍ ❍ ⊕ ❍ ❍ ❍ ❍ ❍ ❍ ❍ ❍ Cambodia • ⊕ ❍ • ⊕ ❍ • ⊕ ❍ • ⊕ ❍ PR China • ⊕ ⊕ • ⊕ ❍ • ⊕ ❍ • ⊕ ❍ Cooks Islands ⊕ ⊕ ❍ ⊕ ⊕ ❍ ⊕ ⊕ ❍ ⊕ ⊕ ❍ Fiji ⊕ ⊕ ❍ • ⊕ ❍ • ⊕ ❍ • ⊕ ❍ Hong Kong, China ⊕ ⊕ ❍ ⊕ ⊕ ❍ ⊕ ⊕ ❍ ⊕ ❍ ❍ India • ⊕ ❍ • ⊕ ❍ • ⊕ ⊕ • ⊕ ❍ Indonesia • ⊕ ❍ • • ❍ • • ❍ • ⊕ ❍ Japan ⊕ ❍ ❍ ⊕ ❍ ❍ ⊕ ⊕ ❍ ⊕ ⊕ ❍ Kazakhstan ⊕ ❍ ❍ • ❍ ❍ ⊕ ❍ ❍ ⊕ ❍ ❍ Kiribati ⊕ ❍ ❍ ⊕ ❍ ❍ ⊕ ❍ ❍ ⊕ ❍ ❍ Lao People’s Democratic • ⊕ ❍ • • ⊕ ⊕ ⊕ ❍ ⊕ ⊕ ❍ Republic Malaysia • ⊕ ❍ • ⊕ ❍ • • ❍ • • ❍ Maldives ⊕ ❍ ❍ ⊕ ❍ ❍ ⊕ ❍ ❍ ⊕ ❍ ❍ Marshall Islands ⊕ ❍ ❍ ⊕ ⊕ ❍ ⊕ ⊕ ❍ ⊕ ❍ ❍ Micronesia Federated ⊕ ❍ ❍ ⊕ ⊕ ❍ ⊕ ❍ ❍ ⊕ ⊕ ❍ States of Mongolia ⊕ ⊕ ❍ • ⊕ ❍ ⊕ ❍ ❍ ⊕ ❍ ❍ Myanmar ⊕ ⊕ ❍ • • ❍ ⊕ ⊕ ❍ ⊕ ⊕ ❍ Nepal ⊕ ⊕ ❍ ⊕ ⊕ ❍ ⊕ ⊕ ❍ ⊕ ⊕ ❍ New Zealand ⊕ ❍ ❍ ⊕ ⊕ ❍ ⊕ ⊕ ❍ ⊕ ⊕ ❍ Pakistan ⊕ ⊕ ❍ • ⊕ ❍ • ⊕ ⊕ • ⊕ ⊕ Papua New Guinea ⊕ ⊕ ❍ • ⊕ ❍ ⊕ ⊕ ❍ ⊕ ⊕ ❍ Philippines • ⊕ ❍ • • ❍ • • ❍ • • ❍ Rep. of Korea ⊕ ⊕ ❍ ⊕ ⊕ ❍ ⊕ ⊕ ❍ ⊕ ⊕ ❍ Samoa ⊕ ⊕ ❍ ⊕ ⊕ ❍ ⊕ ⊕ ❍ ⊕ ⊕ ❍ Singapore ❍ ❍ ❍ ❍ ❍ ❍ ❍ ❍ ❍ ❍ ❍ ❍ Solomon Islands ⊕ ⊕ ❍ ⊕ ⊕ ❍ ⊕ ⊕ ❍ ⊕ ⊕ ❍ Sri Lanka ⊕ ⊕ ❍ • ⊕ ❍ • ⊕ ❍ • ⊕ ❍ Tonga ⊕ ⊕ ❍ ⊕ ⊕ ❍ ⊕ ❍ ❍ ⊕ ❍ ❍ Tuvalu ⊕ ❍ ❍ ⊕ ⊕ ❍ ⊕ ❍ ❍ ⊕ ❍ ❍ Thailand • ⊕ ❍ • • ❍ • • ⊕ • • ⊕ Vanuatu ❍ ❍ ❍ ⊕ ⊕ ❍ ⊕ ⊕ ❍ ⊕ ⊕ ❍ Viet Nam • • ❍ • • ❍ • • ⊕ • • ❍ Source: Anjello and Ranawana 1996, ESCAP 1997, Higham 1998, Hunt 1996, Kiser 1998, Koe and Aziz 1995, Leong and Quah 1995, ST 1995, World Bank 1995 and 1998, ENV 1997 Key: • severe ⊕ moderate ❍ moderate to negligible 175
- 7. CHAPTER EIGHT (UNEP/SPREP 1997). The overall impacts of different 1. Municipal Solid Waste categories of wastes on water, soil and air in some (a) Collection and Transfer selected countries of various subregions are given in In many cities of the region, municipal solid Table 8.5 (Anjello and Ranawana 1996, ESCAP 1997, waste (MSW) is gathered in a variety of containers Higham 1998, Hunt 1996, Kiser 1998, Koe and Aziz ranging from old kerosene cans and rattan baskets to 1995, Leong and Quah 1995, ST 1995, World Bank used grocery bags and plastic drums or bins. In 1995 and 1998, ENV 1997). some cities, neighbourhood-dumping areas have been designated (formally or informally) on roadsides from WASTE PROCESSING AND CONTROL which bagged and loose waste is collected. Waste collection (and, where appropriate, waste A. Current Waste Management Practices transfer) frequently constitutes the major solid waste As indicated in Table 8.6, the current practices management cost for the region’s cities. A wide employed in the management of solid waste within variety of collection systems are used including door- the Asian and Pacific Region vary considerably to-door collection and indirect collection, by which between the low, middle and high-income countries. containers, skips or communal bins are placed near The extent of application and the effectiveness of markets, in residential areas and other appropriate these practices are reviewed in the subsections that locations. In the high-income industrialized countries follow. of Australia, Japan, New Zealand, Republic of Korea Table 8.6 Comparison of Typical Solid Waste Management Practices Activity Low income Middle income High income Source reduction No organized programmes, but reuse Some discussion of source reduction, Organized education programmes and low per capita waste generation but rarely incorporated in to any are beginning to emphasize source rates are common. organized programme. reduction and reuse of materials. Collection Sporadic and inefficient. Improved service and increased Collection rate greater than 90 per Service is limited to high visibility collection from residential areas. cent. Compactor trucks and highly areas, the wealthy, and businesses Larger vehicle fleet and more machined vehicles are common. willing to pay. mechanization. Recycling Most recycling is through the Informal sector still involved, some Recyclable material collection informal sector and waste picking. high technology sorting and services and high technology sorting Mainly localized markets and processing facilities. Materials are and processing facilities. Increasing imports of materials for recycling. often imported for recycling. attention towards long-term markets. Composting Rarely undertaken formally even Large composting plants are Becoming more popular at both though the waste stream has a high generally unsuccessful, some backyard and large-scale facilities. percentage of organic material. small-scale composting projects Waste stream has a smaller portion are more sustainable. of compostables than low and middle-income countries. Incineration Not common or successful because Some incinerators are used, but Prevalent in areas with high land of high capital and operation costs, experiencing financial and costs. Most incinerators have some high moisture content in the waste, operational difficulties; not as form of environmental controls and and high percentage of inerts. common as high-income countries. some type of energy recovery system. Landfilling Low-technology sites, usually open Some controlled and sanitary Sanitary landfills with a combination dumping of wastes. landfills with some environmental of liners, leak detection, leachate controls. Open dumping is still collection system, and gas collection common. and treatment systems. Costs Collection costs represent 80 to 90 per Collection costs represent 50 to Collection costs can represent less cent of the municipal solid waste 80 per cent of the municipal solid than 10 per cent of the budget. Large management budget. Waste fees waste management budget. Waste budget allocations to intermediate are regulated by some local fees are regulated by some local and waste treatment facilities. Upfront governments, but the fee collection national governments, more community participation reduces system is very inefficient. innovation in fee collection. costs and increases options available to waste planners (e.g. recycling and composting). Source: World Bank 1999 176
- 8. WASTE and Singapore, collection and transfer services are efficiency and then transferring the waste to larger capital-intensive and highly mechanized employing haulage vehicles for delivery to the city’s disposal standardized collection vehicles, compactors and sites. In addition, transfer stations often serve as containers and providing collection rates in the range material recovery centres where recyclables are of 90 per cent and collection services to most urban separated for reuse/recycling. In developing and even rural areas. Source separation and countries, few cities have established well-designed subsequent collection of recyclables is governed by transfer stations with sufficient facilities, equipment regulation and is facilitated by the provision of and vehicles to manage and process their collected colour-coded bins or bags or by the establishment of waste. area recycling centres. Whilst a significant number Increasingly, collection services are being of these cities continue to retain parts of the collection privatized. In the region as a whole, more than process within their direct municipal control, many 20 per cent of the collection services are now others have contracted private sector waste collection contracted out to private waste collection companies. firms and have made private sector trade and This practice is gaining momentum, especially in industrial establishments responsible for the collection Australia; Hong Kong, China; Malaysia; Republic of and disposal of their own solid waste. Korea; Singapore and Thailand. In Singapore, as In the middle-and low-income countries of the elsewhere, the main motivation for privatization is region, waste collection and transfer tend to be cost saving; the cost of collection and disposal of labour-intensive and are undertaken by personnel refuse has tripled during the last decade to more directly employed by the municipal authorities. than US$700 million. In 1994, the Ministry of the Waste collection is undertaken using low-levels of Environment (ENV) with an authorized capital fund mechanization with handcarts and tractor-trailers of US$250 million created a private limited company being used to collect waste from communal bins and (SEMAC Pte Ltd.). In April 1996, SEMAC took over neighbourhood dumping areas. The collection the collection unit of the ENV, allowing the Ministry systems are relatively inefficient as the collection to concentrates on its regulatory role of safeguarding vehicles and containers are not fitted with public health and environmental standards through compactors, necessitating the transportation of loose legislative and licensing controls (ENV 1997). waste and, hence, imposing a constraint on the Financial constraints and the lack of technical capacity of the collection system. expertise severely limit the effectiveness of solid waste In some cities of the lower and middle income management in the cities and towns of the poorer countries, such as Dhaka, Calcutta and Hanoi, developing nations. Shortages of storage bins, collection rates are significantly less than 50 per cent, collection vehicles, non-existent and/or inadequate whilst collection rates of well over 50 per cent are transfer stations, traffic congestion and a lack of achieved in Bangkok, Mumbai, Delhi, Jakarta, Kuala public compliance are factors affecting collection Lumpur, Manila and Shanghai. By comparison, efficiency, resulting in low waste collection rates. In collection rates in Hong Kong, China, Seoul, some cities, heaps of refuse are routinely left Singapore, Sydney and Tokyo are in excess of 90 per uncollected and there are illegal deposits on open cent. There are, of course, disparities in collection land, drains and canals. The lack of coordination services between the rich and poor areas and in a and overlapping of responsibilities among various number of cities collection services are not extended government agencies and different levels of local to the poor, especially those in illegal settlements. government also contribute to the problem (UNEP/ In some cities, decentralized pre-collection has SPREP 1997). proven effective in achieving increased collection rates. For example, the kampongs (villages) of (b) Material Recovery, Reuse and Recycling Indonesian cities have formal responsibility for In many countries of the region, including primary collection, the waste from each kampong Japan, Republic of Korea and Singapore, the rate of being delivered to a transfer station or temporary recovery of recyclable materials from MSW has storage point for collection by the city service. Delhi improved significantly in recent years (ENV 1997, and Chennai employ similar systems and have Hara 1997). Within the region, overall resource achieved reasonably good collection systems as a recovery has grown from less than 10 per cent of all result. Elsewhere, the lack of efficient transfer MSW in 1988 to 30 per cent in 1998, with much of facilities represents a weak link in the MSW collection the increase attributable to greater rates of recovery and transportation system. In cities such as Tokyo, of paper and paperboard, plastics, glass and metals. Singapore and Sydney, transfer stations are used as a In terms of the total tonnage of materials means of gathering waste from a sub-division of the recovered, paper and paperboard represent the largest city, compacting the waste to maximize transportation category (almost 60 per cent of the total) and this 177
- 9. CHAPTER EIGHT often masks the importance of recovery rates for other the lack of formal promotion or support of the materials. For example, recovered aluminium Government. represents only about 3 per cent of the total tonnage Waste recycling in developing countries relies of recovered materials, yet in terms of its economic largely on the informal recovery of materials by value, recovered aluminium far exceeds the paper scavengers or waste pickers. In cities of the Asian product category. and Pacific, it has been estimated that up to two per Among the Asian and Pacific countries, Japan cent of the population survives by recovering recycles huge quantities of materials from MSW materials from waste to sell for reuse or recycling or stream. Almost half of the waste paper is retrieved for their own consumption. In some cities these waste or recycled in Japan and that the retrieval rate scavengers constitute large communities: increased from about 48 per cent in 1990 to about approximately 15 000 squatters make their living by 56 per cent in 1997. Similarly, between 1990 and sifting through the Smoky Mountain municipal 1997 the recycling rates of aluminium and steel cans rubbish dump in Philippines (Anonymous 1995); it increased from 40 per cent to 60 per cent and 45 per is estimated that in Bangalore there are between cent to 70 per cent respectively, whilst during the 20 000 to 30 000 scavengers (Hunt 1996); and Jakarta same period glass recycling rates increased from is served by between 15 000 and 20 000 waste pickers 48 per cent to 57 per cent (Hara 1997). Other countries (Wahyono and Sahwan 1998). Some of these of the region, such as Australia, Bangladesh, People’s communities have high levels of organization and Republic of China, Malaysia, New Zealand, the creation of scavenger co-ops has gained Philippines, Republic of Korea, Singapore and momentum in some countries of the region including Thailand, recycle significant quantities of paper and the Philippines, India and Indonesia (Medina 1998). cardboard, plastics, glass and metals; as an example The role and lifestyle of waste scavengers are the categories of materials recycled in Singapore in highlighted in Box 8.1 (Hunt 1996, Pitot 1996). 1997 are shown in Table 8.7 (ENV 1997). In many cases, particularly in the more developed economies, (c) Disposal Methods for MSW recycling is undertaken at source (i.e. at the Various disposal methods of municipal solid household, business and industry level) and is waste in selected countries/territories in the region actively promoted by governments, NGOs and the are given in Table 8.8. private sector (United Nations 1995). Elsewhere, such as in Viet Nam (Hebert 1995, World Bank 1995), (i) Open Dumping informal recycling networks have flourished despite Open dumping is the most widespread method of solid waste disposal in the region and typically involves the uncontrolled disposal of waste without Table 8.7 Various Categories of Materials Recycled measures to control leachate, dust, odour, landfill gas from MSW in Singapore in 1997 or vermin. In some cities, open burning of waste is practised at dumpsites. In many coastal cities, waste Estimated quantity in tonnes is dumped along the shoreline and into the sea, such in 1997 Recycling as Joyapura in Indonesian or dumped in coastal and rate Waste type Total Total Total inland wetlands and ravines as is being practised in waste waste waste (per cent) Mumbai, Calcutta, Colombo, Dhaka and Manila disposed recycled output (UNEP/SPREP 1997). Food waste 1 085 000 24 700 1 109 700 2.2 The scarcity of available land has led to the Paper/cardboard 576 000 324 000 900 000 36.0 dumping of waste to very high levels; waste thickness Plastics 162 000 35 300 197 300 17.9 Construction debris 126 000 188 000 314 000 59.9 is often over 12 metres and may be over 20 metres, Wood/timber 249 000 34 800 283 800 12.3 which was the case of the Quezon City dumpsite in Horticultural waste 75 400 67 600 143 000 47.3 the Philippines. Earth spoils 75 400 – 75 400 – An additional hazard on uncontrolled Ferrous metals 75 400 893 000 968 400 92.2 Non-ferrous metal 14 000 76 000 90 000 84.4 dumpsites arises from the build-up of landfill gas Used slag 120 000 135 000 255 000 52.9 (predominantly methane), which has led to outbreaks Sludge (Industry/ 50 200 – 50 200 – of fire and to adverse health effects on workers and PUB) adjacent residents (Perla 1997, Wahyono and Sahwan Glass 30 800 4 600 35 400 13.0 Textile/leather 25 200 – 25 200 – 1998). Scrap tyres 5 600 5 700 11 300 50.4 The scarcity of available land has also become Others 126 000 1 300 127 300 1.0 a major problem for the disposal of solid waste in Total 2 976 000 1 790 000 4 586 000 39.0 Small Island Developing States in the South Pacific Source: ENV 1997 subregion. Dumping at sea has frequently been 178
- 10. WASTE Box 8.1 Recycling: Fortunes and Costs There are dozens of recycling enterprises in Hanoi, the Vietnamese capital, despite the fact that it remains one of Asia’s poorest cities. The primary reasons for the scale of waste recycling are resource scarcity and poverty. It is estimated that scavengers in the city collect a daily average of 250 tonnes of waste materials, or more than one third of the 830 tonnes of refuse produced each day by the capital’s 3 million residents. Amongst the materials collected are bottles, paper, metals and plastics. As Hanoi is a resource-poor, labour-abundant city, nearly everything of value within the City’s solid waste is extracted for recycling. The Hong Tien Industrial Cooperative, based in the Hai Ba Trung district, is typical of the enterprises that participate in the recycling of waste materials. The Cooperative specialises in transforming discarded plastic materials into marketable synthetic leather. Each week, during the four months preceding the start of the school year, the workers at Hong Tien take one tonne of old plastic sandals and turn them into 3 000 new red-and-black school bags. During the remaining eight months of the year, Hong Tien produces plastic sheeting that is used for many purposes. Hog Tien and numerous other similar enterprises form an extensive waste recycling network that has developed without government assistance and without the formation of commercial monopolies, as have emerged in many other big Asian cities including Bangkok, Dhaka, Calcutta, Jakarta, Manila and Beijing. The waste scavengers of Hanoi operate at no cost to the city’s municipal authority and provide both financial benefits to the society in the form of avoided costs (such as landfill space, collection and transportation, energy, employment generation, protection of public health) as well as ecological benefits in the form of resource conservation and environmental protection. The recycled materials from wastes work their way from the ‘waste economy’ back into a productive economy through an elaborate system of buyers. A network of scavengers and junk buyers (estimated to comprise some 6 000 people during the August peak season) collect discarded goods for onward sale to junk dealers, who in turn re-sell the materials in bulk to factories and exporters. A large number of waste scavengers shuffle from house to house along the streets of Hanoi offering to buy empty beer cars, worn-out plastic sandals, old bottles and used newspapers. On productive days, each scavenger can earn up to Dong 20 000 (US$1.90), although on bad days they may take home almost nothing. It is estimated that some 1 500 families make their living by buying and selling waste materials and a trade network has emerged with clients from Hanoi and the surrounding provinces regularly visiting individual junk dealers to buy, and pre-order, specific types of recycled materials. However, the business of waste scavenging is not without its human health costs and the rewards for some engaged in extracting materials from waste are inadequate to alleviate their poverty. In many cases, the scavengers picking over the mixed waste of the dumping grounds do not wear protective clothing nor do they have access to washing facilities. The majority of dumpsite scavengers are women and children, who live in overcrowded, poorly ventilated temporary huts, often on the peripheries of the waste dump. The scavengers seldom have access to public or private latrines, are malnourished and suffer from a range of illnesses including worm infections, scabies, respiratory tract infection, abdominal pain, fever and other unspecified diseases. Source: 1. Hebert 1995 2. World Bank 1995 adopted as a solution with old cars and refrigerators employs disused tin mines for MSW landfills around being dumped into the lagoons of French Polynesia the city. and municipal waste being bundled into wire gabions The generation of landfill gas has been turned for use in sea wall construction in the Marshall to advantageous use at a number of landfills in the Islands. In the latter case, the gabions allowed region through the development of electricity leachate and loose waste items to pass directly into generation facilities. A landfill/biogas power the ocean water. generation facility is currently commencing construction in Ho Chi Minh City and others are (ii) Landfilling planned for Chennai and, possibly, Colombo. In the Asian and Pacific Region, the disposal In the densely populated cities and towns of of solid waste at a semi-engineered or full sanitary the region, the land availability for landfill siting is a landfill has been adopted by cities from both low major constraint. For example, in Hong Kong, China and high-income countries as the most attractive of and in Singapore severe land constraints have led to disposal options. Bandung, Singapore, Hong Kong, complex engineering infrastructure solutions being China, Seoul, Chennai and Tokyo do have well- developed to ensure high standards of operational designed and reasonably operated sanitary landfills, and maintenance control and have enabled the whilst other cities in Australia, People’s Republic of development of acceptable landfill solutions in coastal China, Japan, Republic of Korea, Malaysia and areas, offshore islands and mountainous terrain. In Thailand have adopted controlled tipping or sanitary Singapore, the two existing landfill sites are nearing land filling for solid waste disposal. Kuala Lumpur their capacity and an offshore landfill at Pulau 179
- 11. CHAPTER EIGHT Table 8.8 Disposal Methods for Municipal Solid The forced-air composting plant in Hanoi is a Waste in Selected Countries of the Region typical example. The plant is currently operating at 20 per cent of its design capacity, whilst the municipal Disposal methods authorities have been unable to persuade local Country/ Territory Composting Open Land Incineration Others* farmers to take the product free as it is too (per cent) dumping filling (per cent) (per cent) (per cent) (per cent) contaminated with plastics and glass. Elsewhere, small-scale neighbourhood Australia 10 – 80 5 5 composting is actively promoted through research Bangladesh – 95 – 5 PR China 10 50 30 2 8 and pilot projects. In Indonesia, such schemes have Cook Islands – 60 30 – 10 been underway for over a decade and small private Fiji – 90 – – 10 Hong Kong, – 20 60 5 15 enterprises have been established in Cipinang Besar China and Watam (East Jakarta) that supply compost to India 10 60 15 5 10 estate gardens and golf courses. In Bandung, a box Indonesia 15 60 10 2 13 Japan 10 – 15 75 – type windrow composting plant has been established Kazakhstan – 85 – – 15 alongside and existing dumpsite (Perla 1997), whilst Rep. of 5 20 60 5 10 Korea Ho Chi Minh City has two small composting plants Maldives – 90 – – 10 (World Bank 1995). Small-scale vermicomposting Malaysia 10 50 30 5 5 (a process that uses worms and micro-organisms to Mongolia 5 85 – – 10 Myanmar 5 80 10 – 5 convert organic materials into nutrient-rich compost) Nepal 5 70 10 – 15 of organic waste is carried out in open boxes or New Zealand 5 – 85 – 10 Pakistan 5 80 5 – 10 containers and is practised in People’s Republic of Philippines 10 75 10 – 5 China, India, Indonesia and Philippines (Perla 1997, Papua New – 80 – 5 15 Thom 1997). Guinea Samoa – 80 – – 20 At a slightly larger scale, the composting of Singapore – – 30 70 – organic MSW with agricultural waste and sludge Sri Lanka 5 85 – – 10 from municipal sewage treatment plants is being Thailand 10 65 5 5 15 Viet Nam 10 70 – – 20 piloted in Australia, Bangladesh, People’s Republic of China, India, Philippines and Thailand. However, Source: ENV 1997 land availability, high operational, maintenance and *Animal feeding, dumping in water, ploughing into soil, and open burning. transportation costs and incomplete waste material segregation remain major constraints to the adoption of co-composting. Semakau is nearing completion at a cost of S$840 (US$500) million. The landfill consists of a 7 km (iv) Incineration long bund enclosing 350 hectares of sea that will take For much of the Asian and Pacific Region, the care of waste disposal needs of Singapore up to 2030 incineration of MSW remains an expensive and and beyond. The waste is put into cells and this will technically inappropriate waste disposal solution. eventually rise to 15 metres above sea level (ST 1999). The development of waste incineration facilities has been constrained by the high capital, operating and (iii) Composting maintenance costs and by increasingly stringent air Whilst small-scale composting of organic waste pollution control regulations (UNEP 1998). In is widespread in the region, attempts to introduce addition, the combustible fraction of much of the large-scale composting as a means of reducing the MSW generated in the low and middle-income quantities of municipal solid waste requiring disposal, countries of the region is relatively low, with high or with the intention of creating a revenue stream organic and moisture contents. For example, the from the sale of compost, have been met with limited Indonesian city of Surabaya imported an incinerator success. Most of the composting plants in the region that is currently operating at two-thirds of its design are neither functioning at full capacity nor do they capacity as the waste needs to be dried on-site for produce compost of marketable value. The high five days before it is suitable for combustion. Even operating and maintenance costs results in compost without the cost of air pollution control mechanisms, costs that are higher than commercially available it is estimated that the cost of waste incineration in fertilisers, whilst the lack of material segregation this instance is roughly 10 times greater than the cost produces compost contaminated with plastic, glass of open dumping/land filling in other Indonesian and toxic residues. Under such circumstances, little cities. of the compost produced is suitable for agriculture Up-to-date, full-scale incinerators are currently application. in service only in countries such as Australia, People’s 180
- 12. WASTE Republic of China, Hong Kong, China, Indonesia, assistance. Hong Kong, China has closed its Japan, Singapore and the Republic of Korea, where incinerators because they could not meet air pollution the combustible fraction of MSW is high and in some standards, but new plants are under consideration instances has been raised by moisture-reducing (Wan et al 1998). compaction at transfer stations. The three incinerators operating in Singapore 2. Industrial Solid Waste burn more than 75 per cent of the 6 700 tonnes of The methods employed in the disposal of MSW that is collected each day (ENV 1997) and a industrial solid waste are broadly the same as those fourth incinerator with a capacity of 3 000 tonnes per used to dispose of MSW and comprise open day is expected to become operational during 2000. dumping, land filling (both semi-engineered and The total electrical generated by the existing plants sanitary landfilling) and incineration. is about 60 megawatts (250 to 300 kWh/tonne MSW In many countries, including Bangladesh, incinerated), a portion of which is used to run People’s Republic of China, India, Indonesia, incinerator operations, and the balance is sold to the Malaysia, Philippines and Thailand, non-hazardous national electricity grid. The planned new plant, industrial solid waste is accepted at either open costing S$1 billion, will generate 80 megawatts of dumps or landfills along with municipal solid waste electricity of which 20 megawatts will be consumed (although where facilities are available potentially by the plant and the remainder will be sold to hazardous industrial solid waste is disposed of either Singapore Power (ENV 1997). in secure landfills or is incinerated). In those The Republic of Korea plans to raise the developing countries with few waste management incinerated portion of their MSW from 8.9 per cent facilities, industrial waste is often dumped on private in 1998 to 20 per cent by 2001 (Government of the land or is buried in dump pits within or adjacent to Republic of Korea, 1999), whilst Japan has 1900 the site of the industrial facility from which it has existing waste incinerators, of which 1584 incinerators emanated. are operated by local governments with the balance run by private companies (ASIAN WATER 1999). In 3. Agricultural Waste and Residues People’s Republic of China, Beihai, Shenyang, The principal disposal methods for agricultural Guangzhou, Beijing and Shanghai have all begun waste, in a number of selected countries within the constructing incineration plants for MSW with foreign region, are presented in Table 8.9. Table 8.9 Disposal Methods of Agricultural Waste and Residues in Selected Countries in the Region/Area Disposal methods of agricultural waste and residues Country Land Fish Biogas Utilization as Composting application farming production Building Fuel Animal feed materials Australia ❍ ❐ q ❍ ❐ ❍ ❐ Bangladesh ❍ ❐ ❐ ❐ q ❍ q Cambodia ❍ ❍ ❍ ❍ q ❍ q PR China q q q q q q q India q ❍ q q q q q Indonesia q q q ❍ q q ❍ Japan ❍ ❍ q ❍ ❍ ❍ ❍ Lao People’s Democratic ❍ ❍ ❍ ❐ q q q Republic Malaysia ❍ ❍ q ❍ q q ❍ Myanmar ❍ ❍ ❍ ❍ ❍ ❍ q Nepal ❐ ❐ ❐ ❐ ❍ ❍ ❐ New Zealand ❍ ❐ ❍ ❍ ❍ ❍ ❐ Pakistan ❐ ❐ ❍ ❍ ❍ ❍ ❐ Philippines ❍ ❍ q q q q q Rep. of Korea ❍ ❍ q ❍ ❍ ❍ ❍ Sri Lanka ❐ ❐ ❍ ❍ ❍ ❍ ❍ Thailand q q q q q q q Viet Nam q q q q q q q Source: ESCAP 1997 Legend: q High ❍ Moderate ❐ Low 181
- 13. CHAPTER EIGHT In most traditional, sedentary agricultural facility has also been developed in West Java systems, farmers use the land application of raw or (Indonesia) to treat hazardous waste from composted agricultural wastes as a means of recycling JABOTABEK (Jakarta, Bogor, Tangeran, and Behasi) of valuable nutrients and organics back into the soil industrial area. Between 1994 and 1997, the facility and this remains the most widespread means of increased the quantities of treated hazardous waste disposal. Similarly, fish farming communities in from 9.7 tonnes to 29 tonnes, although the economic Bangladesh, People’s Republic of China, India, and political crisis of 1998-1999 saw industrial Indonesia, Malaysia, Philippines, Thailand and Viet production slump with a commensurate decline in Nam commonly integrate fish rearing with the quantities of waste treated to 16.6 tonnes in 1998, agricultural activities such as livestock husbandry, before increasing to 18.8 tonnes in 1999. vegetable and paddy cultivation and fruit farming Japan possesses well-developed systems for (Fauzia and Rosenani 1997, UNEP 1997). treating and disposing of the 500 million tonnes of Many countries with agricultural-based hazardous waste produced by its industries each year. economies use agricultural wastes to produce biogas Recycling and material recovery are encouraged to through anaerobic digestion. The biogas reduce the net amount of wastes requiring treatment (approximately 60 per cent methane) is primarily used and disposal and purpose-build landfills have been directly for cooking, heating and lighting, whilst the developed to receive hazardous waste. However, slurry from the anaerobic digesters is used as liquid the most widely practised disposal options is fertiliser, a feed supplement for cattle and pigs and incineration with some 3 840 hazardous industrial as a medium for soaking seeds prior to germination waste incinerators across the country (ASIAN WATER (Hendersen and Chang 1997). 1999), many of which have energy recovery facility Purpose-built sanitary landfills have been to provide heating or for electrical power generation. developed to receive hazardous waste in Australia, In Hong Kong, China, the Chemical Waste Japan, Malaysia, New Zealand and Republic of Korea, Treatment Centre (CWTC) receives most of the whilst hazardous waste incinerators have been hazardous wastes generated by industries (Chua et developed in Australia, Japan, Hong Kong, China, al 1999) with some solid chemical wastes, including Malaysia, Republic of Korea, Singapore and Thailand asbestos, tannery off-cuts and treatment residues (ASIAN WATER 1998, World Bank 1998). Other being co-disposed at landfills. countries such as Bangladesh, People’s Republic of China, India, Mongolia, the Philippines, Pakistan, Sri 4. Biomedical Waste Lanka and many Island States in the South Pacific The number of hospitals and health care subregion usually co-dispose hazardous waste along institutions in the Asian and Pacific Region has been with MSW in open dumps or seek to store increasing to meet the medical and health care particularly toxic wastes in sealed containers (United requirements of the growing population. Although Nations 1995, UNEP/SPREP 1997). city planners have long taken into consideration the In some countries, including Australia, Japan, provision of medical and health care institutions and Hong Kong, China, Republic of Korea and Singapore, services, until recent years, they, and even municipal progress has been made on methods for detoxification waste management authorities, have paid very little of hazardous waste and subsequent immobilization attention to the wastes generated from these facilities, by fabrication into bricks and other usable materials. which are potentially hazardous to human health and In Thailand, a major programme of hazardous the environment. waste management is underway along the Eastern In recent years, however, serious concern has Seaboard where petrochemical, chemical and arisen regarding the potential for spreading non-ferrous industries produce some 250 000 to pathogens, as well as causing environmental 300 000 tonnes of commercially viable hazardous contamination due to the improper handling and industrial waste each year. A hazardous waste management of clinical and biomedical waste. Whilst treatment plant, managed by the Industrial Estate regulatory programmes and guidelines to control Authority of Thailand, has been established at the waste from such institutions have been introduced Map Ta Phut Industrial Estate, a focal point of the in most developed countries, including Australia, country’s petrochemical and chemical industries. Japan, New Zealand, and Singapore, in developing In Malaysia, the Bukit Nanas Integrated Waste countries, such as Bangladesh, People’s Republic of Treatment Facility is the country’s first comprehensive China, India, Indonesia, Pakistan and the Philippines, treatment plant possessing various facilities including such programmes have yet to be fully developed high-temperature incineration, physical and chemical (Ogawa 1993, WHO 1996, UNEP/SPREP 1997). treatment, stabilization and a secure landfill (Malaysia In Australia, the National Health and Medical 1998). A centralized hazardous waste treatment Research Council has published national guidelines 182