SlideShare una empresa de Scribd logo
1 de 29
Descargar para leer sin conexión
February 2016
Executive Summary
Designing the electric grid for the 21
st
century is one of today’s most important and exciting societal challenges. Regulators,
legislators, utilities, and private industry are evaluating ways to both modernize the aging grid and decarbonize our electricity
supply, while also enabling customer choice, increasing resiliency and reliability, and improving public safety, all at an
affordable cost.
However, modernizing an aging grid will require significant investments over and above those seen in any recent period –
potentially exceeding $1.5 trillion in the U.S. between 2010-2030.
1
Given the large sums of ratepayer funds at stake and the
long-term impact of today’s decisions, it is imperative that such investment is deployed wisely, cost-effectively, and in ways
that leverage the best technology and take advantage of customers’ desire to manage their own energy.
In this report, we explore the capability of distributed energy resources (DERs) to maximize ratepayer benefits while
modernizing the grid. First, we quantify the net societal benefits from proactively leveraging DERs deployed in the next five
years, which we calculate to be worth over $1.4 billion a year in California alone by 2020. Then, we apply this methodology to
the most recently available Investor Owned Utility (IOU) General Rate Case (GRC) filing – Pacific Gas and Electric’s 2017 GRC –
in order to evaluate whether DERs can cost effectively replace real-world planned distribution capacity projects. Finally, we
evaluate the impediments to capturing these benefits in practice. These structural impediments undermine the deployment
of optimal solutions and pose economic risk to consumers, who ultimately bear the burden of an expensive grid. Accordingly,
we suggest several ways to overcome these impediments by improving the prevailing utility regulatory and planning models.
Distributed Energy Resources Offer a Better Alternative
This report presents an economic analysis of building and operating a 21
st
century power grid – a grid that harnesses the full
potential of distributed energy resources such as rooftop solar, smart inverters, energy storage, energy efficiency, and
controllable loads. We find that an electric grid leveraging DERs offers an economically better alternative to the centralized
design of today. DERs bring greater total economic benefits at lower cost, enable more affordability and consumer choice,
and improve flexibility in grid planning and operations, all while facilitating the de-carbonization of our electricity supply.
Over $1.4 Billion per Year in Net Societal Benefits from DERs by 2020
A Pathway to the Distributed Grid
Evaluating the economics of distributed energy resources
and outlining a pathway to capturing their potential value
White Paper
SolarCity Grid Engineering | www.solarcity.com/gridx | Page 2
To evaluate the potential benefits, we build on existing industry methodologies to quantify the net societal benefits of DERs.
Specifically, we borrow the Net Societal Costs/Benefits framework from the Electric Power Research Institute (EPRI),
2
incorporating commonly recognized benefit and cost categories, while also proposing methodologies for several hard-to-
quantify benefit categories that are often excluded from traditional analyses. Next, we incorporate costs related to the
deployment and utilization of DERs, including integration costs at the bulk system and distribution levels, DER equipment
costs, and utility program management costs. Using this structure, we quantify Net Societal Benefits of more than $1.4 billion
a year by 2020 for California alone from DER assets deployed in the 2016-2020 timeframe, as depicted in the previous figure.
In addition to evaluating net societal benefits at the system level, we consider the benefits of DER solutions for specific
distribution projects in order to evaluate whether DERs can actually defer or replace planned utility investments in practice.
Specifically, we apply the relevant set of cost and benefit categories to the actual distribution investment plans from
California’s most recently available GRC filing, which is PG&E’s 2017 General Rate Case Phase I filing. This real-world case
study assesses a commonly voiced critique of utilizing DERs in place of traditional utility infrastructure investments: that not
all avoided cost categories are applicable for every distribution project, or that DERs only provide a subset of their potential
benefits in any specific project. Therefore, we consider only a subset of utility-applicable avoided cost categories when
assessing the set of distribution infrastructure projects in PG&E’s 2017 GRC filing; we also utilize PG&E’s own avoided cost
values rather than our own assumptions. Even using PG&E’s conservative assumptions on this subset of benefits, we quantify
a net benefit for DER solutions used to replace the distribution capacity investments in PG&E’s 2017 GRC.
Utility Regulatory Incentives Must Change in Order to Capture DER Benefits
While our analysis shows net societal benefits from DERs, both at the societal and distribution project levels, under the
prevailing utility regulatory model DER benefits cannot be fully captured. Instead, utilities have a fundamental financial
incentive of “build more to profit more”, which conflicts with the public interest of building and maintaining an affordable
grid. Under today’s regulatory paradigm, utilities see a negative financial impact from utilizing resources for distribution
services that they do not own – which includes the vast majority of distributed energy resources – even if those assets would
deliver higher benefits at lower cost to ratepayers. This financial incentive model is a vestige of how utilities have always
been regulated, a model originally constructed to encourage the expansion of electricity access. However, in this age of
customers managing their energy via DERs, this regulatory model is outdated. This report offers a pathway to removing this
structural obstacle, calling for a regulatory model that neutralizes the conflict of incentives facing utilities. While separating
the role of grid planning and sourcing from the role of grid asset owner – such as through the creation of an independent
distribution system operator (IDSO) – would achieve this objective, some states may choose not to implement an IDSO model
at this time. In these instances, this paper proposes the creation of a new utility sourcing model, which we call Infrastructure-
as-a-Service, that allows utility shareholders to derive income, or a rate of return, from competitively sourced third-party
services. This updated model would help reduce the financial disincentive that currently biases utility decision-making against
DERs, encouraging utilities to deploy grid investments that maximize ratepayer benefits regardless of their ownership.
Grid Planning Must be Modernized in Order to Capture DER Benefits
A second structural impediment to realizing DER benefits is the current grid planning approach, which biases grid design
toward traditional infrastructure rather than distributed alternatives, even if distributed solutions better meet grid needs.
Combined with the “build more to profit more” financial incentive challenge, current grid planning can encourage ‘gold-
plating’, or overinvestment, in grid infrastructure. Furthermore, outdated planning approaches rely on static assumptions
about DER capabilities and focus primarily on mitigating potential integration challenges rather than proactively harnessing
these flexible assets. This report offers a pathway to modernizing grid planning, calling for the utilization of an Integrated
Distribution Planning approach that encourages incorporating DERs into every aspect of planning, rather than merely
accommodating DER interconnection. Additionally, transparency into grid needs and planned investments is fundamental to
realizing benefits. As such, this report recommends a data transparency approach that invites broad stakeholder engagement
and increases industry competition in providing grid solutions.
Key Takeaways
1. Distributed energy resources offer net economic benefits to society worth more than $1.4 billion per year in
California alone by 2020, including benefits related to voltage and power quality, conservation voltage reduction,
grid reliability and resiliency, equipment life extension, and reduced energy prices.
SolarCity Grid Engineering | www.solarcity.com/gridx | Page 3
2. To realize these benefits, the utility regulatory incentive model must change to take advantage of customer
choices to manage their own energy. Utility incentives should promote best-fit, least-cost investment decisions
regardless of service supplier – eliminating the current bias toward utility-owned investments.
3. Utility planning approaches must also be modernized to capture these benefits. Utilization of an integrated
distribution planning framework will unlock the economic promise of distributed energy resources, while widely
sharing utility grid data in standard data formats will invite broader stakeholder engagement and competition.
Recommendations and Next Steps
Our ultimate goal is to help provide concrete evidence and recommendations needed by regulators, legislatures, utilities,
DER providers, and industry stakeholders to transition to a cleaner, more affordable and resilient grid. While the details of
implementing these recommendations would vary from state to state, we see the following as promising steps forward for all
industry stakeholders in modernizing our grid:
1. Future regulatory proceedings and policy venues related to capturing the benefits of DERs should incorporate the
expanded benefit and cost categories identified in this paper.
2. Regulators should look for near-term opportunities to modernize the utility incentive model, either for all utility
earnings or at a minimum for demonstration projects, to eliminate the bias toward utility-owned investments.
3. Regulators should require utilities to modernize their planning processes to integrate and leverage distributed
energy resources, utilizing the integrated distribution planning process identified in this paper.
4. Regulators should require utilities to categorize all planned distribution investments in terms of the underlying grid
need. Utilities should make data available electronically to industry, ideally in a machine-readable format.
Call for Input
We offer this paper as an effort to support the utilization of grid modernization to maximize ratepayer benefits. The
cost/benefit analysis we develop here is an effort meant to expand the industry’s ability to quantify the holistic contribution
that DERs offer to the grid and its customers, extending the familiar cost/benefit framework beyond PV-only analyses and
into full smart inverter and DER portfolios. Furthermore, we recognize that important regulatory proceedings – such as the
CPUC Distribution Resource Plans (DRP) and CPUC Integrated Distributed Energy Resources (IDER) – will play an important
role in giving stakeholders the tools to calculate the value of DERs, and offer this paper a as resource in those efforts.
No single report could adequately address all the issues – engineering, economic, regulatory – that naturally arise during
such a transformative time in the industry. By compiling the major issues in one place, we attempt to advance the discussion
and suggest that this paper includes a “table of contents” of critical topics for regulators and industry stakeholders to
consider when evaluating the full potential of distributed energy resources.
There are many details of this paper that can be refined, including utilizing more complete data sets to inform the
cost/benefit analysis. We welcome ongoing dialogues with utilities and other stakeholders to improve the assumptions or
calculations herein, including sharing data and revising methodologies to arrive at more representative figures. In fact, most
of the authors of this paper are former utility engineers, economists, technologists, and policy analysts, and would value the
opportunity to collaborate. We welcome a constructive dialogue, and can be reached at gridx@solarcity.com.
Acknowledgements
We would like to thank the following industry stakeholders who were willing to provide their valuable feedback on the
content of this paper. While we incorporated their input to every extent possible, we, the authors, are solely responsible for
the information presented and the conclusions drawn in the report.
Jon Wellinghoff Virginia Lacy, Jamie Mandel Michael O’Boyle
Stoel Rives LLP Rocky Mountain Institute Energy Innovation
SolarCity Grid Engineering | www.solarcity.com/gridx | Page 4
I. Introduction
Grid Investments are Increasing
Grid infrastructure planners are responsible for some of the most significant infrastructure investments in the United States.
As of 2011, U.S. utilities had almost half a trillion dollars of undepreciated transmission, distribution and generation assets on
their balance sheets, growing at a rate of 6 to 8% per year.
3
As depicted in the adjacent figure, the Edison Electric
Institute forecasts that another $879 billion dollars in
distribution and transmission investments alone will occur
in the twenty year period of 2010 through 2030 – about
$44 billion dollars per year – significantly larger than
investments seen in the previous 20 year period.
4
Grid
investments have a significant and increasing impact on the
total electricity costs faced by U.S. consumers.
In light of this huge level of grid investment occurring over
the next few decades, an imperative exists to ensure that
these investments are deployed to maximize ratepayer
benefits. There has been relatively little focus to date on
how to effectively focus and reduce these infrastructure
costs, particularly in the areas of transmission and
distribution planning, despite the fact that they often make
up half of the average residential customer’s bill. This level
of investment calls for a reexamination of the technological solutions available to meet the grid’s needs and an overhaul of
the planning process that deploys these solutions. States like California and New York have begun this process, primarily
spurred by a focus on how distribution planning and operations may evolve in a future with high penetration of distributed
resources.
5
While these nascent discussions and rulemakings are positive first steps, the planning framework for grid
modernization must change considerably to avoid costing ratepayers billions in unnecessary, underutilized investments.
Current Utility Regulatory Model Incents a Build More to Profit More Approach
The current utility regulatory model, which was designed around a monopoly utility managing all aspects of grid design and
operation, is outdated and unsuited for today’s reality of consumers installing DERs that can benefit the grid. Therefore,
industry fundamentals need to be reexamined, and the utility incentive model is a key place to start.
Electric utilities are generally regulated under a “cost plus” model, which compensates utilities with an authorized rate of
return on prudent capital investments made to provide electricity services. While this model makes sense when faced with a
regulated firm operating in a natural monopoly, it is well known to result in a number of economic inefficiencies, as perhaps
best analyzed by Jean Tirole in his Nobel Prize winning work on market power and regulation.
6
One fundamental problem resulting from the “cost plus” utility regulatory model is that utilities are generally discouraged
from utilizing infrastructure resources that are not owned by the utility, even if competitive alternatives could deliver
improved levels of service at a lower cost to ratepayers. Beyond regulatory oversight, this model contains no inherent
downward economic pressure on the size of the utility rate base, or the cumulative amount of assets upon which the utility
earns a rate of return. As such, utility rate bases have consistently and steadily grown over time. For example, the following
chart depicts the size and recent growth of the electricity rate base for California investor-owned utilities, which continues to
significantly grow even in the presence of flat electricity consumption. In short, the fundamental incentive utilities have to
build more utility-owned infrastructure in order to profit more conflicts with the public interest as the grid becomes more
customer-centric and distributed.
SolarCity Grid Engineering | www.solarcity.com/gridx | Page 5
Trends in Rate Base for California Investor-Owned Utilities
7,8
Traditional Grid Planning Focuses on Traditional Assets
Grid planning for infrastructure investments has historically focused on installing expensive, large assets that provide service
over a wide geographic region. This structure naturally evolved from the technology and market characteristics of the original
electricity industry, including a natural monopoly, centralized generation, long infrastructure lead times, high capital costs
with significant economies of scale, and a concentration of technical know-how within the utility.
Many of these barriers have been eliminated with the technological advancement in physical infrastructure options – such as
DER portfolios that can meet grid needs – and increased sophistication of grid design and operational tools. However, grid
planning remains focused on utilizing traditional infrastructure to the detriment of harnessing the increasing availability of
DERs. Utilizing DER solutions will require a shift in grid planning approaches, as well as increased access to the underlying
planning and operational data needed to enable DERs to operate most effectively in concert with the grid.
Distributed Energy Resources Offer Increased Grid Flexibility
Distributed energy resources include assets such as
rooftop PV, smart inverters, controllable loads,
permanent load shifting, combined heat and power
generators, electric vehicles, and energy efficiency
resources. These resources provide a host of
benefits to the customer, utility, and transmission
operator as identified by numerous research
organizations including EPRI and the Rocky
Mountain Institute (RMI). As depicted in the RMI
figure to the right, diverse portfolios of DERs offer a
wide range of grid services at the distribution,
transmission, and customer levels.
9
Distributed energy resources can offer deferral and
avoidance of planned grid investments, improved
grid resiliency, and increased customer choice. DERs,
if deployed effectively and placed on equal footing
in the planning process with traditional grid
investments, can ultimately lead to increased net
benefits for ratepayers.
Diverse DER portfolios can
provide up to 13 services to
3 stakeholder groups
Reprinted with permission from Rocky Mountain Institute
SolarCity Grid Engineering | www.solarcity.com/gridx | Page 6
II. Distributed Energy Resources Offer a Better Alternative
Motivated by the challenge faced in designing a grid appropriate to the 21
st
century, this report first focuses on determining
the quantifiable net economic benefits that DERs can offer to society. The approach taken builds on existing avoided cost
methodologies – which have already been applied to DERs by industry leaders – while introducing updated methods to hard-
to-quantify DER benefit categories that are excluded from traditional analyses. While the final net benefit calculation derived
in this report is specific to California, the overall methodological advancements developed here are applicable across the U.S.
Moreover, the ultimate conclusion from this analysis – that DERs offer a better alternative to many traditional infrastructure
solutions in advancing the 21
st
century grid – should also hold true across the U.S., although the exact net benefits of DERs
will vary across regions.
A. Methodology
The methodology utilized in this paper is built upon well-established frameworks for valuing policies, programs and resources
– frameworks that are grounded in the quantification of the costs and benefits of distributed energy resources. Specifically,
the methodology employed here:
1. Begins with the Electric Power Research Institute’s 2015 Integrated Grid/Cost Benefit Framework in order to
quantify total net societal costs and benefits in a framework that applies nationally.
10
2. Quantifies the benefits for the state of California, where the modeling of individual cost and benefit categories is
possible using the California Public Utilities Commission 2015 Net Energy Metering Successor Public Tool.
11
Within
the context of California, this report’s DER avoided cost methodology is expanded beyond EPRI’s base methodology
to incorporate commonly recognized (although not always quantified) categories of benefits and costs, while also
proposing methodologies for several hard-to-quantify categories using the Public Tool.
3. Incorporates the full costs of DER integration, including DER integration cost data as identified by California utilities
in their 2015 Distribution Resource Plans
12
to determine the net benefits of achieving 2020 penetration levels.
4. Repeats the methodology in a concrete case study by applying it to the planned distribution capacity projects from
the most recent Phase I General Rate Case in California.
Enhancing Traditional Cost/Benefit Analysis and Describing Benefits as Avoided Cost
Cost/benefit analyses have been conducted for many decades to evaluate everything from utility-owned generation to utility-
administered customer programs such as energy efficiency rebates and demand response program funding. This paper
replicates established methodologies wherever possible, and offers new or enhanced methodologies where appropriate to
consider new benefit categories that are novel to customer-driven adoption of DERs, and therefore often excluded from
traditional analyses.
A key component of cost/benefit analysis commonly used for valuing the benefits of DER is the avoided cost concept, which
considers the benefits of a policy pathway by quantifying the reduction in costs that would otherwise be incurred in a
business-as-usual trajectory. While avoided cost calculations can be performed with varying scopes,
13
there is some degree
of consensus on what the appropriate value categories are in a comprehensive avoided cost study. Groups like IREC,
14
RMI
15
and EPRI
16
have attempted to take these standard valuation frameworks even further, describing general methods for valuing
some of the benefit categories that are often excluded from traditional analyses.
Each step taken by researchers to enhance previously used avoided cost methodologies advances the industry beyond
outdated historical paradigms. DER-specific methodological updates include the consideration of new types of avoided costs
that could be provided by distributed resources, or a revision of the assumption that resources adopted by customers are
uncontrollable, passive deliverers of value to the grid and that proactive planning and policies cannot or will not be
implemented to maximize the value of these grid-interactive resources.
This report continues the discussion using EPRI’s 2015 Integrated Grid/Cost Benefit Framework as a springboard. EPRI’s
framework, depicted in the following image) was chosen as it is the most recently published comprehensive cost/benefit
analysis framework for DERs. This report assumes a basic familiarity with EPRI’s methodology – or avoided cost
methodologies in general – on the part of the reader, although explanations of each cost or benefit category are included in
the following section.
SolarCity Grid Engineering | www.solarcity.com/gridx | Page 7
EPRI Cost/Benefit Framework
17
The Value of DERs within California
While the overall methodology enhanced within this report is applicable nationwide, the focus of this report’s economic
valuation of DERs in the cost/benefit analysis is limited to the state of California. For California’s NEM 2.0 proceeding, the
energy consulting firm Energy+Environmental Economics (E3) created a sophisticated model that parties used to determine
the impact of various rate design proposals. A major component of this model was the ability to assess DER avoided costs
under different input assumptions. The more traditional avoided cost values in this paper are derived from the inputs used in
the NEM 2.0 proposal filing of The Alliance of Solar Choice (TASC) for the E3 model, which is available publicly online.
18
Additionally, benefit and cost categories for DERs – along with accompanying data and quantification methods – are being
developed in the CPUC Distribution Resource Plans (DRP) proceeding. This update of the DER valuation framework in the DRP
proceeding, however, is not present in the existing methodologies being used to quantify the benefits of rooftop solar in
California as part of the NEM 2.0 proceeding due to the concurrent timing of the two proceedings. This report bridges these
two connected proceedings in its economic analysis of the value of DERs within California.
While evaluating net societal benefits at the system level in California is a key step in understanding the total potential value
of DERs, there remains much discussion within the industry regarding whether calculated net benefits can actually be
realized from changes in transmission and distribution investment planning. To this end, this analysis applies the developed
California DER valuation framework to a real-world case study utilizing the latest GRC filed in California, PG&E’s 2017 General
Rate Case Phase I filing. By utilizing this third dataset, in addition to the NEM 2.0 and DRP proceedings, this analysis delivers a
comprehensive and up-to-date consideration of the potential value DERs can provide to the grid.
Analysis Scope, Assumed Scenario, and End State
This report evaluates the benefits of customer DER adoption, the associated costs, and the resulting net benefit/cost.
The benefits and costs of DER are highly dependent on penetration levels. Therefore, this analysis utilizes a set of common
assumptions for expected DER penetration, and specifies a market end state scenario upon which benefits and costs are
quantified. The end-state assumed in this report utilizes scenarios in Southern California Edison’s (SCE) July 1, 2015
Distribution Resource Plan, which includes DER adoption levels and integration cost estimates for the 2016-2020 period.
These integration costs inform DER penetration assumptions, which are applied consistently across the benefits calculations
to ensure that the costs of low penetration are not attributed to the benefits of high penetration, and vice-versa.
SolarCity Grid Engineering | www.solarcity.com/gridx | Page 8
Incremental DER Adoption Scenario for 2016-2020
To simplify the discussion, solar deployment is focused on the years 2016-2020, adopting the penetration levels and costs
associated with the TASC reference case as filed in the CPUC NEM 2.0 proposal filing, which corresponds approximately to
SCE’s Distribution Resource Plan Scenario 3. Of the approximately 900,000 new solar installations expected to be deployed
during this period, SolarCity estimates 10% would adopt residential storage devices and 20% would adopt controllable loads
(assumptions are based on customer engagement experience and customer surveys). These adoptions are central to the
ability of customer DER deployments to defer and avoid traditional infrastructure investments as assessed in this paper.
The assumptions described above are used to complete the cost/benefit analysis of DERs for the whole of California. After
evaluating net societal benefits at the system level, the methodology is then applied to a particular case study of actual
distribution projects proposed under the latest GRC filed within California, PG&E’s 2017 General Rate Case Phase I filing.
In the following sections, the deployment scenario is evaluated both qualitatively and quantitatively under a cost-benefit
framework that is grounded in established methodologies, but enhanced to consider the impact of such a large change in the
way the electric system is operated. The study consolidates a range of existing analyses, reports and methodologies on DERs
into one place, supporting a holistic assessment of the energy policy pathways in front of policy-makers today.
B. Avoided Cost Categories
The avoided cost categories evaluated in this report are summarized in the following table. The first seven categories are
included within traditional cost-benefit analyses, and as such are not substantially extended in this report (see Appendix for
methodological overviews and TASC NEM Successor Tariff filing for comprehensive descriptions and rationale on
assumptions
19
). The next five categories (in yellow highlight) represent new methodology enhancements to hard-to-quantify
avoided cost categories (i.e. benefit categories) that are that are often excluded from traditional analyses. In this section, we
detail the methodology and rationale for quantifying these five avoided cost categories.
SolarCity Grid Engineering | www.solarcity.com/gridx | Page 9
Voltage, Reactive Power, and Power Quality Support
Solar PV and battery energy storage with ‘smart’ or advanced inverters are capable of providing reactive power and voltage
support, both at the bulk power and local distribution levels. At the bulk power level, smart inverters can provide reactive
power support for steady-state and transient events, services traditionally supplied by large capacitor banks, dynamic
reactive power support, and synchronous condensers. For example, in Southern California the abrupt retirement of the San
Onofre Nuclear Generation Station (SONGS) in 2013 created a local shortage of reactive power support, endangering stable
grid operations for SCE in the Los Angeles Basin area. To meet this reactive power need, SCE sought approval to deploy
traditional reactive power equipment at a cost of $200-$350 million, as outlined in the table below. DERs were not included
in the procurement to meet this need. Had DERs with smart inverters been evaluated as part of the solution, significant
reactive power capacity could have been obtained to avoid the deployment of expensive traditional equipment.
SONGS Reactive Power Replacement Projects
Sources
20,21,22,23,24,25,26,27
At the distribution level, smart inverters can provide voltage regulation and improve customer power quality, functions that
are traditionally handled by distribution equipment such as capacitors, voltage regulators, and load tap changers. While the
provision of reactive power may come at the expense of real power output (e.g. such as power otherwise produced by a PV
system), inverter headroom either exists or can readily be incorporated into new installations to provide this service without
impacting real power output. The capability of DER smart inverters to provide voltage and power quality support is currently
being demonstrated in several field demonstration projects across the country. For instance, a demonstration project in
partnership with an investor-owned utility is currently demonstrating the voltage support from a portfolio of roughly 150
smart inverters controlling 700kW worth of residential PV systems. The chart below depicts the dynamic reactive power
delivered to support local voltage. In this instance, smart inverter support resulted in a 30% flatter voltage profile.
28
Reactive power and voltage support from a smart inverter
SolarCity Grid Engineering | www.solarcity.com/gridx | Page 10
Projects such as the SONGS reactive power procurement project provide recent examples where utility investment was made
for reactive power capacity. These projects were used to quantify the economic benefit of DERs providing reactive power
support. To do so, a corresponding $/kVAR-year value was applied to the inverter capacity assumed in the deployment
scenarios to determine the value of the services offered by the DER portfolio. Note, also, that markets including NYISO, PJM,
ISO-NE, MISO, and CAISO already compensate generators for capability to provide and provision of reactive power.
29
Conservation Voltage Reduction
Smart inverters can enable greater savings from utility conservation voltage reduction (CVR) programs. CVR is a demand
reduction and energy efficiency technique that reduces customer service voltages in order to achieve a corresponding
reduction in energy consumption. CVR programs are often implemented system-wide or on large portions of a utility’s
distribution grid in order to conserve energy, save customers on their energy bills, and reduce greenhouse gas emissions.
CVR programs typically save up to 4% of energy consumption on any distribution circuit.
30
The utilization of smart inverters is
estimated to yield another 1-3% of incremental energy consumption savings and greenhouse gas emissions reductions.
From an engineering perspective, CVR schemes aim to reduce customer voltages to the lowest allowable limit as allowed by
American National Standards Institute (ANSI) standards. However, CVR programs typically only control utility-owned
distribution voltage regulating equipment, changes to which affect all customers downstream of any specific device. As such,
CVR benefits in practice are limited by the lowest customer voltage in any utility voltage regulation zone (often a portion of a
distribution circuit), since dropping the voltage any further would violate ANSI standards for that customer.
Since smart inverters can increase or decrease the voltage at any individual location, DERs with smart inverters can be used
to more granularly control customer voltages in CVR schemes. For example, if the lowest customer voltage in a utility voltage
regulation zone where to be increased by, say, 1 Volt by controlling a local smart inverter, the entire voltage regulation zone
could then be subsequently lowered another Volt, delivering substantially increased CVR benefits. Such an example is
depicted in the image below, where the green line represents a circuit voltage profile where smart inverters support CVR.
Granular control of customer voltages through smart inverters can dramatically increase CVR benefits.
DERs control voltage locally and enable CVR
Equipment Life Extension
Either through local generation, load shifting, and/or energy efficiency, DERs reduce the net load at individual customer
premises. A portfolio of optimized DERs dispersed across a distribution circuit in turn reduces the net load for all equipment
along that distribution circuit. Distribution equipment, such as substation transformers, operating at reduced loading will
benefit from increased equipment life and higher operational efficiency.
SolarCity Grid Engineering | www.solarcity.com/gridx | Page 11
Distribution equipment may operate at very high loading during periods of peak demand, abnormal configuration, or
emergency operation. When the nominal rating of equipment is exceeded, or overloaded, the equipment suffers from
degradation and reduction in operational life. The more frequently that equipment is overloaded, the more that such
degradation occurs. Furthermore, the efficiency of transformers and other grid equipment falls as they perform under
increased load. The higher the overload, the larger the efficiency losses. Utilities have significant portions of their grid
equipment that regularly operate in overloaded fashion. DERs’ ability to reduce peak and average load on distribution
equipment therefore leads to a reduction in the detrimental operation of the equipment and an increase in useful life, as
shown in the following figure. The larger the peak load reduction, the larger the life extension and efficiency benefits.
Distributed Energy Resources Extend Transformer Life
To quantify these benefits, medium to large liquid-filled transformers were modeled with typical load and DER generation
profiles. The magnitude of the reduced losses and resulting equipment degradation avoidance were calculated using IEEE
C57.12.00-2000 standard per unit life calculation methodology.
31,32
DERs such as energy storage are able to achieve an even
greater avoided cost than solar alone, as storage dispatch can more closely match the distribution peak. Quantified benefits
contributing to net societal benefits calculation include the deferred equipment investment due to extended equipment life
and reduced energy losses through increased efficiency.
Note that non-optimized DERs can be cited as having negative impact on equipment life. While highly variable generation
and load can negatively impact equipment life – such as driving increased operations of line regulators – optimized and
coordinated smart inverters mitigate this potential volatility impact on equipment life.
Resiliency and Reliability
DERs such as energy storage can provide backup power to
critical loads, improving customer reliability during routine
outages and resiliency during major outages. The rapidly
growing penetration of batteries combined with PV
deployments will reduce the frequency and duration of
customer outages and provide sustained power for critical
devices, as depicted in the adjacent figure.
Improved reliability and resiliency has been the goal of
significant utility investments, including feeder
reconductoring and distribution automation programs such
as fault location, isolation, and service restoration (FLISR).
Battery deployments throughout the distribution system can
eventually reduce utility reliability and resiliency
investments. However, this analysis utilizes a conservative
approach, only considering average customer savings from
reduced outages and excludes avoided utility investments.
Distributed Energy Resources Improve
Customer Resiliency and Reliability
SolarCity Grid Engineering | www.solarcity.com/gridx | Page 12
To quantify near-term reliability and resiliency benefits, the value of lost load as calculated by Lawrence Berkeley National
Lab
33
was applied to the energy that could be supplied during outages. Outages were based on 2014 CPUC SAIFI statistics.
Market Price Suppression Effect
Wholesale electricity markets provide a competitive framework for electric supply to meet demand. In general, as electric
demand increases market prices increase. DERs can provide value by reducing the electric demand in the market, leading to a
reduction in the market clearing price for all consumers of electricity. This effect was recently validated in the U.S. Supreme
Court’s decision to uphold FERC Order 745, noting that operators accept demand response bids if and only if they bring down
the wholesale rate down by displacing higher-priced generation. Notably, the court emphasized that “when this occurs (most
often in peak periods), the easing of pressure on the grid, and the avoidance of service problems, further contributes to
lower charges.”
34
As a behind-the-meter resource, rooftop solar impacts wholesale markets in a similar way to demand
response, effectively reducing demand and thus clearing prices for all resources during solar production hours. While the
CPUC Public Tool attempts to consider the avoided cost of wholesale energy prices, it does not consider the benefits of
reducing wholesale market clearing prices from what they would have been in the absence of solar.
This effect is illustrated in the adjacent
figure. In the presence of DERs, energy
prices are at the lower “P∗
” price which
otherwise would have been at the higher
“P” price absent the DERs. Market price
suppression could then be quantified as
the difference between prices multiplied
by load, or (P − P∗
) ∗ L∗
.
To quantify the magnitude of cost
reductions due to market price
suppression, this report estimates the
relationship between load and market
prices based on historical data. It is
important to isolate other driving factors
to only capture the effect of load change
on prices. One of these driving factors is
natural gas prices, which directly impacts
electric prices because the marginal supply resource in California is often a natural gas-fired power plant. This can be isolated
by normalizing market prices over gas prices, known as Implied Heat Rate (IHR), and estimating the relationship between IHR
and load, which is shown in figure below for PG&E DLAP prices and load.
Relationship between electric demand and Implied Heat Rate for PG&E
Relationship between Electric Demand
and Wholesale Market Prices
SolarCity Grid Engineering | www.solarcity.com/gridx | Page 13
Smart energy homes equipped with energy storage are able to achieve an even greater avoided cost than distributed solar
alone. Storage devices that discharge in peak demand hours with high market clearing prices can take advantage of the
stronger relationship between load and price at high loads.
Results
After establishing the 2016-2020 penetration scenario and defining the methodologies for each category of avoided cost, the
CPUC Public Tool was utilized to estimate the benefits of achieving the 2020 penetration scenario. For avoided cost
categories the CPUC Public Tool was not able to incorporate, calculations were completed externally using common
penetration and operational assumptions for each technology type. In order to be consistent with the CPUC Public Tool
outputs, levelized values are expressed in annual terms in 2015 dollars below.
Annual Benefits of 2016-2020 DER Deployments
Previous assessments of high penetration DERs have replicated existing methodologies that have often been applied to
passive assets like energy efficiency; however, these approaches fail to recognize the potential value of advanced DERs that
will be deployed during the 2016-2020 timeframe. When a more comprehensive suite of benefits that could be generated by
DERs today is considered, total benefits of the 2016-2020 DER portfolio in California exceeds $2.5 billion per year.
C. The Costs of Distributed Energy Resources
As presented above, distributed resources offer significant ratepayer benefits; however, these benefits are not available
without incurring incremental costs to enable their deployment. In order to quantify the net societal benefit of DERs, these
costs must be subtracted from the benefits. Costs for distributed energy resources include integration at the distribution and
bulk system levels, utility program management, and customer equipment.
Distribution Integration Costs
DERs are a critical new asset class being deployed on the distribution grid which must be proactively planned for and
integrated with existing assets. This integration process will sometimes require unavoidable additional investments.
However, it is essential to separate incremental DER integration costs from business as usual utility investments. Recent
utility funding requests for DER integration have included costs above those needed to successfully integrate DERs. This
subsection will explore typical DER integration costs and evaluate the validity of each type.
While new DER integration rules of thumb and planning guidelines are emerging,
35
no established approach exists for
identifying DER integration investments or estimating their cost. It is clear, however, that integration efforts and costs vary by
DER penetration level. Generally, lower DER penetration requires fewer integration investments, while higher penetration
SolarCity Grid Engineering | www.solarcity.com/gridx | Page 14
may lead to increased investment. As depicted in the following chart, NEM PV penetration levels vary across the U.S.
36
Most
states have very low (<5%) penetrations, while only Hawaii experiences medium (10-20%) penetration. California exhibits low
(5-10%) penetration overall, although individual circuits may experience much higher penetration.
NEM Solar Capacity as a Percentage of Total System Peak
For this analysis, DER integration costs were developed from estimates submitted by California utilities to the CPUC as part of
their Distribution Resource Planning (DRP) filings. This analysis incorporates the specific cost categories and figures from
Southern California Edison’s filing, since this filing alone included specific cost estimates. In assessing these costs, each
proposed investment was reviewed to determine whether it was a required incremental cost resulting from the integration
of DERs. If so, it should indeed be included in the cost/benefit calculation. If the investment (or a portion thereof) was
determined to be a component of utility busines as usual operations, such investment was not included in the analysis.
In order to determine whether a proposed utility investment is required, the following threshold question was asked:
 Would these costs be incurred even in the absence of DER adoption?
If the costs would be incurred regardless of DER adoption, or if the utility had previously requested regulatory approval for
the investment but justified the investment via a program unrelated to DER adoption, then the costs should not be classified
as DER integration costs. For example, if a utility had previously requested approval to upgrade (i.e. cutover) 4kV circuits to a
higher voltage in order to increase capacity and reliability before DERs were prevalent, yet now associates the upgrade costs
to DERs, then the investment should not be attributed to DER integration. This threshold analysis eliminates from
consideration or reduces some of the proposed utility integration costs.
Of the remaining costs, each was further assessed by asking the following set of screening questions:
 Do more cost effective mitigation measures exist for the proposed investment? Can advanced DER functionalities
(e.g. volt/VAR support) mitigate or eliminate the need for the investment?
 Are costs relevant for the forecasted DER penetration levels, or only for much higher penetrations?
 Do stated costs reflect realistic cost figures, or do they reflect inflated estimates?
Several utility integration investments are proposed to mitigate an integration challenge where more cost effective solutions
exist. For example, voltage-related concerns due to PV variability are often used to justify replacement of capacitor banks on
distribution feeders. However, the use of embedded voltage and reactive power capabilities in smart inverters make the
deployment of new capacitor banks redundant and overly expensive in most instances. Furthermore, while some proposed
costs may be relevant for high penetrations of DERs – such as bi-directional relays to deal with reverse power flows – these
investments may not be necessary at low penetration levels.
The following table presents the DER integration investment categories as identified in SCE’s DRP filing according to its
Scenario 3 forecast for DER growth in California. SCE’s integration costs were scaled up in order to estimate total distribution
SolarCity Grid Engineering | www.solarcity.com/gridx | Page 15
integration costs for all California utilities; therefore, the table represents total California distribution integration costs over
2016-2020. For each investment, applicability to DER integration is assessed using the threshold and screening questions
discussed above, resulting in a quantification of costs that are directly “Applicable to DERs”. An overview of the assessment
of each high-level integration category is provided in the table, with more detailed technical discussion of each investment
type and assessment rationale offered in the Appendix. This cost quantification is necessarily high-level due to the lack of
details available for each investment type. As such, more specific assessment is necessary in order to evaluate integration
investment plans. This exercise identifies 25% of SCE’s DER integration costs, or $1,450 million (or levelized to $189 million
annually
37
), as truly applicable to DER integration, which is the number utilized in the cost/benefit analysis in this paper.
Bulk System Integration Costs
Integration of variable resources with the bulk power grid is expected to result in an increase in variable operating costs
associated with the way the generation fleet is used to accommodate the variability. To quantify this cost, $/MWh values
quantifying this cost for a 33% renewable portfolio standard were scaled per calculations adopted by the California PUC.
38
Utility Program Management Costs
To estimate the incremental utility program costs associated with DER adoption, the default inputs within the Public Tool
were used, which include upfront installation and metering costs, as well as incremental billing costs. All told, these costs
amounted to $26 million per year based on the level of adoption in the TASC base case scenario.
Customer Equipment Costs
The costs of DERs themselves must be considered, including the cost of equipment, labor, and financing. For solar, CPUC
Energy Division staff’s reference case solar price forecast is used to determine the cost of deployed equipment in the 2016-
2020 timeframe, factoring in the December 2015 extension of the Federal Investment Tax Credit. For storage, the price
forecast was based on Navigant Research’s projections;
39
for controllable thermostats, current vendor prices were used.
Based on these forecasts, deployments forecasted for the 2016-2020 timeframe yielded a blended average adoption cost of
the installed base of $3.86/W for the 2016-2020 timeframe, or $2.70/W after reflecting the 30% Federal Investment Tax
Credit (ITC). In absolute terms, the total cost of adoption to Californians translates to $12.1 billion (nominal) for 4.5GW of
rooftop solar. For co-located storage and load control, total investment to meet adoption forecasts totals $259 million.
Results
Societal net benefits calculations require a comprehensive consideration of costs that society bears as a result of attaining
the specified 2020 penetration levels, including the costs of administering customer programs, grid integration costs needed
to accommodate new assets, and the cost of the assets themselves, which are borne by customers. In the table below, each
category is quantified, totalling $1.1 billion per year.
SolarCity Grid Engineering | www.solarcity.com/gridx | Page 16
D. Quantifying Net Benefits
In this section, we complete EPRI’s Cost/Benefit analysis by comparing benefits and costs of DERs during the 2016-2020
deployment timeframe. For consistent comparisons, levelized costs and benefits are based on the year 2020, with all benefits
and costs values translated to 2015 dollars.
40
Establishing a common DER penetration scenario and converting all benefits and costs to net present value terms allows
simple summation of each category to provide indicative societal net benefit, suggesting a significant societal value for
widespread DER adoption. In total, the benefits of the analyzed scenario are $2.5 billion per year, compared to costs of $1.1
billion per year, resulting in a net societal benefit to Californians of $1.4 billion per year by 2020.
Results of EPRI Societal Net Benefit Test
E. Case Study: PG&E’s Planned Distribution Projects in 2017 General Rate Case
In the previous section, categories of avoided costs were described and the corresponding values were quantified for the
state of California. In this section, the same methodology is applied to PG&E’s planned distribution projects from its most
recent PG&E 2017 General Rate Case filing from September 2015.
Every three years, California utilities seek approval to recover expenses and investments, including a target profit level, that
are deemed necessary for the prudent provision of utility services. For perspective, half of customer’s utility payments were
SolarCity Grid Engineering | www.solarcity.com/gridx | Page 17
driven by the “wires” component of the electric grid in 2014
41
and California’s investor owned utilities are expected to add
$143 billion of new capital investment into their distribution rate bases through 2050.
42
Despite the significant size of this avoided cost category, DERs have historically been considered passive assets having little
potential on the “wires” side of the business. While not all distribution investment can be avoided by DERs, some of the
currently-planned projects are being implemented to accommodate demand growth and replacement of aging assets; these
projects could instead be deferred or avoided by DERs. While the CPUC Public Tool uses a generalized treatment of
distribution capacity avoided costs to estimate the potential value of deferrals across utilities, more specific values are used
in this section sourced from publicly available documents.
The table below summarizes the large capacity-related distribution projects detailed in PG&E’s General Rate Case. PG&E
seeks approval of $353 million for these distribution system investments.
43
When this $353 million PG&E capital investment
is adjusted to factor in the ratepayer perspective – which includes the lifetime cost of the utility’s target profit level and
recovery of costs related to operations and maintenance, depreciation, interest and taxes from ratepayers – the net present
societal cost to PG&E ratepayers of these distribution capacity projects is approximately $586 million.
44
This $586 million cost
to ratepayers adds over 1GW of conventional distribution capacity but addresses only 256 MW of near-term capacity
deficiencies on PG&E’s distribution system when deployed.
Summary of PG&E Electric Distribution Capacity Request – 2017 GRC
45
Based on this societal cost, we consider the net benefits of an alternative, DER-centric solution, which relies on solar with
smart inverters, energy storage and controllable thermostats. Due to lack of sufficient detail from PG&E’s General Rate Case
regarding the operational profiles of the electric distribution capacity projects in question, a simplifying assumption of 75% is
used for the DER portfolio’s distribution load carrying capacity ratio, which is based on the CPUC’s Public Tool default peak
capacity allocation factors (PCAF) for PG&E’s distribution planning areas. This load carrying capacity ratio reflects capabilities
based on customer adoptions with a storage sizing ratio of 2 kWh of energy storage for every 1 kW of PV capacity, or
approximately 10 kWh of energy storage for a customer with 5kW of solar installed, as well as a controllable thermostat.
In order to accurately compare the DER solution, the full lifetime cost of the DER solution is considered, which includes the
costs of additional DERs that would be needed to accommodate load growth over the lifetime of the conventional solution –
assumed to be 25 years. This DER solution deployment schedule, which continuously addresses incremental capacity needs
on the grid, contrasts with the traditional, bulky solution deployment schedule, which requires a large upfront investment for
capacity to address a small, incremental near-term need. While a DER solution delivers sufficient capacity in each year to
provide comparable levels of grid services, deployments occur steadily over time rather than in one upfront investment.
This approach highlights one of the key potential benefits of utilizing a DER solution over a traditional, bulky grid asset: DERs
can be flexibly deployed in small bundles over time, a benefit that is further explored in Section IV on the benefits of
transitioning to more integrated distribution planning.
Using these assumptions, the previous state-wide methodology is applied to DERs avoiding PG&E’s planned distribution
capacity projects, but two conservative assumptions are made. First, the scope of benefits is limited to a subset of avoided
cost categories that would be directly considered by utility planners today for these types of projects. Whereas conventional
equipment used to meet distribution capacity projects are generally unidimensional resources providing a single source of
value – distribution capacity – DERs provide multiple sources of value. Second, we base our calculations on PG&E’s lower
avoided cost values,
46
rather than our own, to demonstrate that there are net benefits even under a conservative scenario.
In addition to avoiding the ratepayer cost of $586 million for planned distribution capacity projects, the DERs deployed to
avoid PG&E’s distribution capacity projects also avoid $946 million in energy purchases and $79 million and $99 million in
generation capacity and avoided renewable energy credit purchases, respectively, totaling $1,709 million in benefits. On the
cost side, program costs, integration costs and equipment costs for the associated DERs total to $1,605 million, resulting in a
net present value to PG&E ratepayers of $104 million. This net benefit result is particularly notable given the limited scope of
benefits considered in this case study and the reliance on PG&E’s lower avoided cost values.
SolarCity Grid Engineering | www.solarcity.com/gridx | Page 18
Net Benefit of DER Solutions to PG&E Electric Distribution Capacity Request – 2017 GRC
(Calculations Based on PG&E Cost and Benefit Assumptions)
In this section, the data available to third-parties around distribution capacity projects from the most recent California Phase
I General Rate Case (PG&E’s 2017 GRC filing) was used to explore the potential benefits of leveraging DERs to avoid
conventional distribution capacity-related investments. Calculations were performed based on PG&E’s own avoided cost
assumptions from NEM Successor Tariff filings and General Rate Case filings. Results indicate that deploying DER solutions in
lieu of PG&E’s planned distribution capacity expansion projects in its 2017 GRC could yield net benefits, even looking only at
the energy, capacity, and renewable energy compliance values of the DER solutions. While not preferred, simplified
assumptions were used to fill missing sources of information and data (e.g. distribution peak capacity allocation factors and
forecasted load growth) where necessary. That such simpliftubg assumptions are necessary highlights the need for additional
data sharing on specific infrastructure projects in order to assess the potential of DERs to offset these investments.
III. Utility Regulatory Incentives Must Change in Order to Capture DER Benefits
Section II demonstrated how California could realize an additional $1.4 billion per year by 2020 in net benefits from the
deployment of new DERs during the 2016-2020 timeframe. This state-wide methodology was then applied to the planned
distribution capacity projects for California’s most recent GRC request, showing how the deployment of DERs in lieu of
planned distribution capacity expansion projects in PG&E’s next rate case could save customers over $100 million.
Despite this potential value from embracing a distribution-centric grid, utilities face institutional barriers to realizing these
benefits. Reducing the size of a utility’s ratebase – its wires-related investments – cuts directly into shareholder profits.
Expecting utilities to proactively integrate DERs into grid planning, when doing so has the potential to adversely impact
shareholder earnings, is a structurally flawed approach. It will be impossible to completely capture the potential benefits of
DERs until the grid planner’s financial conflict with the deployment of DERs is neutralized.
Incentive Barriers
Realigning the incentives of the grid planner to solely focus on delivering a safe, reliable and affordable grid, regardless of the
ownership and service models that materialize in the market, is a necessary first step to realize the potential of DERs. There
are two fundamental paths forward to address this conflict of interest.
SolarCity Grid Engineering | www.solarcity.com/gridx | Page 19
The first path towards realizing this objective would be to separate the role of distribution planning, sourcing, and operations
from the role of distribution asset owner, similar to the evolution of Independent System Operators (ISOs) and Regional
Transmission Operators (RTO) at the bulk system level. FERC’s decree to create independent operators in Order 2000 was
driven by the observation that the lack of independent operation of the bulk power system enabled transmission owners to
continue discriminatory operation of their systems to favor their own affiliates and further their own interests.
47
However, while an independent distribution system operator (IDSO) is an appealing governance model, some state
regulators may choose a second path for addressing the utility conflict of incentives: maintaining the utilities’ traditional role
in planning and operating the distribution grid, while neutralizing the misalignment by changing utility incentives. Given the
near-term focus in many states on retaining the utility’s current role in grid planning and operation, this paper chooses to
focus on this path and proposes a model that ensures the utility incentive against non-utility owned assets is neutralized.
Proposed Solution
In order to ensure least cost/best fit distribution investments in states without an IDSO, this paper proposes the creation of a
new utility incentive model, Infrastructure-as-a-Service, which would neutralize the utility incentive to deploy utility-owned
infrastructure in lieu of more cost-effective third-party options. This model would enable utility shareholders to derive
income from third-party grid services, mitigating the financial impact that may bias utility decision-making. Such a model
would help ensure that utilities take full advantage of DER readily being adopted by customers.
Infrastructure-as-a-Service
Infrastructure-as-a-Service is a regulatory mechanism that would modify the incentives faced by utilities when sourcing
solutions to meet grid needs. This new mechanism would allow utilities to earn income, or a rate of return, from the
successful provision of grid services from non-utility owned DERs. Infrastructure-as-a-Service facilitates the least cost/best fit
development of distribution grids by creating competitive pathways for DERs to defer or replace conventional grid
investments, while maintaining equal or superior levels of safety, reliability, resiliency, power quality, and customer
satisfaction. As the figure below shows, the three primary steps of a utility distribution planning process (forecast, identify
needs and evaluate solutions) remain identical to the current process, followed by the infrastructure-as-a-Service
mechanism’s enhancements to sourcing in steps four (select and deploy) and five (operate and collect).
48
Utility Planning and Sourcing Utilizing Infrastructure-as-a-Service Model
SolarCity Grid Engineering | www.solarcity.com/gridx | Page 20
Under the proposed approach, after evaluating all feasible technical solutions for a particular grid need, including alternative
grid solutions derived from DER portfolios, Infrastructure-as-a-Service would empower distribution planners to select and
deploy third-party assets that address the specified need if more cost-effective for ratepayers than conventional solutions.
Importantly, Infrastructure-as-a-Service would create an opportunity for utilities to operate and collect streams of service
income, or a rate of return, based on the successful deployment of competitively sourced third-party solutions. This service
income provides fair compensation for effective administration of third-party contracts that enable alternative resources to
deliver grid services, and helps mitigate the structural bias towards utility-owned infrastructure that currently exists under
distribution “cost plus” regulation. Note that other mechanisms attempting to achieve a similar utility indifference to DER
solutions have been proposed, such as the modified clawback mechanism being discussed in New York.
49
While the clawback
mechanism offers the potential to reduce the financial disincentive that utilities face in utilizing DERs, the potential utility
upside may be small as compared to the lost opportunity and insufficient to neutralize the utility disincentive. This downside
to the clawback mechanism may be overcome via the infrastructure-as-a-service mechanism.
Distribution Loading Order
Neutralizing the utility disincentive to utilizing DERs is critical but not sufficient to drive transformation in distribution
planning. New incentives may be ignored in practice without corresponding changes to long-established and familiar utility
processes that have sourced only self-supplied solutions to date. The adoption of a Distribution Loading Order
50
would
borrow an existing concept from bulk system procurement policy in California, which prioritizes procurement of preferred
resources, including energy efficiency, demand response, and renewable energy, ahead of fossil fuel-based sources. In the
distribution context, a Distribution Loading Order prioritizes the utilization of flexible DER portfolios over traditional utility
infrastructure, when such portfolios are cost-effective and able to meet grid needs. The table below depicts the types of
resources that would be prioritized over traditional investments in such a policy.
Distribution Loading Order: Sourcing Solutions
In concert with a mechanism like Infrastructure-as-a-Service, a Distribution Loading Order provides the procedural framework
for evaluating distribution solutions in order to ensure grid planning is consistent with longer term policy objectives that
support environmental, reliability, and customer choice goals. Importantly, a Distribution Loading Order would ensure that
DER solutions are properly incorporated into grid planning. However, utilities would always maintain the authority to select
and deploy a suitable portfolio of solutions, including conventional solutions when more appropriate, to ensure reliability. For
these conventional investments, utilities would continue to earn an authorized rate of return.
Benefits of Infrastructure as a Service
Creating a pathway for DERs to offer grid services in lieu of utility infrastructure investment would be beneficial for utility
ratepayers for a variety of reasons.
1. Saves ratepayers money: Allowing full and fair consideration of DER solutions equips grid planners with a broader
suite of tools to meet grid needs, resulting in higher infrastructure utilization and lower customer electricity bills.
2. Promotes competition: Expanding the set of suppliers that are eligible to offer distribution solutions unleashes the
power of markets to benefit ratepayers. Well-designed competitive markets can deliver superior solutions that are
more affordable than those resulting from a self-supply “cost plus” planning model.
3. Increased flexibility and sources the best solution: Sourcing mechanisms that can deliver resources with new
desirable characteristics (e.g. granular sizing, fast lead-times, flexible operational traits) into the distribution
planners’ toolbox creates no-regrets flexibility. And by rendering a utility neutral to the choice of ownership
structure, the planner can focus on the singular objective of delivering the least-cost, best-fit solution.
4. Encourages innovation: Providing clear market opportunities for third-party solutions promotes product and service
innovation, putting the collective innovation capabilities of all market participants and customers to work.
SolarCity Grid Engineering | www.solarcity.com/gridx | Page 21
5. Engages customers: Utilizing DERs to provide grid services increases the capability and willingness of individual
customers to actively manage their energy profiles. Ultimately, a neutral decision model like Infrastructure-as-a-
Service will help foster the transition from passive ratepayers to proactive customers.
The CPUC recently enhanced the 2016 scope for its Distribution Resource Plan proceeding to formally consider the utility
role, business models, and financial interest with respect to DER deployment.
51
Infrastructure-as-a-service is one mechanism
to consider that would reduce the conflict of interest towards third-party services inherent in the utility incentive model
today. Alternative efforts, such as creating greater functional independence between ownership and operations, as in an
IDSO model, should also be explored. Irrespective of the mechanism, an effort to neutralize the utility decision model is
needed to ensure that DERs are fully utilized and valued for grid services.
IV. Grid Planning Must be Modernized in Order to Capture DER Benefits
A second structural impediment to fully realizing DER benefits is the current grid planning approach, which biases grid design
toward traditional infrastructure rather than distributed alternatives, even if distributed solutions better meet grid needs.
Outdated planning approaches rely on static assumptions about DER capabilities and focus primarily on mitigating potential
DER integration challenges, rather than proactively harnessing these flexible assets.
A. Adopt Integrated Distribution Planning
Grid planning can be modernized by utilizing an approach to meeting grid needs
while at the same time expanding customer choice to utilize DERs to manage their
own energy. We call this holistic process Integrated Distribution Planning.
Integrated Distribution Planning encourages the incorporation of DERs into every
aspect of grid planning. The framework, as depicted in the adjacent figure, expedites
DER interconnections, integrates DERs into grid planning, sources DER portfolios to
meet grid needs, and ensures data transparency for key planning and grid
information. Ultimately, the approach reduces overall system costs, increases grid
reliability and resiliency, and fosters customer engagement.
If grid planning decisions are made before consideration of customers’ decisions to adopt DERs, – which is frequently the
case today – grid investments will underutilize the potential of DERs to provide grid services, ultimately resulting in lower
overall system utilization and higher societal costs of the collective grid assets. In contrast, prudent planners who proactively
plan for customer adoption of DERs may avoid making unnecessary and redundant grid investments, while also enabling the
use of customer DERs to meet additional grid needs. Ultimately, planning processes must ensure that DERs are effectively
counted on by grid planners and leveraged by grid operators. For more details on integrated distribution planning, see the
“Integrated Distribution Planning” white paper overviewing the framework at www.solarcity.com/gridx.
B. Grid Planning Data Must be Transparent and Accessible
The first step in grid planning is to identify the underlying grid needs. As discussed throughout this paper, the use of
alternative solutions such as DERs should be included in the portfolio of solutions that are considered to meet these grid
needs. While utilities could ostensibly assess these alternative solutions within their existing process, opening up the planning
process by sharing the underlying grid data would drive increased competition and innovation in both assessing and meeting
grid needs. Any concerns from sharing such data – such as customer privacy, security, data quality, and qualified access – can
be mitigated through data sharing practices already common in other industries. In fact, stakeholder engagement and access
to planning data is already a central tenet in electric transmission planning across the country. The challenges of ushering a
new industry norm of data transparency are far outweighed by the potential that broader data access can drive in increased
stakeholder engagement and industry competition.
SolarCity Grid Engineering | www.solarcity.com/gridx | Page 22
Data transparency efforts should first focus on communicating the exhaustive list of grid needs that utilities already identify
in their planning process. While utilities may claim that such needs are already communicated within general rate cases, the
information contained in those filings are incomplete. A standard set of comprehensive data should be shared about each
grid need and planned investment so that stakeholders can proactively propose and develop innovative solutions to those
needs. This proactive data access broadens the set of innovative solutions made available to utilities and guards against an
insular approach to deploying grid investments. The table below is an initial set of minimally-required data to foster adequate
stakeholder engagement in regards to specific, utility-identified grid needs.
Data to Foster Engagement in Grid Needs and Planned Investments
While data on specific utility-identified grid needs is critical to assessing innovative solutions in place of traditional
investments, underlying grid data should also be made available to foster broader engagement in grid design and operations.
Access to underlying grid data allows third parties to improve grid design and operation by proactively identifying and
developing solutions to meet grid needs, even before they are identified by utilities. The following data should be made
available and kept current by utilities in order to encourage broad engagement in grid design.
Data to Foster Engagement in General Grid Design and Optimization
SolarCity Grid Engineering | www.solarcity.com/gridx | Page 23
Share Standardized, Machine-Readable Data Sets
Data that is made available on grid needs and planned investments is rarely provided in an accessible format. Often,
information is provided in the form of photocopied images of spreadsheet tables within utility GRC filings, hardly a format the
enables streamlined analysis. This data communication approach requires stakeholders to manually recreate entire data sets
into electronic version in order to carry out any meaningful analysis, a time-intensive and needless exercise. Other potential
stakeholders never attempt to engage due to the barrier of data access.
The use of standard, machine-readable data formats is prevalent in many industries and within the utility industry itself;
organizations like the Energy Information Agency (EIA) foster such broad access to electronic, standardized data sets.
Distribution grid needs and planned investments should follow suit. To illustrate a potential path forward, below is an
example of traditional grid capacity needs and corresponding capacity investments as communicated via PG&E’s 2017 GRC
Phase 1 filing; the image of the text file on the right shows how those same grid needs and planned investments could be
translated into a machine-readable format.
General Rate Case Standard Format
Worksheet PDF Text File (e.g. JSON)
C. Benefits of Integrated Distribution Planning
Opening the door to DER solutions in grid planning provides the obvious benefit of a new suite of technological options for
grid planners. In some cases, DERs may simply be lower cost on a $/kW basis or more effective at meeting the identified grid
need than the conventional solution, making them an obvious choice. DERs, however, also offer an advantage over
convertional options due to their targeted and flexible nature, which fundamentally changes the paradigm of grid planning.
Status quo grid planning relies on deploying bulky, traditional infrastructure solutions to address forecasts of incremental,
near-term grid needs. In many cases, conventional solutions are 15X larger than the near-term grid need that is driving the
actual deployment of the infrastructure.
52
This fundamental reality of grid planning creates two major opportunities for DERs
to deliver better value to ratepayers than conventional solutions: 1) utilizing small and targeted solutions, and 2) utilizing the
flexibility of DER portfolios.
Value of Small & Targeted Solutions in Modern Distribution Planning
The first source of value is the result of more incremental and targeted investment, which captures the benefit of time value
of money. Bulky utility solutions with long equipment lifetimes present a lumpiness challenge for planners. Needs for new
resources are driven at the margin, but the available solutions are only cost-effecive when sized to match their long lifetimes,
often resulting in low lifetime utilization rates. The significantly smaller building blocks that modern DERs offer planners
effectively overcome this historical problem. The figures below compare the deployment timeline of a traditional bulky
solution installed to meet demand growth long in the future, relative to a targeted DER solution deployed in small batches to
meet continuous demand growth, and the corresponding expectation of idle capacity over time.
53
SolarCity Grid Engineering | www.solarcity.com/gridx | Page 24
Option 1 meets every year’s capacity requirement by deploying large solutions infrequently, whereas Option 2 meets annual
needs through smaller and more continuous deployments. While the infrastructure deployed with Option 1 will continue to
meet the required planning reserve margins decades into the future, it requires a significant upfront investment. Option 2
targets the near-term required planning reserve margins on a continuous basis. Both options ensure that the planning
reserve margin for reliability purposes is met, but Option 1 results in higher idle capacity rates over the lifetime of the
infrastructure in aggregate when compared to Option 2.
Extending the basic financial idea of the time value of money, paying for capacity today is more expensive than paying for
capacity tomorrow – even before considering any cost decreases resulting from technological advancements. DER solutions
that can preserve reliability, while delaying capital investments for new capacity until future periods, are inherently valuable
to ratepayers. This value driver means that solutions that may look more expensive on a per unit of nameplate capacity basis
are actually more cost effective on a net present value basis.
Value of Increased Flexibility in Modern Distribution Planning
The second source of value to be realized from modernizing planning stems from a related but separate challenge that grid
planners face: the risk of suboptimal decisions arising from forecast error. This risk is primarily driven by two dynamics:
1. Long lead times are necessary to deploy traditional infrastructure.
2. Long depreciation lifetimes are allowed by regulators for those assets.
As a result, grid planners commonly make investment decisions many years into the uncertain future, and then charge
customers for the maintenance, depreciation, profit and taxes associated with those assets over 20 to 30 years or more.
Investment under uncertainty imposes risks, which, if not managed properly, create unforeseen ratepayer costs. Among
other sources of uncertainty, grid planning and expansion using traditional bulky infrastructure is subject to demand growth
uncertainty and technology uncertainty. Both of these forecast errors can be large and expensive.
Over-forecasting demand can result in an overbuilt system for which ratepayers must bear the full burden, even if the
infrastructure was not needed. Under-forecasting demand can require the installation of suboptimal, expensive patchwork
solutions, or threaten reliability if solutions cannot be provided in time. Similarly, on the technology side, inaccurately
forecasting the future costs and capabilities of technologies may result in premature obsolescence as technological
advancement dramatically reduces equipment costs or increases equipment efficiency. While private firms typically bear
these investment risks in other industries, utility ratepayers bear 100% of these forecast error risks in the electric industry
unless the utility regulator acts to disallow cost recovery.
Due to these risks, DERs with shorter lead times can offer real-option value (ROV) by delaying deployment until forecast
uncertainty is smaller, effectively buying time for planners and reducing the probability of a mistake. While the value of real
options can be significant, it is difficult to quantify without the requisite data, including historical loading data, historical
forecasts, and current long-term project forecasts. These data needs are further elaborated on in the subsequent section.
SolarCity Grid Engineering | www.solarcity.com/gridx | Page 25
Policy Considerations
The additional sources of value, including time value of money and real option value, associated with a transition towards
integrated distribution planning that fully leverages DER deployments were explored above, but are not explicitly quantified
due to the limited data publically available. Ongoing proceedings in California, such as the Distribution Resource Plan (DRPs)
and Integrated Distributed Energy Resources (IDER), create important vehicles to share information between parties in order
to explore these important but less conventional sources of value that are not yet well quantified.
V. Conclusion
In this report, we explored the capability of distributed energy resources to maximize ratepayer benefits while modernizing
the grid. The opportunity associated with proactively leveraging DERs deployed over the next five years is significant, creating
$1.4 billion a year by 2020 in net societal benefits across the state of California. Applying the state-wide methodology to a
subset of real distribution capacity projects identified in California’s most recent utility General Rate Case yielded similar
results, suggesting DERs can cost effectively replace real-world planned distribution capacity projects today.
The impediments to capturing these benefits in practice remain significant. Utility incentives must be realigned to ensure
that the full potential of DERs can be realized. Shifting the utility’s core financial incentive from its current focus of “build
more to profit more” towards a future state where the utility is financially indifferent between sourcing utility-owned and
customer-driven solutions would neutralize bias in the utility decision making process. However, modernizing grid planning is
also necessary. Grid planning must be updated to incorporate DERs into every aspect of grid planning, and the process itself
must become radically more transparent with greater access to and standardization of data.
The benefits of achieving these changes would be real – and large. While initially complex to consider, the greater flexibility
DERs can provide to grid planners and operators leads to greater reliability and resiliency. Similarly, the more targeted and
incremental deployments of DERs can enable more efficient and affordable grids. Most importantly, utilities that can
successfully modify planning processes would be able to fully take advantage of the assets their customers chose to adopt.
While no single report will adequately address all the issues – engineering, economic, regulatory – that naturally come with a
transformative time in the industry, we hope that compiling these issues in one place, even with a high-level focus, advances
the discussion and provides an overview of the critical topics for regulators and industry stakeholders to consider when
evaluating the full potential of distributed energy resources.
About Grid Engineering Solutions
Our Grid Engineering Solutions team is leading efforts to make the 21
st
century’s distributed grid a reality. At SolarCity, grid
engineering is more than understanding how the current power system works and how to interconnect distributed energy
resources. It encompasses a cross-functional approach to evaluating engineering, technology, economic, and policy
considerations side-by-side. We apply our expertise in power systems engineering, energy economics, and advanced grid
technology to unlock innovative solutions that enable the grid of the future.
The majority of the Grid Engineering Solutions team members, including the authors of this paper, are former utility
engineers, economists, technologists, and policy analysts. We treat the design and operation of the electric grid as a major
opportunity to partner across the energy industry, with the aim of driving innovation to benefit consumers and our
environment. Collaboration across utilities, grid operators, regulators, national laboratories, philanthropists,
environmentalists, distributed energy resource providers, energy service providers, and customers is paramount to meeting
the challenge of modernizing our grid. We welcome any dialogue that helps foster the next generation of grid design and
operations. For more information, please visit us at www.solarcity.com/gridx or contact us at gridx@solarcity.com.
SolarCity Grid Engineering | www.solarcity.com/gridx | Page 26
Appendix 1: Overview of Traditional Avoided Cost Categories and Methodologies
The traditional avoided cost categories evaluated in this report are detailed in the following table. Descriptions of the avoided
cost, overview of the CPUC Public Tool’s treatment of these avoided costs, and TASC’s adjusted methodologies are provided.
The adjusted TASC methodologies are used to quantify the traditional avoided cost values used in this paper. See TASC NEM
Successor Tariff filing for more details on quantification approach.
54
SolarCity Grid Engineering | www.solarcity.com/gridx | Page 27
Appendix 2: Utility-Proposed Distribution Integration Investments in CA DRP
The following table presents the DER integration investment categories as identified in SCE’s DRP filing. SCE’s costs were
scaled up to estimate total integration costs for all California utilities over 2016-2020. SCE cost estimates were stated at the
category level, and were uniformly spread across the underlying investments. For each investment, applicability to DER
integration is assessed using the threshold and screening questions identified in this paper. This quantification is necessarily
high-level due to the lack of details provided, and additional details are necessary in order to fully evaluate investment plans.
SolarCity Grid Engineering | www.solarcity.com/gridx | Page 28
Endnotes
1
“Transforming America’s Power Industry: The Investment Challenge 2010 – 2030”, Chupka, Earle, Fox-Penner, and Hledik, The Brattle
Group (Brattle) for The Edison Foundation (EEI), November 2008
http://www.eei.org/ourissues/finance/Documents/Transforming_Americas_Power_Industry_Exec_Summary.pdf
2
“The Integrated Grid: A Benefit-Cost Framework”, K. Forsten et al., Electric Power Research Institute (EPRI), February 2015
http://www.epri.com/abstracts/Pages/ProductAbstract.aspx?ProductId=000000003002004878
3
Compiled from SNL Energy Data based on US Electric Utility FERC Form 1 filings from 2007-2011
http://www.snl.com/Sectors/Energy/
4
“Transforming America’s Power Industry: The Investment Challenge 2010 – 2030”, Chupka et al., Brattle for EEI, 2008
5
CA Distribution Resource Plan (DRP) proceeding (http://www.cpuc.ca.gov/General.aspx?id=5071), CA CPUC Integrated Distributed Energy
Resources (IDER) proceeding (http://docs.cpuc.ca.gov/PublishedDocs/Efile/G000/M153/K740/153740896.PDF), and NY Reforming the
Energy Vision (REV) proceeding (www3.dps.ny.gov/W/PSCWeb.nsf/All/CC4F2EFA3A23551585257DEA007DCFE2?OpenDocument)
6
“A Theory of Incentives in Procurement and Regulation”, Jean-Jacques Laffont and Jean Tirole, MIT Press, 1993
7
“Electric and Gas Utility Cost Report: Public Utilities Code Section 747 Report to the Governor and Legislature”, California Public Utilities
Commission, April 2015
http://www.cpuc.ca.gov/WorkArea/DownloadAsset.aspx?id=5650
8
Energy Almanac, California Energy Commission, 2005-2014
http://energyalmanac.ca.gov/electricity/electricity_generation.html
9
“The Economics of Battery Storage”, Rocky Mountain Institute (RMI), October 2015
10
“The Integrated Grid: A Benefit-Cost Framework”, K. Forsten et al., EPRI, February 2015
11
California Public Utility Commission (CPUC) Public Tool/2015 NEM Successor Public Tool, developed by Energy+Environmental Economics
(E3) for the CPUC, 2015 (https://www.ethree.com/public_projects/cpucPublicTool.php)
Note: SolarCity views the CPUC Public Tool as a useful resource to perform cost/benefit analyses, such as the analysis presented in this
paper, in a transparent and publically repeatable manner. However, SolarCity cautions that there are structural flaws and limitations to the
Public Tool that result in overstatement of PV and DER adoption and understatement of avoided cost benefits. Therefore, SolarCity does not
support the use of the Public Tool in its current form to be the basis of ratemaking or tariff decisions.
12
CPUC Distribution Resources Plan proceeding
13
“A Review of Solar PV Benefit and Cost Studies”, L. Hansen and V. Lacy, RMI, 2013
http://www.rmi.org/Knowledge-Center%2FLibrary%2F2013-13_eLabDERCostValue
14
“A Regulator’s Guidebook: Calculating the Benefits and Costs of Distributed Solar Generation”, RMI for Interstate Renewable Energy
Council (IREC), October 2013
www.irecusa.org/a-regulators-guidebook-calculating-the-benefits-and-costs-of-distributed-solar-generation/
15
“A Review of Solar PV Benefit and Cost Studies”, L. Hansen and V. Lacy, RMI, 2013
16
“The Integrated Grid: A Benefit-Cost Framework”, K. Forsten et al., EPRI, February 2015
17
Ibid
18
“Proposal for AB 327 Successor Tariff of the Alliance for Solar Choice”, The Alliance for Solar Choice (TASC), August 2015
http://docs.cpuc.ca.gov/PublishedDocs/Efile/G000/M154/K226/154226059.PDF
19
“Proposal for AB 327 Successor Tariff of the Alliance for Solar Choice”, TASC, August 2015
20
“Petition to amend final decision to convert generating units to synchronous condensers”, Lee, Edison Mission Huntington Beach, 2012
http://www.energy.ca.gov/sitingcases/huntingtonbeach/compliance/2012-10-
04_Petition_to_Amend_Final_Decision_to_Convert_Generating_Units_to_Synchronous_Condensers_TN-67538.pdf
21
“Quarterly Compliance Report (January 2014) of Southern California Edison Company regarding status of transmission projects and
generation interconnection projects”, G. Chen, Southern California Edison (SCE), January 2014
www3.sce.com/sscc/law/dis/dbattach5e.nsf/0/A62A276183AFF26E88257C5A0082E9B9/$FILE/I.00-11-001%20AB970%20-
%20SCE%20Quarterly%20Compliance%20Report%20-%20%20January%202014.pdf
22
“Quarterly Compliance Report (April 2013) of Southern California Edison Company (U 338-E) regarding status of transmission projects”,
G. Chen, SCE, April 2013
http://www3.sce.com/sscc/law/dis/dbattach5e.nsf/0/1685093939AACD2588257B42006463C7/$FILE/SCE+Quarterly+Compliance+Report+
(April+2013)+Memo.pdf
23
“2012 – 2013 Transmission Plan”, California Independent System Operator (CAISO), March 2013
www.caiso.com/documents/boardapproved2012-2013transmissionplan.pdf
24
“Decision on the 2012/2013 ISO Transmission Plan”, N. Millar, CAISO, March 2013
www.caiso.com/Documents/DecisionISO_2012-2013_TransmissionPlan-Presentation-Mar2013.pdf
25
“2012 Grid Assessment Results”, San Diego Gas & Electric Company (SDG&E), September 2012
www.caiso.com/Documents/SDGE_2012-2013ProposedSolutions.pdf
26
“Sycamore-Penasquitos 230 kV Line Description and Functional Specifications Eligible for Competitive Solicitation”, CAISO, April 2013
www.caiso.com/documents/description-functionalspecificationssycamore-penasquitos230kvline.pdf
27
“Responses to CPUC/BLM Data Request No. SCE-1”, SCE, January 2007
www.cpuc.ca.gov/environment/info/aspen/sunrise/datareqs/sce_dr1_response.pdf
SolarCity Grid Engineering | www.solarcity.com/gridx | Page 29
28
SolarCity technical analysis from joint demonstration project with investor-owned utility, December 2015
29
“Payment for Reactive Power”, Commission Staff Report AD14-7, Federal Energy Regulatory Commission, April 2014
30
“Evaluation of Conservation Voltage Reduction on a National Level”, Schneider, Fuller, Tuffner, and Singh, Pacific Northwest National
Laboratory (PNNL) for the US Department of Energy (DOE), July 2010
http://www.pnl.gov/main/publications/external/technical_reports/PNNL-19596.pdf
31
Winder, “Transformers: Principles and Applications”, Marcel Dekker, Inc., Basel, Switzerland, 2002, pp. 118-121.
32
IEEE Std. C57.12.00-2000. “IEEE Standard Requirements for Liquid-Immersed Distribution, Power, and Regulating Transformers”,
Institute of Electrical and Electronics Engineers, Inc., New York, 2000, pp. 44-48.
33
“Updated Value of Service Reliability Estimates for Electric Utility Customers in the United States”, Sullivan, Schellenberg, and Blundell,
Lawrence Berkeley National Laboratory (LBNL), 2015
https://emp.lbl.gov/sites/all/files/value-of-service-reliability-final.pdf.pdf
34
Opinion of the U.S. Supreme Court, FERC v. Electric Power Supply Association et al., January 2016, p. 16
35
“High-Penetration PV Integration Handbook for Distribution Engineers”, NREL, January 2016
http://www.nrel.gov/docs/fy16osti/63114.pdf
36
U.S. Energy Information Agency (EIA), July 2015 preliminary data
37
Levelized costs are based on societal discount rate (CPUC Public Tool default of 5%) and estimates of deprecation life for each DER
integration investment type.
38
“Report of Southern California Edison Company (U 338-E) On Renewable Integration Cost Study For 33% Renewables Portfolio Standard”,
W. Walsh and C. Schmid-Frazee, SCE, May 2015
http://www3.sce.com/sscc/law/dis/dbattach5e.nsf/0/9ED56ECBA141C78188257E54007CE0F5/$FILE/R.13-12-010_2014%20LTPP-
SCE%20Report%20on%20Renewable%20Integration%20Cost%20Study%20for%2033%20Perc%20RPS.pdf
39
“The Economics of Grid Defection”, Figure 19, Battery Price Projections, Creyts and Guccione et al., RMI, February 2014
http://www.rmi.org/cms/Download.aspx?id=10994&file=RMIGridDefectionFull_2014-05.pdf
40
This approach allows capital investments, variable costs, and benefits to be considered through a single metric, avoiding the analytical
error of comparing the costs and benefits with different useful lives in without any normalization.
41
“Electric and Gas Utility Cost Report: Public Utilities Code Section 747 Report to the Governor and Legislature”, CPUC, April 2015
42
CPUC Public Tool/2015 NEM Successor Public Tool, Revenue Requirement Module, Reference Case Forecast 2013-2050, developed by E3
for the CPUC, 2015
43
Pacific Gas and Electric only provides project-level information for distribution capacity projects exceeding $3 million. Investment in
smaller distribution capacity projects is incorporated into the broader distribution budget, but is not broken out in any detail.
44
This calculation reflects a 25-year useful life of assets and ratebase depreciation schedule with an authorized WACC of 7.8% and
corporate tax rate of 42%. Property taxes are omitted. Project expenses are based on the O&M share of PG&E’s 2014 distribution revenue
requirement (41%), but revised down to a 30% ratio acknowledging that a portion of O&M is fixed O&M as opposed to variable O&M.
CPUC Public Tool’s default value for the societal discount rate of 5% is used to calculate societal net present cost.
45
PG&E’s 2017 General Rate Case; Chapter 13, Electric Distribution Capacity; Forecast Capital Expenditures – Projects Detail, Workpaper
Table 13-11
46
PG&E NEM Successor Tariff Filing. The compiled input scenarios are available on the CPUC’s website at the following at
http://cpuc.ca.gov/General.aspx?id=5818
47
“…we do conclude that opportunities for undue discrimination continue to exist that may not be remedied adequately by functional
unbundling.” FERC Order 2000, page 65
https://www.ferc.gov/legal/maj-ord-reg/land-docs/RM99-2A.pdf
48
See additional details on Integrated Distribution Planning at www.solarcity.com/gridx
49
“Staff White Paper on Ratemaking and Utility Business Models”, State of New York Department of Public Services, July 2015, pp. 40-44
50
See additional details on Integrated Distribution Planning at www.solarcity.com/gridx
51
CPUC Scoping Memo on Distribution Resource Plans, Track III, January 2016
http://docs.cpuc.ca.gov/PublishedDocs/Efile/G000/M157/K902/157902794.PDF
52
According to PG&E’s 2017 GRC Workpaper 13-11, 1,400 MWs of capacity expansions could be linked to 114MW of deficiency.
53
For a more complete discussion on these concepts, please see RMI’s book, “Small is Profitable: The Hidden Economic Benefits of Making
Electrical Resources the Right Size”, A. Lovins, RMI, 2002
54
“Proposal for AB 327 Successor Tariff of the Alliance for Solar Choice”, TASC, August 2015

Más contenido relacionado

La actualidad más candente

Steve Avary - Electricity Utility 2 point 0 Paper
Steve Avary - Electricity Utility 2 point 0 PaperSteve Avary - Electricity Utility 2 point 0 Paper
Steve Avary - Electricity Utility 2 point 0 PaperSteven Avary
 
A national perspective on using rates to control power system costs (recommen...
A national perspective on using rates to control power system costs (recommen...A national perspective on using rates to control power system costs (recommen...
A national perspective on using rates to control power system costs (recommen...bobprocter
 
Shared perspectives final 20160608
Shared perspectives final 20160608Shared perspectives final 20160608
Shared perspectives final 20160608Ward Lenz
 
RPS and RECs – Managing an Increasing Regulatory Burden
RPS and RECs – Managing an Increasing Regulatory BurdenRPS and RECs – Managing an Increasing Regulatory Burden
RPS and RECs – Managing an Increasing Regulatory BurdenCTRM Center
 
20161006 Szaro Power Matters Conference all slides
20161006 Szaro Power Matters Conference all slides20161006 Szaro Power Matters Conference all slides
20161006 Szaro Power Matters Conference all slidesJennifer Szaro
 
PLMA IDSM and Smart Grid - Martinez 2015 rev 3
PLMA IDSM and Smart Grid - Martinez 2015 rev 3PLMA IDSM and Smart Grid - Martinez 2015 rev 3
PLMA IDSM and Smart Grid - Martinez 2015 rev 3Mark S. Martinez
 
Opportunity Maine Policy Webinar
Opportunity Maine Policy Webinar Opportunity Maine Policy Webinar
Opportunity Maine Policy Webinar opportunitymaine
 
Accenture digitally-enabled-grid-pov-utility-distribution
Accenture digitally-enabled-grid-pov-utility-distributionAccenture digitally-enabled-grid-pov-utility-distribution
Accenture digitally-enabled-grid-pov-utility-distributionStu Laurie
 
Rauluk Testimony Final no pics
Rauluk Testimony Final no picsRauluk Testimony Final no pics
Rauluk Testimony Final no picsValerie Rauluk
 
Emerging Solar Strategies: How Innovative Companies are Using Solar to Reduce...
Emerging Solar Strategies: How Innovative Companies are Using Solar to Reduce...Emerging Solar Strategies: How Innovative Companies are Using Solar to Reduce...
Emerging Solar Strategies: How Innovative Companies are Using Solar to Reduce...Sustainable Brands
 
EWEB Electricity - Applied Reinventing Fire Sustainable Development Theories_...
EWEB Electricity - Applied Reinventing Fire Sustainable Development Theories_...EWEB Electricity - Applied Reinventing Fire Sustainable Development Theories_...
EWEB Electricity - Applied Reinventing Fire Sustainable Development Theories_...Benjamin Farrell
 
2009 doe smart grid system report
2009 doe smart grid system report2009 doe smart grid system report
2009 doe smart grid system reportGrant Millin
 
Home Area Networks: A Preferred Choice for Energy Efficiency
Home Area Networks: A Preferred Choice for Energy EfficiencyHome Area Networks: A Preferred Choice for Energy Efficiency
Home Area Networks: A Preferred Choice for Energy EfficiencyCognizant
 
LBNL Distribution Systems in High DER Future
LBNL Distribution Systems in High DER FutureLBNL Distribution Systems in High DER Future
LBNL Distribution Systems in High DER FuturePaul De Martini
 
Day-3, Mr. SC Shrivastav connectivity MTOA & lTA and concept of GNA
Day-3, Mr. SC Shrivastav connectivity MTOA & lTA and concept of GNADay-3, Mr. SC Shrivastav connectivity MTOA & lTA and concept of GNA
Day-3, Mr. SC Shrivastav connectivity MTOA & lTA and concept of GNAIPPAI
 
Utilities, regulators & distributed solar generation rethinking utility busi...
Utilities, regulators & distributed solar generation  rethinking utility busi...Utilities, regulators & distributed solar generation  rethinking utility busi...
Utilities, regulators & distributed solar generation rethinking utility busi...Annie Lappé
 
Solar-Ops-Report-2014-ver5-1
Solar-Ops-Report-2014-ver5-1Solar-Ops-Report-2014-ver5-1
Solar-Ops-Report-2014-ver5-1Jim Kennerly
 
2017 Strategic Directions: Electric Industry Survey
2017 Strategic Directions: Electric Industry Survey 2017 Strategic Directions: Electric Industry Survey
2017 Strategic Directions: Electric Industry Survey Black & Veatch
 
The case for net metering in Country 'X'
The case for net metering in Country 'X'The case for net metering in Country 'X'
The case for net metering in Country 'X'Joseph Saviour
 

La actualidad más candente (20)

Steve Avary - Electricity Utility 2 point 0 Paper
Steve Avary - Electricity Utility 2 point 0 PaperSteve Avary - Electricity Utility 2 point 0 Paper
Steve Avary - Electricity Utility 2 point 0 Paper
 
A national perspective on using rates to control power system costs (recommen...
A national perspective on using rates to control power system costs (recommen...A national perspective on using rates to control power system costs (recommen...
A national perspective on using rates to control power system costs (recommen...
 
Shared perspectives final 20160608
Shared perspectives final 20160608Shared perspectives final 20160608
Shared perspectives final 20160608
 
RPS and RECs – Managing an Increasing Regulatory Burden
RPS and RECs – Managing an Increasing Regulatory BurdenRPS and RECs – Managing an Increasing Regulatory Burden
RPS and RECs – Managing an Increasing Regulatory Burden
 
20161006 Szaro Power Matters Conference all slides
20161006 Szaro Power Matters Conference all slides20161006 Szaro Power Matters Conference all slides
20161006 Szaro Power Matters Conference all slides
 
PLMA IDSM and Smart Grid - Martinez 2015 rev 3
PLMA IDSM and Smart Grid - Martinez 2015 rev 3PLMA IDSM and Smart Grid - Martinez 2015 rev 3
PLMA IDSM and Smart Grid - Martinez 2015 rev 3
 
Opportunity Maine Policy Webinar
Opportunity Maine Policy Webinar Opportunity Maine Policy Webinar
Opportunity Maine Policy Webinar
 
Accenture digitally-enabled-grid-pov-utility-distribution
Accenture digitally-enabled-grid-pov-utility-distributionAccenture digitally-enabled-grid-pov-utility-distribution
Accenture digitally-enabled-grid-pov-utility-distribution
 
Rauluk Testimony Final no pics
Rauluk Testimony Final no picsRauluk Testimony Final no pics
Rauluk Testimony Final no pics
 
Emerging Solar Strategies: How Innovative Companies are Using Solar to Reduce...
Emerging Solar Strategies: How Innovative Companies are Using Solar to Reduce...Emerging Solar Strategies: How Innovative Companies are Using Solar to Reduce...
Emerging Solar Strategies: How Innovative Companies are Using Solar to Reduce...
 
EWEB Electricity - Applied Reinventing Fire Sustainable Development Theories_...
EWEB Electricity - Applied Reinventing Fire Sustainable Development Theories_...EWEB Electricity - Applied Reinventing Fire Sustainable Development Theories_...
EWEB Electricity - Applied Reinventing Fire Sustainable Development Theories_...
 
2009 doe smart grid system report
2009 doe smart grid system report2009 doe smart grid system report
2009 doe smart grid system report
 
Home Area Networks: A Preferred Choice for Energy Efficiency
Home Area Networks: A Preferred Choice for Energy EfficiencyHome Area Networks: A Preferred Choice for Energy Efficiency
Home Area Networks: A Preferred Choice for Energy Efficiency
 
LBNL Distribution Systems in High DER Future
LBNL Distribution Systems in High DER FutureLBNL Distribution Systems in High DER Future
LBNL Distribution Systems in High DER Future
 
E4 l localenergy_3
E4 l localenergy_3E4 l localenergy_3
E4 l localenergy_3
 
Day-3, Mr. SC Shrivastav connectivity MTOA & lTA and concept of GNA
Day-3, Mr. SC Shrivastav connectivity MTOA & lTA and concept of GNADay-3, Mr. SC Shrivastav connectivity MTOA & lTA and concept of GNA
Day-3, Mr. SC Shrivastav connectivity MTOA & lTA and concept of GNA
 
Utilities, regulators & distributed solar generation rethinking utility busi...
Utilities, regulators & distributed solar generation  rethinking utility busi...Utilities, regulators & distributed solar generation  rethinking utility busi...
Utilities, regulators & distributed solar generation rethinking utility busi...
 
Solar-Ops-Report-2014-ver5-1
Solar-Ops-Report-2014-ver5-1Solar-Ops-Report-2014-ver5-1
Solar-Ops-Report-2014-ver5-1
 
2017 Strategic Directions: Electric Industry Survey
2017 Strategic Directions: Electric Industry Survey 2017 Strategic Directions: Electric Industry Survey
2017 Strategic Directions: Electric Industry Survey
 
The case for net metering in Country 'X'
The case for net metering in Country 'X'The case for net metering in Country 'X'
The case for net metering in Country 'X'
 

Destacado

Plugless quickguide altparking
Plugless quickguide altparkingPlugless quickguide altparking
Plugless quickguide altparkingFrédéric Lambert
 
Ford full patent electric unicycle
Ford full patent electric unicycleFord full patent electric unicycle
Ford full patent electric unicycleFrédéric Lambert
 
Nv energy lawsuit_30012233_ver1.0
Nv energy lawsuit_30012233_ver1.0Nv energy lawsuit_30012233_ver1.0
Nv energy lawsuit_30012233_ver1.0Frédéric Lambert
 
Tesla gigafactory q4_2015_report
Tesla gigafactory q4_2015_reportTesla gigafactory q4_2015_report
Tesla gigafactory q4_2015_reportFrédéric Lambert
 
2016 model x_emergency_response_guide
2016 model x_emergency_response_guide2016 model x_emergency_response_guide
2016 model x_emergency_response_guideFrédéric Lambert
 
This is what we die for: Human rights abuses in the Democratic Republic of th...
This is what we die for: Human rights abuses in the Democratic Republic of th...This is what we die for: Human rights abuses in the Democratic Republic of th...
This is what we die for: Human rights abuses in the Democratic Republic of th...Frédéric Lambert
 
Powerwall installation and user's manual online-b
Powerwall installation and user's manual online-bPowerwall installation and user's manual online-b
Powerwall installation and user's manual online-bFrédéric Lambert
 
Cleaner cars from cradle to grave full report
Cleaner cars from cradle to grave full reportCleaner cars from cradle to grave full report
Cleaner cars from cradle to grave full reportFrédéric Lambert
 
Google SDC disengagements Report annual-15
Google SDC disengagements Report annual-15Google SDC disengagements Report annual-15
Google SDC disengagements Report annual-15Frédéric Lambert
 
VGEF 2015: The Future of Transportation (JB Straubel, CTO, Tesla Motors Inc)
VGEF 2015: The Future of Transportation (JB Straubel, CTO, Tesla Motors Inc)VGEF 2015: The Future of Transportation (JB Straubel, CTO, Tesla Motors Inc)
VGEF 2015: The Future of Transportation (JB Straubel, CTO, Tesla Motors Inc)vvfvilar
 
Global Economic - Tesla motors
Global Economic - Tesla motors Global Economic - Tesla motors
Global Economic - Tesla motors Tim Strik
 
Tesla strategic management final
Tesla strategic management finalTesla strategic management final
Tesla strategic management finalNadine Khattab
 
Darden School of Business Tesla Strategic Analysis
Darden School of Business   Tesla Strategic AnalysisDarden School of Business   Tesla Strategic Analysis
Darden School of Business Tesla Strategic AnalysisJosé Ángel Álvarez Fuente
 

Destacado (20)

Plugless quickguide altparking
Plugless quickguide altparkingPlugless quickguide altparking
Plugless quickguide altparking
 
Ford full patent electric unicycle
Ford full patent electric unicycleFord full patent electric unicycle
Ford full patent electric unicycle
 
e mehari-en_diffusion
e mehari-en_diffusione mehari-en_diffusion
e mehari-en_diffusion
 
Nv energy lawsuit_30012233_ver1.0
Nv energy lawsuit_30012233_ver1.0Nv energy lawsuit_30012233_ver1.0
Nv energy lawsuit_30012233_ver1.0
 
Tesla gigafactory q4_2015_report
Tesla gigafactory q4_2015_reportTesla gigafactory q4_2015_report
Tesla gigafactory q4_2015_report
 
Model 3 reservation_agreement
Model 3 reservation_agreementModel 3 reservation_agreement
Model 3 reservation_agreement
 
2016 model x_emergency_response_guide
2016 model x_emergency_response_guide2016 model x_emergency_response_guide
2016 model x_emergency_response_guide
 
This is what we die for: Human rights abuses in the Democratic Republic of th...
This is what we die for: Human rights abuses in the Democratic Republic of th...This is what we die for: Human rights abuses in the Democratic Republic of th...
This is what we die for: Human rights abuses in the Democratic Republic of th...
 
Powerwall installation and user's manual online-b
Powerwall installation and user's manual online-bPowerwall installation and user's manual online-b
Powerwall installation and user's manual online-b
 
2015 1118 hyperloop_tube_spec
2015 1118 hyperloop_tube_spec2015 1118 hyperloop_tube_spec
2015 1118 hyperloop_tube_spec
 
Tesla sf tm
Tesla sf tmTesla sf tm
Tesla sf tm
 
Cleaner cars from cradle to grave full report
Cleaner cars from cradle to grave full reportCleaner cars from cradle to grave full report
Cleaner cars from cradle to grave full report
 
NHTSA Mercedes B Class Recall
NHTSA Mercedes B Class RecallNHTSA Mercedes B Class Recall
NHTSA Mercedes B Class Recall
 
Google SDC disengagements Report annual-15
Google SDC disengagements Report annual-15Google SDC disengagements Report annual-15
Google SDC disengagements Report annual-15
 
VGEF 2015: The Future of Transportation (JB Straubel, CTO, Tesla Motors Inc)
VGEF 2015: The Future of Transportation (JB Straubel, CTO, Tesla Motors Inc)VGEF 2015: The Future of Transportation (JB Straubel, CTO, Tesla Motors Inc)
VGEF 2015: The Future of Transportation (JB Straubel, CTO, Tesla Motors Inc)
 
Global Economic - Tesla motors
Global Economic - Tesla motors Global Economic - Tesla motors
Global Economic - Tesla motors
 
Tesla Motors Presentation
Tesla Motors PresentationTesla Motors Presentation
Tesla Motors Presentation
 
Tesla strategic management final
Tesla strategic management finalTesla strategic management final
Tesla strategic management final
 
Darden School of Business Tesla Strategic Analysis
Darden School of Business   Tesla Strategic AnalysisDarden School of Business   Tesla Strategic Analysis
Darden School of Business Tesla Strategic Analysis
 
Tesla ppt
Tesla pptTesla ppt
Tesla ppt
 

Similar a Distributed Energy Resources Offer a Better Alternative for Grid Modernization

Net Energy Metering, Zero Net Energy and The Distributed Energy Resource Futu...
Net Energy Metering, Zero Net Energy and The Distributed Energy Resource Futu...Net Energy Metering, Zero Net Energy and The Distributed Energy Resource Futu...
Net Energy Metering, Zero Net Energy and The Distributed Energy Resource Futu...Private Consultants
 
ScottMadden's 51st State Roadmap
ScottMadden's 51st State RoadmapScottMadden's 51st State Roadmap
ScottMadden's 51st State RoadmapScottMadden, Inc.
 
Economics of Electricity Transmission Line Rehabilitation Investments
Economics of Electricity Transmission Line Rehabilitation Investments Economics of Electricity Transmission Line Rehabilitation Investments
Economics of Electricity Transmission Line Rehabilitation Investments Sener Salci
 
Transactive Energy article 2013
Transactive Energy article 2013Transactive Energy article 2013
Transactive Energy article 2013Paul De Martini
 
Capgemini_Smart Meter POV_2009
Capgemini_Smart Meter POV_2009Capgemini_Smart Meter POV_2009
Capgemini_Smart Meter POV_2009Jeffrey Norman
 
Capgemini ses - smart grid operational services - todays smart metering bro...
Capgemini   ses - smart grid operational services - todays smart metering bro...Capgemini   ses - smart grid operational services - todays smart metering bro...
Capgemini ses - smart grid operational services - todays smart metering bro...Gord Reynolds
 
Recommendation re proactive approach
Recommendation re proactive approachRecommendation re proactive approach
Recommendation re proactive approachHonolulu Civil Beat
 
NARUC Joins the Debate on DERs
NARUC Joins the Debate on DERsNARUC Joins the Debate on DERs
NARUC Joins the Debate on DERsScottMadden, Inc.
 
Capgemini ses - smart metering pov 2007 (gr)
Capgemini   ses - smart metering pov 2007 (gr)Capgemini   ses - smart metering pov 2007 (gr)
Capgemini ses - smart metering pov 2007 (gr)Gord Reynolds
 
De Martini - UCLA SMERC conf. Mar 22, 2013
De Martini - UCLA SMERC conf.  Mar 22, 2013De Martini - UCLA SMERC conf.  Mar 22, 2013
De Martini - UCLA SMERC conf. Mar 22, 2013Paul De Martini
 
21st C.Electric Distribution System Operations, 2014
21st C.Electric Distribution System Operations, 201421st C.Electric Distribution System Operations, 2014
21st C.Electric Distribution System Operations, 2014Paul De Martini
 
Overview of Utility Challenges and Responses to Distributed Solar Energy
Overview of Utility Challenges and Responses to Distributed Solar EnergyOverview of Utility Challenges and Responses to Distributed Solar Energy
Overview of Utility Challenges and Responses to Distributed Solar EnergyScottMadden, Inc.
 
Various demand side management techniques and its role in smart grid–the stat...
Various demand side management techniques and its role in smart grid–the stat...Various demand side management techniques and its role in smart grid–the stat...
Various demand side management techniques and its role in smart grid–the stat...IJECEIAES
 
Case Study: Blockchain as the Foundation of Alectra's Grid Exchange Transacti...
Case Study: Blockchain as the Foundation of Alectra's Grid Exchange Transacti...Case Study: Blockchain as the Foundation of Alectra's Grid Exchange Transacti...
Case Study: Blockchain as the Foundation of Alectra's Grid Exchange Transacti...Jill Kirkpatrick
 
Shared Economy & Open Data in #EnergyEfficiency Markets
Shared Economy & Open Data in #EnergyEfficiency MarketsShared Economy & Open Data in #EnergyEfficiency Markets
Shared Economy & Open Data in #EnergyEfficiency MarketsUmesh Bhutoria
 
Formulation of Net Metering Policy for Odisha to boost rooftop Solar Projects
Formulation of Net Metering Policy for Odisha to boost rooftop Solar ProjectsFormulation of Net Metering Policy for Odisha to boost rooftop Solar Projects
Formulation of Net Metering Policy for Odisha to boost rooftop Solar ProjectsBikash Kumar Mallick
 
GIS Based Power Distribution System: A Case study for the Junagadh City
GIS Based Power Distribution System: A Case study for the Junagadh CityGIS Based Power Distribution System: A Case study for the Junagadh City
GIS Based Power Distribution System: A Case study for the Junagadh Cityijsrd.com
 

Similar a Distributed Energy Resources Offer a Better Alternative for Grid Modernization (20)

Net Energy Metering, Zero Net Energy and The Distributed Energy Resource Futu...
Net Energy Metering, Zero Net Energy and The Distributed Energy Resource Futu...Net Energy Metering, Zero Net Energy and The Distributed Energy Resource Futu...
Net Energy Metering, Zero Net Energy and The Distributed Energy Resource Futu...
 
The 51st State Initiative
The 51st State InitiativeThe 51st State Initiative
The 51st State Initiative
 
ScottMadden's 51st State Roadmap
ScottMadden's 51st State RoadmapScottMadden's 51st State Roadmap
ScottMadden's 51st State Roadmap
 
Economics of Electricity Transmission Line Rehabilitation Investments
Economics of Electricity Transmission Line Rehabilitation Investments Economics of Electricity Transmission Line Rehabilitation Investments
Economics of Electricity Transmission Line Rehabilitation Investments
 
Transactive Energy article 2013
Transactive Energy article 2013Transactive Energy article 2013
Transactive Energy article 2013
 
Capgemini_Smart Meter POV_2009
Capgemini_Smart Meter POV_2009Capgemini_Smart Meter POV_2009
Capgemini_Smart Meter POV_2009
 
Capgemini ses - smart grid operational services - todays smart metering bro...
Capgemini   ses - smart grid operational services - todays smart metering bro...Capgemini   ses - smart grid operational services - todays smart metering bro...
Capgemini ses - smart grid operational services - todays smart metering bro...
 
Recommendation re proactive approach
Recommendation re proactive approachRecommendation re proactive approach
Recommendation re proactive approach
 
NARUC Joins the Debate on DERs
NARUC Joins the Debate on DERsNARUC Joins the Debate on DERs
NARUC Joins the Debate on DERs
 
Capgemini ses - smart metering pov 2007 (gr)
Capgemini   ses - smart metering pov 2007 (gr)Capgemini   ses - smart metering pov 2007 (gr)
Capgemini ses - smart metering pov 2007 (gr)
 
De Martini - UCLA SMERC conf. Mar 22, 2013
De Martini - UCLA SMERC conf.  Mar 22, 2013De Martini - UCLA SMERC conf.  Mar 22, 2013
De Martini - UCLA SMERC conf. Mar 22, 2013
 
21st C.Electric Distribution System Operations, 2014
21st C.Electric Distribution System Operations, 201421st C.Electric Distribution System Operations, 2014
21st C.Electric Distribution System Operations, 2014
 
Overview of Utility Challenges and Responses to Distributed Solar Energy
Overview of Utility Challenges and Responses to Distributed Solar EnergyOverview of Utility Challenges and Responses to Distributed Solar Energy
Overview of Utility Challenges and Responses to Distributed Solar Energy
 
The Integrated Grid epri
The Integrated Grid epriThe Integrated Grid epri
The Integrated Grid epri
 
Various demand side management techniques and its role in smart grid–the stat...
Various demand side management techniques and its role in smart grid–the stat...Various demand side management techniques and its role in smart grid–the stat...
Various demand side management techniques and its role in smart grid–the stat...
 
Case Study: Blockchain as the Foundation of Alectra's Grid Exchange Transacti...
Case Study: Blockchain as the Foundation of Alectra's Grid Exchange Transacti...Case Study: Blockchain as the Foundation of Alectra's Grid Exchange Transacti...
Case Study: Blockchain as the Foundation of Alectra's Grid Exchange Transacti...
 
InteGrid replication road map brochure
InteGrid replication road map brochureInteGrid replication road map brochure
InteGrid replication road map brochure
 
Shared Economy & Open Data in #EnergyEfficiency Markets
Shared Economy & Open Data in #EnergyEfficiency MarketsShared Economy & Open Data in #EnergyEfficiency Markets
Shared Economy & Open Data in #EnergyEfficiency Markets
 
Formulation of Net Metering Policy for Odisha to boost rooftop Solar Projects
Formulation of Net Metering Policy for Odisha to boost rooftop Solar ProjectsFormulation of Net Metering Policy for Odisha to boost rooftop Solar Projects
Formulation of Net Metering Policy for Odisha to boost rooftop Solar Projects
 
GIS Based Power Distribution System: A Case study for the Junagadh City
GIS Based Power Distribution System: A Case study for the Junagadh CityGIS Based Power Distribution System: A Case study for the Junagadh City
GIS Based Power Distribution System: A Case study for the Junagadh City
 

Último

LIGHT-PHENOMENA-BY-CABUALDIONALDOPANOGANCADIENTE-CONDEZA (1).pptx
LIGHT-PHENOMENA-BY-CABUALDIONALDOPANOGANCADIENTE-CONDEZA (1).pptxLIGHT-PHENOMENA-BY-CABUALDIONALDOPANOGANCADIENTE-CONDEZA (1).pptx
LIGHT-PHENOMENA-BY-CABUALDIONALDOPANOGANCADIENTE-CONDEZA (1).pptxmalonesandreagweneth
 
Pests of Blackgram, greengram, cowpea_Dr.UPR.pdf
Pests of Blackgram, greengram, cowpea_Dr.UPR.pdfPests of Blackgram, greengram, cowpea_Dr.UPR.pdf
Pests of Blackgram, greengram, cowpea_Dr.UPR.pdfPirithiRaju
 
Microphone- characteristics,carbon microphone, dynamic microphone.pptx
Microphone- characteristics,carbon microphone, dynamic microphone.pptxMicrophone- characteristics,carbon microphone, dynamic microphone.pptx
Microphone- characteristics,carbon microphone, dynamic microphone.pptxpriyankatabhane
 
Speech, hearing, noise, intelligibility.pptx
Speech, hearing, noise, intelligibility.pptxSpeech, hearing, noise, intelligibility.pptx
Speech, hearing, noise, intelligibility.pptxpriyankatabhane
 
THE ROLE OF PHARMACOGNOSY IN TRADITIONAL AND MODERN SYSTEM OF MEDICINE.pptx
THE ROLE OF PHARMACOGNOSY IN TRADITIONAL AND MODERN SYSTEM OF MEDICINE.pptxTHE ROLE OF PHARMACOGNOSY IN TRADITIONAL AND MODERN SYSTEM OF MEDICINE.pptx
THE ROLE OF PHARMACOGNOSY IN TRADITIONAL AND MODERN SYSTEM OF MEDICINE.pptxNandakishor Bhaurao Deshmukh
 
Call Girls in Majnu Ka Tilla Delhi 🔝9711014705🔝 Genuine
Call Girls in Majnu Ka Tilla Delhi 🔝9711014705🔝 GenuineCall Girls in Majnu Ka Tilla Delhi 🔝9711014705🔝 Genuine
Call Girls in Majnu Ka Tilla Delhi 🔝9711014705🔝 Genuinethapagita
 
REVISTA DE BIOLOGIA E CIÊNCIAS DA TERRA ISSN 1519-5228 - Artigo_Bioterra_V24_...
REVISTA DE BIOLOGIA E CIÊNCIAS DA TERRA ISSN 1519-5228 - Artigo_Bioterra_V24_...REVISTA DE BIOLOGIA E CIÊNCIAS DA TERRA ISSN 1519-5228 - Artigo_Bioterra_V24_...
REVISTA DE BIOLOGIA E CIÊNCIAS DA TERRA ISSN 1519-5228 - Artigo_Bioterra_V24_...Universidade Federal de Sergipe - UFS
 
The dark energy paradox leads to a new structure of spacetime.pptx
The dark energy paradox leads to a new structure of spacetime.pptxThe dark energy paradox leads to a new structure of spacetime.pptx
The dark energy paradox leads to a new structure of spacetime.pptxEran Akiva Sinbar
 
ALL ABOUT MIXTURES IN GRADE 7 CLASS PPTX
ALL ABOUT MIXTURES IN GRADE 7 CLASS PPTXALL ABOUT MIXTURES IN GRADE 7 CLASS PPTX
ALL ABOUT MIXTURES IN GRADE 7 CLASS PPTXDole Philippines School
 
OECD bibliometric indicators: Selected highlights, April 2024
OECD bibliometric indicators: Selected highlights, April 2024OECD bibliometric indicators: Selected highlights, April 2024
OECD bibliometric indicators: Selected highlights, April 2024innovationoecd
 
《Queensland毕业文凭-昆士兰大学毕业证成绩单》
《Queensland毕业文凭-昆士兰大学毕业证成绩单》《Queensland毕业文凭-昆士兰大学毕业证成绩单》
《Queensland毕业文凭-昆士兰大学毕业证成绩单》rnrncn29
 
basic entomology with insect anatomy and taxonomy
basic entomology with insect anatomy and taxonomybasic entomology with insect anatomy and taxonomy
basic entomology with insect anatomy and taxonomyDrAnita Sharma
 
ECG Graph Monitoring with AD8232 ECG Sensor & Arduino.pptx
ECG Graph Monitoring with AD8232 ECG Sensor & Arduino.pptxECG Graph Monitoring with AD8232 ECG Sensor & Arduino.pptx
ECG Graph Monitoring with AD8232 ECG Sensor & Arduino.pptxmaryFF1
 
User Guide: Magellan MX™ Weather Station
User Guide: Magellan MX™ Weather StationUser Guide: Magellan MX™ Weather Station
User Guide: Magellan MX™ Weather StationColumbia Weather Systems
 
Environmental Biotechnology Topic:- Microbial Biosensor
Environmental Biotechnology Topic:- Microbial BiosensorEnvironmental Biotechnology Topic:- Microbial Biosensor
Environmental Biotechnology Topic:- Microbial Biosensorsonawaneprad
 
Vision and reflection on Mining Software Repositories research in 2024
Vision and reflection on Mining Software Repositories research in 2024Vision and reflection on Mining Software Repositories research in 2024
Vision and reflection on Mining Software Repositories research in 2024AyushiRastogi48
 
trihybrid cross , test cross chi squares
trihybrid cross , test cross chi squarestrihybrid cross , test cross chi squares
trihybrid cross , test cross chi squaresusmanzain586
 
Topic 9- General Principles of International Law.pptx
Topic 9- General Principles of International Law.pptxTopic 9- General Principles of International Law.pptx
Topic 9- General Principles of International Law.pptxJorenAcuavera1
 

Último (20)

LIGHT-PHENOMENA-BY-CABUALDIONALDOPANOGANCADIENTE-CONDEZA (1).pptx
LIGHT-PHENOMENA-BY-CABUALDIONALDOPANOGANCADIENTE-CONDEZA (1).pptxLIGHT-PHENOMENA-BY-CABUALDIONALDOPANOGANCADIENTE-CONDEZA (1).pptx
LIGHT-PHENOMENA-BY-CABUALDIONALDOPANOGANCADIENTE-CONDEZA (1).pptx
 
Pests of Blackgram, greengram, cowpea_Dr.UPR.pdf
Pests of Blackgram, greengram, cowpea_Dr.UPR.pdfPests of Blackgram, greengram, cowpea_Dr.UPR.pdf
Pests of Blackgram, greengram, cowpea_Dr.UPR.pdf
 
Microphone- characteristics,carbon microphone, dynamic microphone.pptx
Microphone- characteristics,carbon microphone, dynamic microphone.pptxMicrophone- characteristics,carbon microphone, dynamic microphone.pptx
Microphone- characteristics,carbon microphone, dynamic microphone.pptx
 
Volatile Oils Pharmacognosy And Phytochemistry -I
Volatile Oils Pharmacognosy And Phytochemistry -IVolatile Oils Pharmacognosy And Phytochemistry -I
Volatile Oils Pharmacognosy And Phytochemistry -I
 
Speech, hearing, noise, intelligibility.pptx
Speech, hearing, noise, intelligibility.pptxSpeech, hearing, noise, intelligibility.pptx
Speech, hearing, noise, intelligibility.pptx
 
THE ROLE OF PHARMACOGNOSY IN TRADITIONAL AND MODERN SYSTEM OF MEDICINE.pptx
THE ROLE OF PHARMACOGNOSY IN TRADITIONAL AND MODERN SYSTEM OF MEDICINE.pptxTHE ROLE OF PHARMACOGNOSY IN TRADITIONAL AND MODERN SYSTEM OF MEDICINE.pptx
THE ROLE OF PHARMACOGNOSY IN TRADITIONAL AND MODERN SYSTEM OF MEDICINE.pptx
 
Call Girls in Majnu Ka Tilla Delhi 🔝9711014705🔝 Genuine
Call Girls in Majnu Ka Tilla Delhi 🔝9711014705🔝 GenuineCall Girls in Majnu Ka Tilla Delhi 🔝9711014705🔝 Genuine
Call Girls in Majnu Ka Tilla Delhi 🔝9711014705🔝 Genuine
 
REVISTA DE BIOLOGIA E CIÊNCIAS DA TERRA ISSN 1519-5228 - Artigo_Bioterra_V24_...
REVISTA DE BIOLOGIA E CIÊNCIAS DA TERRA ISSN 1519-5228 - Artigo_Bioterra_V24_...REVISTA DE BIOLOGIA E CIÊNCIAS DA TERRA ISSN 1519-5228 - Artigo_Bioterra_V24_...
REVISTA DE BIOLOGIA E CIÊNCIAS DA TERRA ISSN 1519-5228 - Artigo_Bioterra_V24_...
 
The dark energy paradox leads to a new structure of spacetime.pptx
The dark energy paradox leads to a new structure of spacetime.pptxThe dark energy paradox leads to a new structure of spacetime.pptx
The dark energy paradox leads to a new structure of spacetime.pptx
 
ALL ABOUT MIXTURES IN GRADE 7 CLASS PPTX
ALL ABOUT MIXTURES IN GRADE 7 CLASS PPTXALL ABOUT MIXTURES IN GRADE 7 CLASS PPTX
ALL ABOUT MIXTURES IN GRADE 7 CLASS PPTX
 
OECD bibliometric indicators: Selected highlights, April 2024
OECD bibliometric indicators: Selected highlights, April 2024OECD bibliometric indicators: Selected highlights, April 2024
OECD bibliometric indicators: Selected highlights, April 2024
 
《Queensland毕业文凭-昆士兰大学毕业证成绩单》
《Queensland毕业文凭-昆士兰大学毕业证成绩单》《Queensland毕业文凭-昆士兰大学毕业证成绩单》
《Queensland毕业文凭-昆士兰大学毕业证成绩单》
 
basic entomology with insect anatomy and taxonomy
basic entomology with insect anatomy and taxonomybasic entomology with insect anatomy and taxonomy
basic entomology with insect anatomy and taxonomy
 
Let’s Say Someone Did Drop the Bomb. Then What?
Let’s Say Someone Did Drop the Bomb. Then What?Let’s Say Someone Did Drop the Bomb. Then What?
Let’s Say Someone Did Drop the Bomb. Then What?
 
ECG Graph Monitoring with AD8232 ECG Sensor & Arduino.pptx
ECG Graph Monitoring with AD8232 ECG Sensor & Arduino.pptxECG Graph Monitoring with AD8232 ECG Sensor & Arduino.pptx
ECG Graph Monitoring with AD8232 ECG Sensor & Arduino.pptx
 
User Guide: Magellan MX™ Weather Station
User Guide: Magellan MX™ Weather StationUser Guide: Magellan MX™ Weather Station
User Guide: Magellan MX™ Weather Station
 
Environmental Biotechnology Topic:- Microbial Biosensor
Environmental Biotechnology Topic:- Microbial BiosensorEnvironmental Biotechnology Topic:- Microbial Biosensor
Environmental Biotechnology Topic:- Microbial Biosensor
 
Vision and reflection on Mining Software Repositories research in 2024
Vision and reflection on Mining Software Repositories research in 2024Vision and reflection on Mining Software Repositories research in 2024
Vision and reflection on Mining Software Repositories research in 2024
 
trihybrid cross , test cross chi squares
trihybrid cross , test cross chi squarestrihybrid cross , test cross chi squares
trihybrid cross , test cross chi squares
 
Topic 9- General Principles of International Law.pptx
Topic 9- General Principles of International Law.pptxTopic 9- General Principles of International Law.pptx
Topic 9- General Principles of International Law.pptx
 

Distributed Energy Resources Offer a Better Alternative for Grid Modernization

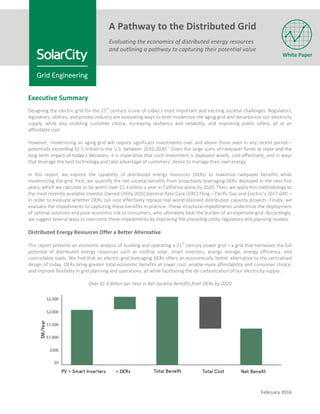
  • 1. February 2016 Executive Summary Designing the electric grid for the 21 st century is one of today’s most important and exciting societal challenges. Regulators, legislators, utilities, and private industry are evaluating ways to both modernize the aging grid and decarbonize our electricity supply, while also enabling customer choice, increasing resiliency and reliability, and improving public safety, all at an affordable cost. However, modernizing an aging grid will require significant investments over and above those seen in any recent period – potentially exceeding $1.5 trillion in the U.S. between 2010-2030. 1 Given the large sums of ratepayer funds at stake and the long-term impact of today’s decisions, it is imperative that such investment is deployed wisely, cost-effectively, and in ways that leverage the best technology and take advantage of customers’ desire to manage their own energy. In this report, we explore the capability of distributed energy resources (DERs) to maximize ratepayer benefits while modernizing the grid. First, we quantify the net societal benefits from proactively leveraging DERs deployed in the next five years, which we calculate to be worth over $1.4 billion a year in California alone by 2020. Then, we apply this methodology to the most recently available Investor Owned Utility (IOU) General Rate Case (GRC) filing – Pacific Gas and Electric’s 2017 GRC – in order to evaluate whether DERs can cost effectively replace real-world planned distribution capacity projects. Finally, we evaluate the impediments to capturing these benefits in practice. These structural impediments undermine the deployment of optimal solutions and pose economic risk to consumers, who ultimately bear the burden of an expensive grid. Accordingly, we suggest several ways to overcome these impediments by improving the prevailing utility regulatory and planning models. Distributed Energy Resources Offer a Better Alternative This report presents an economic analysis of building and operating a 21 st century power grid – a grid that harnesses the full potential of distributed energy resources such as rooftop solar, smart inverters, energy storage, energy efficiency, and controllable loads. We find that an electric grid leveraging DERs offers an economically better alternative to the centralized design of today. DERs bring greater total economic benefits at lower cost, enable more affordability and consumer choice, and improve flexibility in grid planning and operations, all while facilitating the de-carbonization of our electricity supply. Over $1.4 Billion per Year in Net Societal Benefits from DERs by 2020 A Pathway to the Distributed Grid Evaluating the economics of distributed energy resources and outlining a pathway to capturing their potential value White Paper
  • 2. SolarCity Grid Engineering | www.solarcity.com/gridx | Page 2 To evaluate the potential benefits, we build on existing industry methodologies to quantify the net societal benefits of DERs. Specifically, we borrow the Net Societal Costs/Benefits framework from the Electric Power Research Institute (EPRI), 2 incorporating commonly recognized benefit and cost categories, while also proposing methodologies for several hard-to- quantify benefit categories that are often excluded from traditional analyses. Next, we incorporate costs related to the deployment and utilization of DERs, including integration costs at the bulk system and distribution levels, DER equipment costs, and utility program management costs. Using this structure, we quantify Net Societal Benefits of more than $1.4 billion a year by 2020 for California alone from DER assets deployed in the 2016-2020 timeframe, as depicted in the previous figure. In addition to evaluating net societal benefits at the system level, we consider the benefits of DER solutions for specific distribution projects in order to evaluate whether DERs can actually defer or replace planned utility investments in practice. Specifically, we apply the relevant set of cost and benefit categories to the actual distribution investment plans from California’s most recently available GRC filing, which is PG&E’s 2017 General Rate Case Phase I filing. This real-world case study assesses a commonly voiced critique of utilizing DERs in place of traditional utility infrastructure investments: that not all avoided cost categories are applicable for every distribution project, or that DERs only provide a subset of their potential benefits in any specific project. Therefore, we consider only a subset of utility-applicable avoided cost categories when assessing the set of distribution infrastructure projects in PG&E’s 2017 GRC filing; we also utilize PG&E’s own avoided cost values rather than our own assumptions. Even using PG&E’s conservative assumptions on this subset of benefits, we quantify a net benefit for DER solutions used to replace the distribution capacity investments in PG&E’s 2017 GRC. Utility Regulatory Incentives Must Change in Order to Capture DER Benefits While our analysis shows net societal benefits from DERs, both at the societal and distribution project levels, under the prevailing utility regulatory model DER benefits cannot be fully captured. Instead, utilities have a fundamental financial incentive of “build more to profit more”, which conflicts with the public interest of building and maintaining an affordable grid. Under today’s regulatory paradigm, utilities see a negative financial impact from utilizing resources for distribution services that they do not own – which includes the vast majority of distributed energy resources – even if those assets would deliver higher benefits at lower cost to ratepayers. This financial incentive model is a vestige of how utilities have always been regulated, a model originally constructed to encourage the expansion of electricity access. However, in this age of customers managing their energy via DERs, this regulatory model is outdated. This report offers a pathway to removing this structural obstacle, calling for a regulatory model that neutralizes the conflict of incentives facing utilities. While separating the role of grid planning and sourcing from the role of grid asset owner – such as through the creation of an independent distribution system operator (IDSO) – would achieve this objective, some states may choose not to implement an IDSO model at this time. In these instances, this paper proposes the creation of a new utility sourcing model, which we call Infrastructure- as-a-Service, that allows utility shareholders to derive income, or a rate of return, from competitively sourced third-party services. This updated model would help reduce the financial disincentive that currently biases utility decision-making against DERs, encouraging utilities to deploy grid investments that maximize ratepayer benefits regardless of their ownership. Grid Planning Must be Modernized in Order to Capture DER Benefits A second structural impediment to realizing DER benefits is the current grid planning approach, which biases grid design toward traditional infrastructure rather than distributed alternatives, even if distributed solutions better meet grid needs. Combined with the “build more to profit more” financial incentive challenge, current grid planning can encourage ‘gold- plating’, or overinvestment, in grid infrastructure. Furthermore, outdated planning approaches rely on static assumptions about DER capabilities and focus primarily on mitigating potential integration challenges rather than proactively harnessing these flexible assets. This report offers a pathway to modernizing grid planning, calling for the utilization of an Integrated Distribution Planning approach that encourages incorporating DERs into every aspect of planning, rather than merely accommodating DER interconnection. Additionally, transparency into grid needs and planned investments is fundamental to realizing benefits. As such, this report recommends a data transparency approach that invites broad stakeholder engagement and increases industry competition in providing grid solutions. Key Takeaways 1. Distributed energy resources offer net economic benefits to society worth more than $1.4 billion per year in California alone by 2020, including benefits related to voltage and power quality, conservation voltage reduction, grid reliability and resiliency, equipment life extension, and reduced energy prices.
  • 3. SolarCity Grid Engineering | www.solarcity.com/gridx | Page 3 2. To realize these benefits, the utility regulatory incentive model must change to take advantage of customer choices to manage their own energy. Utility incentives should promote best-fit, least-cost investment decisions regardless of service supplier – eliminating the current bias toward utility-owned investments. 3. Utility planning approaches must also be modernized to capture these benefits. Utilization of an integrated distribution planning framework will unlock the economic promise of distributed energy resources, while widely sharing utility grid data in standard data formats will invite broader stakeholder engagement and competition. Recommendations and Next Steps Our ultimate goal is to help provide concrete evidence and recommendations needed by regulators, legislatures, utilities, DER providers, and industry stakeholders to transition to a cleaner, more affordable and resilient grid. While the details of implementing these recommendations would vary from state to state, we see the following as promising steps forward for all industry stakeholders in modernizing our grid: 1. Future regulatory proceedings and policy venues related to capturing the benefits of DERs should incorporate the expanded benefit and cost categories identified in this paper. 2. Regulators should look for near-term opportunities to modernize the utility incentive model, either for all utility earnings or at a minimum for demonstration projects, to eliminate the bias toward utility-owned investments. 3. Regulators should require utilities to modernize their planning processes to integrate and leverage distributed energy resources, utilizing the integrated distribution planning process identified in this paper. 4. Regulators should require utilities to categorize all planned distribution investments in terms of the underlying grid need. Utilities should make data available electronically to industry, ideally in a machine-readable format. Call for Input We offer this paper as an effort to support the utilization of grid modernization to maximize ratepayer benefits. The cost/benefit analysis we develop here is an effort meant to expand the industry’s ability to quantify the holistic contribution that DERs offer to the grid and its customers, extending the familiar cost/benefit framework beyond PV-only analyses and into full smart inverter and DER portfolios. Furthermore, we recognize that important regulatory proceedings – such as the CPUC Distribution Resource Plans (DRP) and CPUC Integrated Distributed Energy Resources (IDER) – will play an important role in giving stakeholders the tools to calculate the value of DERs, and offer this paper a as resource in those efforts. No single report could adequately address all the issues – engineering, economic, regulatory – that naturally arise during such a transformative time in the industry. By compiling the major issues in one place, we attempt to advance the discussion and suggest that this paper includes a “table of contents” of critical topics for regulators and industry stakeholders to consider when evaluating the full potential of distributed energy resources. There are many details of this paper that can be refined, including utilizing more complete data sets to inform the cost/benefit analysis. We welcome ongoing dialogues with utilities and other stakeholders to improve the assumptions or calculations herein, including sharing data and revising methodologies to arrive at more representative figures. In fact, most of the authors of this paper are former utility engineers, economists, technologists, and policy analysts, and would value the opportunity to collaborate. We welcome a constructive dialogue, and can be reached at gridx@solarcity.com. Acknowledgements We would like to thank the following industry stakeholders who were willing to provide their valuable feedback on the content of this paper. While we incorporated their input to every extent possible, we, the authors, are solely responsible for the information presented and the conclusions drawn in the report. Jon Wellinghoff Virginia Lacy, Jamie Mandel Michael O’Boyle Stoel Rives LLP Rocky Mountain Institute Energy Innovation
  • 4. SolarCity Grid Engineering | www.solarcity.com/gridx | Page 4 I. Introduction Grid Investments are Increasing Grid infrastructure planners are responsible for some of the most significant infrastructure investments in the United States. As of 2011, U.S. utilities had almost half a trillion dollars of undepreciated transmission, distribution and generation assets on their balance sheets, growing at a rate of 6 to 8% per year. 3 As depicted in the adjacent figure, the Edison Electric Institute forecasts that another $879 billion dollars in distribution and transmission investments alone will occur in the twenty year period of 2010 through 2030 – about $44 billion dollars per year – significantly larger than investments seen in the previous 20 year period. 4 Grid investments have a significant and increasing impact on the total electricity costs faced by U.S. consumers. In light of this huge level of grid investment occurring over the next few decades, an imperative exists to ensure that these investments are deployed to maximize ratepayer benefits. There has been relatively little focus to date on how to effectively focus and reduce these infrastructure costs, particularly in the areas of transmission and distribution planning, despite the fact that they often make up half of the average residential customer’s bill. This level of investment calls for a reexamination of the technological solutions available to meet the grid’s needs and an overhaul of the planning process that deploys these solutions. States like California and New York have begun this process, primarily spurred by a focus on how distribution planning and operations may evolve in a future with high penetration of distributed resources. 5 While these nascent discussions and rulemakings are positive first steps, the planning framework for grid modernization must change considerably to avoid costing ratepayers billions in unnecessary, underutilized investments. Current Utility Regulatory Model Incents a Build More to Profit More Approach The current utility regulatory model, which was designed around a monopoly utility managing all aspects of grid design and operation, is outdated and unsuited for today’s reality of consumers installing DERs that can benefit the grid. Therefore, industry fundamentals need to be reexamined, and the utility incentive model is a key place to start. Electric utilities are generally regulated under a “cost plus” model, which compensates utilities with an authorized rate of return on prudent capital investments made to provide electricity services. While this model makes sense when faced with a regulated firm operating in a natural monopoly, it is well known to result in a number of economic inefficiencies, as perhaps best analyzed by Jean Tirole in his Nobel Prize winning work on market power and regulation. 6 One fundamental problem resulting from the “cost plus” utility regulatory model is that utilities are generally discouraged from utilizing infrastructure resources that are not owned by the utility, even if competitive alternatives could deliver improved levels of service at a lower cost to ratepayers. Beyond regulatory oversight, this model contains no inherent downward economic pressure on the size of the utility rate base, or the cumulative amount of assets upon which the utility earns a rate of return. As such, utility rate bases have consistently and steadily grown over time. For example, the following chart depicts the size and recent growth of the electricity rate base for California investor-owned utilities, which continues to significantly grow even in the presence of flat electricity consumption. In short, the fundamental incentive utilities have to build more utility-owned infrastructure in order to profit more conflicts with the public interest as the grid becomes more customer-centric and distributed.
  • 5. SolarCity Grid Engineering | www.solarcity.com/gridx | Page 5 Trends in Rate Base for California Investor-Owned Utilities 7,8 Traditional Grid Planning Focuses on Traditional Assets Grid planning for infrastructure investments has historically focused on installing expensive, large assets that provide service over a wide geographic region. This structure naturally evolved from the technology and market characteristics of the original electricity industry, including a natural monopoly, centralized generation, long infrastructure lead times, high capital costs with significant economies of scale, and a concentration of technical know-how within the utility. Many of these barriers have been eliminated with the technological advancement in physical infrastructure options – such as DER portfolios that can meet grid needs – and increased sophistication of grid design and operational tools. However, grid planning remains focused on utilizing traditional infrastructure to the detriment of harnessing the increasing availability of DERs. Utilizing DER solutions will require a shift in grid planning approaches, as well as increased access to the underlying planning and operational data needed to enable DERs to operate most effectively in concert with the grid. Distributed Energy Resources Offer Increased Grid Flexibility Distributed energy resources include assets such as rooftop PV, smart inverters, controllable loads, permanent load shifting, combined heat and power generators, electric vehicles, and energy efficiency resources. These resources provide a host of benefits to the customer, utility, and transmission operator as identified by numerous research organizations including EPRI and the Rocky Mountain Institute (RMI). As depicted in the RMI figure to the right, diverse portfolios of DERs offer a wide range of grid services at the distribution, transmission, and customer levels. 9 Distributed energy resources can offer deferral and avoidance of planned grid investments, improved grid resiliency, and increased customer choice. DERs, if deployed effectively and placed on equal footing in the planning process with traditional grid investments, can ultimately lead to increased net benefits for ratepayers. Diverse DER portfolios can provide up to 13 services to 3 stakeholder groups Reprinted with permission from Rocky Mountain Institute
  • 6. SolarCity Grid Engineering | www.solarcity.com/gridx | Page 6 II. Distributed Energy Resources Offer a Better Alternative Motivated by the challenge faced in designing a grid appropriate to the 21 st century, this report first focuses on determining the quantifiable net economic benefits that DERs can offer to society. The approach taken builds on existing avoided cost methodologies – which have already been applied to DERs by industry leaders – while introducing updated methods to hard- to-quantify DER benefit categories that are excluded from traditional analyses. While the final net benefit calculation derived in this report is specific to California, the overall methodological advancements developed here are applicable across the U.S. Moreover, the ultimate conclusion from this analysis – that DERs offer a better alternative to many traditional infrastructure solutions in advancing the 21 st century grid – should also hold true across the U.S., although the exact net benefits of DERs will vary across regions. A. Methodology The methodology utilized in this paper is built upon well-established frameworks for valuing policies, programs and resources – frameworks that are grounded in the quantification of the costs and benefits of distributed energy resources. Specifically, the methodology employed here: 1. Begins with the Electric Power Research Institute’s 2015 Integrated Grid/Cost Benefit Framework in order to quantify total net societal costs and benefits in a framework that applies nationally. 10 2. Quantifies the benefits for the state of California, where the modeling of individual cost and benefit categories is possible using the California Public Utilities Commission 2015 Net Energy Metering Successor Public Tool. 11 Within the context of California, this report’s DER avoided cost methodology is expanded beyond EPRI’s base methodology to incorporate commonly recognized (although not always quantified) categories of benefits and costs, while also proposing methodologies for several hard-to-quantify categories using the Public Tool. 3. Incorporates the full costs of DER integration, including DER integration cost data as identified by California utilities in their 2015 Distribution Resource Plans 12 to determine the net benefits of achieving 2020 penetration levels. 4. Repeats the methodology in a concrete case study by applying it to the planned distribution capacity projects from the most recent Phase I General Rate Case in California. Enhancing Traditional Cost/Benefit Analysis and Describing Benefits as Avoided Cost Cost/benefit analyses have been conducted for many decades to evaluate everything from utility-owned generation to utility- administered customer programs such as energy efficiency rebates and demand response program funding. This paper replicates established methodologies wherever possible, and offers new or enhanced methodologies where appropriate to consider new benefit categories that are novel to customer-driven adoption of DERs, and therefore often excluded from traditional analyses. A key component of cost/benefit analysis commonly used for valuing the benefits of DER is the avoided cost concept, which considers the benefits of a policy pathway by quantifying the reduction in costs that would otherwise be incurred in a business-as-usual trajectory. While avoided cost calculations can be performed with varying scopes, 13 there is some degree of consensus on what the appropriate value categories are in a comprehensive avoided cost study. Groups like IREC, 14 RMI 15 and EPRI 16 have attempted to take these standard valuation frameworks even further, describing general methods for valuing some of the benefit categories that are often excluded from traditional analyses. Each step taken by researchers to enhance previously used avoided cost methodologies advances the industry beyond outdated historical paradigms. DER-specific methodological updates include the consideration of new types of avoided costs that could be provided by distributed resources, or a revision of the assumption that resources adopted by customers are uncontrollable, passive deliverers of value to the grid and that proactive planning and policies cannot or will not be implemented to maximize the value of these grid-interactive resources. This report continues the discussion using EPRI’s 2015 Integrated Grid/Cost Benefit Framework as a springboard. EPRI’s framework, depicted in the following image) was chosen as it is the most recently published comprehensive cost/benefit analysis framework for DERs. This report assumes a basic familiarity with EPRI’s methodology – or avoided cost methodologies in general – on the part of the reader, although explanations of each cost or benefit category are included in the following section.
  • 7. SolarCity Grid Engineering | www.solarcity.com/gridx | Page 7 EPRI Cost/Benefit Framework 17 The Value of DERs within California While the overall methodology enhanced within this report is applicable nationwide, the focus of this report’s economic valuation of DERs in the cost/benefit analysis is limited to the state of California. For California’s NEM 2.0 proceeding, the energy consulting firm Energy+Environmental Economics (E3) created a sophisticated model that parties used to determine the impact of various rate design proposals. A major component of this model was the ability to assess DER avoided costs under different input assumptions. The more traditional avoided cost values in this paper are derived from the inputs used in the NEM 2.0 proposal filing of The Alliance of Solar Choice (TASC) for the E3 model, which is available publicly online. 18 Additionally, benefit and cost categories for DERs – along with accompanying data and quantification methods – are being developed in the CPUC Distribution Resource Plans (DRP) proceeding. This update of the DER valuation framework in the DRP proceeding, however, is not present in the existing methodologies being used to quantify the benefits of rooftop solar in California as part of the NEM 2.0 proceeding due to the concurrent timing of the two proceedings. This report bridges these two connected proceedings in its economic analysis of the value of DERs within California. While evaluating net societal benefits at the system level in California is a key step in understanding the total potential value of DERs, there remains much discussion within the industry regarding whether calculated net benefits can actually be realized from changes in transmission and distribution investment planning. To this end, this analysis applies the developed California DER valuation framework to a real-world case study utilizing the latest GRC filed in California, PG&E’s 2017 General Rate Case Phase I filing. By utilizing this third dataset, in addition to the NEM 2.0 and DRP proceedings, this analysis delivers a comprehensive and up-to-date consideration of the potential value DERs can provide to the grid. Analysis Scope, Assumed Scenario, and End State This report evaluates the benefits of customer DER adoption, the associated costs, and the resulting net benefit/cost. The benefits and costs of DER are highly dependent on penetration levels. Therefore, this analysis utilizes a set of common assumptions for expected DER penetration, and specifies a market end state scenario upon which benefits and costs are quantified. The end-state assumed in this report utilizes scenarios in Southern California Edison’s (SCE) July 1, 2015 Distribution Resource Plan, which includes DER adoption levels and integration cost estimates for the 2016-2020 period. These integration costs inform DER penetration assumptions, which are applied consistently across the benefits calculations to ensure that the costs of low penetration are not attributed to the benefits of high penetration, and vice-versa.
  • 8. SolarCity Grid Engineering | www.solarcity.com/gridx | Page 8 Incremental DER Adoption Scenario for 2016-2020 To simplify the discussion, solar deployment is focused on the years 2016-2020, adopting the penetration levels and costs associated with the TASC reference case as filed in the CPUC NEM 2.0 proposal filing, which corresponds approximately to SCE’s Distribution Resource Plan Scenario 3. Of the approximately 900,000 new solar installations expected to be deployed during this period, SolarCity estimates 10% would adopt residential storage devices and 20% would adopt controllable loads (assumptions are based on customer engagement experience and customer surveys). These adoptions are central to the ability of customer DER deployments to defer and avoid traditional infrastructure investments as assessed in this paper. The assumptions described above are used to complete the cost/benefit analysis of DERs for the whole of California. After evaluating net societal benefits at the system level, the methodology is then applied to a particular case study of actual distribution projects proposed under the latest GRC filed within California, PG&E’s 2017 General Rate Case Phase I filing. In the following sections, the deployment scenario is evaluated both qualitatively and quantitatively under a cost-benefit framework that is grounded in established methodologies, but enhanced to consider the impact of such a large change in the way the electric system is operated. The study consolidates a range of existing analyses, reports and methodologies on DERs into one place, supporting a holistic assessment of the energy policy pathways in front of policy-makers today. B. Avoided Cost Categories The avoided cost categories evaluated in this report are summarized in the following table. The first seven categories are included within traditional cost-benefit analyses, and as such are not substantially extended in this report (see Appendix for methodological overviews and TASC NEM Successor Tariff filing for comprehensive descriptions and rationale on assumptions 19 ). The next five categories (in yellow highlight) represent new methodology enhancements to hard-to-quantify avoided cost categories (i.e. benefit categories) that are that are often excluded from traditional analyses. In this section, we detail the methodology and rationale for quantifying these five avoided cost categories.
  • 9. SolarCity Grid Engineering | www.solarcity.com/gridx | Page 9 Voltage, Reactive Power, and Power Quality Support Solar PV and battery energy storage with ‘smart’ or advanced inverters are capable of providing reactive power and voltage support, both at the bulk power and local distribution levels. At the bulk power level, smart inverters can provide reactive power support for steady-state and transient events, services traditionally supplied by large capacitor banks, dynamic reactive power support, and synchronous condensers. For example, in Southern California the abrupt retirement of the San Onofre Nuclear Generation Station (SONGS) in 2013 created a local shortage of reactive power support, endangering stable grid operations for SCE in the Los Angeles Basin area. To meet this reactive power need, SCE sought approval to deploy traditional reactive power equipment at a cost of $200-$350 million, as outlined in the table below. DERs were not included in the procurement to meet this need. Had DERs with smart inverters been evaluated as part of the solution, significant reactive power capacity could have been obtained to avoid the deployment of expensive traditional equipment. SONGS Reactive Power Replacement Projects Sources 20,21,22,23,24,25,26,27 At the distribution level, smart inverters can provide voltage regulation and improve customer power quality, functions that are traditionally handled by distribution equipment such as capacitors, voltage regulators, and load tap changers. While the provision of reactive power may come at the expense of real power output (e.g. such as power otherwise produced by a PV system), inverter headroom either exists or can readily be incorporated into new installations to provide this service without impacting real power output. The capability of DER smart inverters to provide voltage and power quality support is currently being demonstrated in several field demonstration projects across the country. For instance, a demonstration project in partnership with an investor-owned utility is currently demonstrating the voltage support from a portfolio of roughly 150 smart inverters controlling 700kW worth of residential PV systems. The chart below depicts the dynamic reactive power delivered to support local voltage. In this instance, smart inverter support resulted in a 30% flatter voltage profile. 28 Reactive power and voltage support from a smart inverter
  • 10. SolarCity Grid Engineering | www.solarcity.com/gridx | Page 10 Projects such as the SONGS reactive power procurement project provide recent examples where utility investment was made for reactive power capacity. These projects were used to quantify the economic benefit of DERs providing reactive power support. To do so, a corresponding $/kVAR-year value was applied to the inverter capacity assumed in the deployment scenarios to determine the value of the services offered by the DER portfolio. Note, also, that markets including NYISO, PJM, ISO-NE, MISO, and CAISO already compensate generators for capability to provide and provision of reactive power. 29 Conservation Voltage Reduction Smart inverters can enable greater savings from utility conservation voltage reduction (CVR) programs. CVR is a demand reduction and energy efficiency technique that reduces customer service voltages in order to achieve a corresponding reduction in energy consumption. CVR programs are often implemented system-wide or on large portions of a utility’s distribution grid in order to conserve energy, save customers on their energy bills, and reduce greenhouse gas emissions. CVR programs typically save up to 4% of energy consumption on any distribution circuit. 30 The utilization of smart inverters is estimated to yield another 1-3% of incremental energy consumption savings and greenhouse gas emissions reductions. From an engineering perspective, CVR schemes aim to reduce customer voltages to the lowest allowable limit as allowed by American National Standards Institute (ANSI) standards. However, CVR programs typically only control utility-owned distribution voltage regulating equipment, changes to which affect all customers downstream of any specific device. As such, CVR benefits in practice are limited by the lowest customer voltage in any utility voltage regulation zone (often a portion of a distribution circuit), since dropping the voltage any further would violate ANSI standards for that customer. Since smart inverters can increase or decrease the voltage at any individual location, DERs with smart inverters can be used to more granularly control customer voltages in CVR schemes. For example, if the lowest customer voltage in a utility voltage regulation zone where to be increased by, say, 1 Volt by controlling a local smart inverter, the entire voltage regulation zone could then be subsequently lowered another Volt, delivering substantially increased CVR benefits. Such an example is depicted in the image below, where the green line represents a circuit voltage profile where smart inverters support CVR. Granular control of customer voltages through smart inverters can dramatically increase CVR benefits. DERs control voltage locally and enable CVR Equipment Life Extension Either through local generation, load shifting, and/or energy efficiency, DERs reduce the net load at individual customer premises. A portfolio of optimized DERs dispersed across a distribution circuit in turn reduces the net load for all equipment along that distribution circuit. Distribution equipment, such as substation transformers, operating at reduced loading will benefit from increased equipment life and higher operational efficiency.
  • 11. SolarCity Grid Engineering | www.solarcity.com/gridx | Page 11 Distribution equipment may operate at very high loading during periods of peak demand, abnormal configuration, or emergency operation. When the nominal rating of equipment is exceeded, or overloaded, the equipment suffers from degradation and reduction in operational life. The more frequently that equipment is overloaded, the more that such degradation occurs. Furthermore, the efficiency of transformers and other grid equipment falls as they perform under increased load. The higher the overload, the larger the efficiency losses. Utilities have significant portions of their grid equipment that regularly operate in overloaded fashion. DERs’ ability to reduce peak and average load on distribution equipment therefore leads to a reduction in the detrimental operation of the equipment and an increase in useful life, as shown in the following figure. The larger the peak load reduction, the larger the life extension and efficiency benefits. Distributed Energy Resources Extend Transformer Life To quantify these benefits, medium to large liquid-filled transformers were modeled with typical load and DER generation profiles. The magnitude of the reduced losses and resulting equipment degradation avoidance were calculated using IEEE C57.12.00-2000 standard per unit life calculation methodology. 31,32 DERs such as energy storage are able to achieve an even greater avoided cost than solar alone, as storage dispatch can more closely match the distribution peak. Quantified benefits contributing to net societal benefits calculation include the deferred equipment investment due to extended equipment life and reduced energy losses through increased efficiency. Note that non-optimized DERs can be cited as having negative impact on equipment life. While highly variable generation and load can negatively impact equipment life – such as driving increased operations of line regulators – optimized and coordinated smart inverters mitigate this potential volatility impact on equipment life. Resiliency and Reliability DERs such as energy storage can provide backup power to critical loads, improving customer reliability during routine outages and resiliency during major outages. The rapidly growing penetration of batteries combined with PV deployments will reduce the frequency and duration of customer outages and provide sustained power for critical devices, as depicted in the adjacent figure. Improved reliability and resiliency has been the goal of significant utility investments, including feeder reconductoring and distribution automation programs such as fault location, isolation, and service restoration (FLISR). Battery deployments throughout the distribution system can eventually reduce utility reliability and resiliency investments. However, this analysis utilizes a conservative approach, only considering average customer savings from reduced outages and excludes avoided utility investments. Distributed Energy Resources Improve Customer Resiliency and Reliability
  • 12. SolarCity Grid Engineering | www.solarcity.com/gridx | Page 12 To quantify near-term reliability and resiliency benefits, the value of lost load as calculated by Lawrence Berkeley National Lab 33 was applied to the energy that could be supplied during outages. Outages were based on 2014 CPUC SAIFI statistics. Market Price Suppression Effect Wholesale electricity markets provide a competitive framework for electric supply to meet demand. In general, as electric demand increases market prices increase. DERs can provide value by reducing the electric demand in the market, leading to a reduction in the market clearing price for all consumers of electricity. This effect was recently validated in the U.S. Supreme Court’s decision to uphold FERC Order 745, noting that operators accept demand response bids if and only if they bring down the wholesale rate down by displacing higher-priced generation. Notably, the court emphasized that “when this occurs (most often in peak periods), the easing of pressure on the grid, and the avoidance of service problems, further contributes to lower charges.” 34 As a behind-the-meter resource, rooftop solar impacts wholesale markets in a similar way to demand response, effectively reducing demand and thus clearing prices for all resources during solar production hours. While the CPUC Public Tool attempts to consider the avoided cost of wholesale energy prices, it does not consider the benefits of reducing wholesale market clearing prices from what they would have been in the absence of solar. This effect is illustrated in the adjacent figure. In the presence of DERs, energy prices are at the lower “P∗ ” price which otherwise would have been at the higher “P” price absent the DERs. Market price suppression could then be quantified as the difference between prices multiplied by load, or (P − P∗ ) ∗ L∗ . To quantify the magnitude of cost reductions due to market price suppression, this report estimates the relationship between load and market prices based on historical data. It is important to isolate other driving factors to only capture the effect of load change on prices. One of these driving factors is natural gas prices, which directly impacts electric prices because the marginal supply resource in California is often a natural gas-fired power plant. This can be isolated by normalizing market prices over gas prices, known as Implied Heat Rate (IHR), and estimating the relationship between IHR and load, which is shown in figure below for PG&E DLAP prices and load. Relationship between electric demand and Implied Heat Rate for PG&E Relationship between Electric Demand and Wholesale Market Prices
  • 13. SolarCity Grid Engineering | www.solarcity.com/gridx | Page 13 Smart energy homes equipped with energy storage are able to achieve an even greater avoided cost than distributed solar alone. Storage devices that discharge in peak demand hours with high market clearing prices can take advantage of the stronger relationship between load and price at high loads. Results After establishing the 2016-2020 penetration scenario and defining the methodologies for each category of avoided cost, the CPUC Public Tool was utilized to estimate the benefits of achieving the 2020 penetration scenario. For avoided cost categories the CPUC Public Tool was not able to incorporate, calculations were completed externally using common penetration and operational assumptions for each technology type. In order to be consistent with the CPUC Public Tool outputs, levelized values are expressed in annual terms in 2015 dollars below. Annual Benefits of 2016-2020 DER Deployments Previous assessments of high penetration DERs have replicated existing methodologies that have often been applied to passive assets like energy efficiency; however, these approaches fail to recognize the potential value of advanced DERs that will be deployed during the 2016-2020 timeframe. When a more comprehensive suite of benefits that could be generated by DERs today is considered, total benefits of the 2016-2020 DER portfolio in California exceeds $2.5 billion per year. C. The Costs of Distributed Energy Resources As presented above, distributed resources offer significant ratepayer benefits; however, these benefits are not available without incurring incremental costs to enable their deployment. In order to quantify the net societal benefit of DERs, these costs must be subtracted from the benefits. Costs for distributed energy resources include integration at the distribution and bulk system levels, utility program management, and customer equipment. Distribution Integration Costs DERs are a critical new asset class being deployed on the distribution grid which must be proactively planned for and integrated with existing assets. This integration process will sometimes require unavoidable additional investments. However, it is essential to separate incremental DER integration costs from business as usual utility investments. Recent utility funding requests for DER integration have included costs above those needed to successfully integrate DERs. This subsection will explore typical DER integration costs and evaluate the validity of each type. While new DER integration rules of thumb and planning guidelines are emerging, 35 no established approach exists for identifying DER integration investments or estimating their cost. It is clear, however, that integration efforts and costs vary by DER penetration level. Generally, lower DER penetration requires fewer integration investments, while higher penetration
  • 14. SolarCity Grid Engineering | www.solarcity.com/gridx | Page 14 may lead to increased investment. As depicted in the following chart, NEM PV penetration levels vary across the U.S. 36 Most states have very low (<5%) penetrations, while only Hawaii experiences medium (10-20%) penetration. California exhibits low (5-10%) penetration overall, although individual circuits may experience much higher penetration. NEM Solar Capacity as a Percentage of Total System Peak For this analysis, DER integration costs were developed from estimates submitted by California utilities to the CPUC as part of their Distribution Resource Planning (DRP) filings. This analysis incorporates the specific cost categories and figures from Southern California Edison’s filing, since this filing alone included specific cost estimates. In assessing these costs, each proposed investment was reviewed to determine whether it was a required incremental cost resulting from the integration of DERs. If so, it should indeed be included in the cost/benefit calculation. If the investment (or a portion thereof) was determined to be a component of utility busines as usual operations, such investment was not included in the analysis. In order to determine whether a proposed utility investment is required, the following threshold question was asked:  Would these costs be incurred even in the absence of DER adoption? If the costs would be incurred regardless of DER adoption, or if the utility had previously requested regulatory approval for the investment but justified the investment via a program unrelated to DER adoption, then the costs should not be classified as DER integration costs. For example, if a utility had previously requested approval to upgrade (i.e. cutover) 4kV circuits to a higher voltage in order to increase capacity and reliability before DERs were prevalent, yet now associates the upgrade costs to DERs, then the investment should not be attributed to DER integration. This threshold analysis eliminates from consideration or reduces some of the proposed utility integration costs. Of the remaining costs, each was further assessed by asking the following set of screening questions:  Do more cost effective mitigation measures exist for the proposed investment? Can advanced DER functionalities (e.g. volt/VAR support) mitigate or eliminate the need for the investment?  Are costs relevant for the forecasted DER penetration levels, or only for much higher penetrations?  Do stated costs reflect realistic cost figures, or do they reflect inflated estimates? Several utility integration investments are proposed to mitigate an integration challenge where more cost effective solutions exist. For example, voltage-related concerns due to PV variability are often used to justify replacement of capacitor banks on distribution feeders. However, the use of embedded voltage and reactive power capabilities in smart inverters make the deployment of new capacitor banks redundant and overly expensive in most instances. Furthermore, while some proposed costs may be relevant for high penetrations of DERs – such as bi-directional relays to deal with reverse power flows – these investments may not be necessary at low penetration levels. The following table presents the DER integration investment categories as identified in SCE’s DRP filing according to its Scenario 3 forecast for DER growth in California. SCE’s integration costs were scaled up in order to estimate total distribution
  • 15. SolarCity Grid Engineering | www.solarcity.com/gridx | Page 15 integration costs for all California utilities; therefore, the table represents total California distribution integration costs over 2016-2020. For each investment, applicability to DER integration is assessed using the threshold and screening questions discussed above, resulting in a quantification of costs that are directly “Applicable to DERs”. An overview of the assessment of each high-level integration category is provided in the table, with more detailed technical discussion of each investment type and assessment rationale offered in the Appendix. This cost quantification is necessarily high-level due to the lack of details available for each investment type. As such, more specific assessment is necessary in order to evaluate integration investment plans. This exercise identifies 25% of SCE’s DER integration costs, or $1,450 million (or levelized to $189 million annually 37 ), as truly applicable to DER integration, which is the number utilized in the cost/benefit analysis in this paper. Bulk System Integration Costs Integration of variable resources with the bulk power grid is expected to result in an increase in variable operating costs associated with the way the generation fleet is used to accommodate the variability. To quantify this cost, $/MWh values quantifying this cost for a 33% renewable portfolio standard were scaled per calculations adopted by the California PUC. 38 Utility Program Management Costs To estimate the incremental utility program costs associated with DER adoption, the default inputs within the Public Tool were used, which include upfront installation and metering costs, as well as incremental billing costs. All told, these costs amounted to $26 million per year based on the level of adoption in the TASC base case scenario. Customer Equipment Costs The costs of DERs themselves must be considered, including the cost of equipment, labor, and financing. For solar, CPUC Energy Division staff’s reference case solar price forecast is used to determine the cost of deployed equipment in the 2016- 2020 timeframe, factoring in the December 2015 extension of the Federal Investment Tax Credit. For storage, the price forecast was based on Navigant Research’s projections; 39 for controllable thermostats, current vendor prices were used. Based on these forecasts, deployments forecasted for the 2016-2020 timeframe yielded a blended average adoption cost of the installed base of $3.86/W for the 2016-2020 timeframe, or $2.70/W after reflecting the 30% Federal Investment Tax Credit (ITC). In absolute terms, the total cost of adoption to Californians translates to $12.1 billion (nominal) for 4.5GW of rooftop solar. For co-located storage and load control, total investment to meet adoption forecasts totals $259 million. Results Societal net benefits calculations require a comprehensive consideration of costs that society bears as a result of attaining the specified 2020 penetration levels, including the costs of administering customer programs, grid integration costs needed to accommodate new assets, and the cost of the assets themselves, which are borne by customers. In the table below, each category is quantified, totalling $1.1 billion per year.
  • 16. SolarCity Grid Engineering | www.solarcity.com/gridx | Page 16 D. Quantifying Net Benefits In this section, we complete EPRI’s Cost/Benefit analysis by comparing benefits and costs of DERs during the 2016-2020 deployment timeframe. For consistent comparisons, levelized costs and benefits are based on the year 2020, with all benefits and costs values translated to 2015 dollars. 40 Establishing a common DER penetration scenario and converting all benefits and costs to net present value terms allows simple summation of each category to provide indicative societal net benefit, suggesting a significant societal value for widespread DER adoption. In total, the benefits of the analyzed scenario are $2.5 billion per year, compared to costs of $1.1 billion per year, resulting in a net societal benefit to Californians of $1.4 billion per year by 2020. Results of EPRI Societal Net Benefit Test E. Case Study: PG&E’s Planned Distribution Projects in 2017 General Rate Case In the previous section, categories of avoided costs were described and the corresponding values were quantified for the state of California. In this section, the same methodology is applied to PG&E’s planned distribution projects from its most recent PG&E 2017 General Rate Case filing from September 2015. Every three years, California utilities seek approval to recover expenses and investments, including a target profit level, that are deemed necessary for the prudent provision of utility services. For perspective, half of customer’s utility payments were
  • 17. SolarCity Grid Engineering | www.solarcity.com/gridx | Page 17 driven by the “wires” component of the electric grid in 2014 41 and California’s investor owned utilities are expected to add $143 billion of new capital investment into their distribution rate bases through 2050. 42 Despite the significant size of this avoided cost category, DERs have historically been considered passive assets having little potential on the “wires” side of the business. While not all distribution investment can be avoided by DERs, some of the currently-planned projects are being implemented to accommodate demand growth and replacement of aging assets; these projects could instead be deferred or avoided by DERs. While the CPUC Public Tool uses a generalized treatment of distribution capacity avoided costs to estimate the potential value of deferrals across utilities, more specific values are used in this section sourced from publicly available documents. The table below summarizes the large capacity-related distribution projects detailed in PG&E’s General Rate Case. PG&E seeks approval of $353 million for these distribution system investments. 43 When this $353 million PG&E capital investment is adjusted to factor in the ratepayer perspective – which includes the lifetime cost of the utility’s target profit level and recovery of costs related to operations and maintenance, depreciation, interest and taxes from ratepayers – the net present societal cost to PG&E ratepayers of these distribution capacity projects is approximately $586 million. 44 This $586 million cost to ratepayers adds over 1GW of conventional distribution capacity but addresses only 256 MW of near-term capacity deficiencies on PG&E’s distribution system when deployed. Summary of PG&E Electric Distribution Capacity Request – 2017 GRC 45 Based on this societal cost, we consider the net benefits of an alternative, DER-centric solution, which relies on solar with smart inverters, energy storage and controllable thermostats. Due to lack of sufficient detail from PG&E’s General Rate Case regarding the operational profiles of the electric distribution capacity projects in question, a simplifying assumption of 75% is used for the DER portfolio’s distribution load carrying capacity ratio, which is based on the CPUC’s Public Tool default peak capacity allocation factors (PCAF) for PG&E’s distribution planning areas. This load carrying capacity ratio reflects capabilities based on customer adoptions with a storage sizing ratio of 2 kWh of energy storage for every 1 kW of PV capacity, or approximately 10 kWh of energy storage for a customer with 5kW of solar installed, as well as a controllable thermostat. In order to accurately compare the DER solution, the full lifetime cost of the DER solution is considered, which includes the costs of additional DERs that would be needed to accommodate load growth over the lifetime of the conventional solution – assumed to be 25 years. This DER solution deployment schedule, which continuously addresses incremental capacity needs on the grid, contrasts with the traditional, bulky solution deployment schedule, which requires a large upfront investment for capacity to address a small, incremental near-term need. While a DER solution delivers sufficient capacity in each year to provide comparable levels of grid services, deployments occur steadily over time rather than in one upfront investment. This approach highlights one of the key potential benefits of utilizing a DER solution over a traditional, bulky grid asset: DERs can be flexibly deployed in small bundles over time, a benefit that is further explored in Section IV on the benefits of transitioning to more integrated distribution planning. Using these assumptions, the previous state-wide methodology is applied to DERs avoiding PG&E’s planned distribution capacity projects, but two conservative assumptions are made. First, the scope of benefits is limited to a subset of avoided cost categories that would be directly considered by utility planners today for these types of projects. Whereas conventional equipment used to meet distribution capacity projects are generally unidimensional resources providing a single source of value – distribution capacity – DERs provide multiple sources of value. Second, we base our calculations on PG&E’s lower avoided cost values, 46 rather than our own, to demonstrate that there are net benefits even under a conservative scenario. In addition to avoiding the ratepayer cost of $586 million for planned distribution capacity projects, the DERs deployed to avoid PG&E’s distribution capacity projects also avoid $946 million in energy purchases and $79 million and $99 million in generation capacity and avoided renewable energy credit purchases, respectively, totaling $1,709 million in benefits. On the cost side, program costs, integration costs and equipment costs for the associated DERs total to $1,605 million, resulting in a net present value to PG&E ratepayers of $104 million. This net benefit result is particularly notable given the limited scope of benefits considered in this case study and the reliance on PG&E’s lower avoided cost values.
  • 18. SolarCity Grid Engineering | www.solarcity.com/gridx | Page 18 Net Benefit of DER Solutions to PG&E Electric Distribution Capacity Request – 2017 GRC (Calculations Based on PG&E Cost and Benefit Assumptions) In this section, the data available to third-parties around distribution capacity projects from the most recent California Phase I General Rate Case (PG&E’s 2017 GRC filing) was used to explore the potential benefits of leveraging DERs to avoid conventional distribution capacity-related investments. Calculations were performed based on PG&E’s own avoided cost assumptions from NEM Successor Tariff filings and General Rate Case filings. Results indicate that deploying DER solutions in lieu of PG&E’s planned distribution capacity expansion projects in its 2017 GRC could yield net benefits, even looking only at the energy, capacity, and renewable energy compliance values of the DER solutions. While not preferred, simplified assumptions were used to fill missing sources of information and data (e.g. distribution peak capacity allocation factors and forecasted load growth) where necessary. That such simpliftubg assumptions are necessary highlights the need for additional data sharing on specific infrastructure projects in order to assess the potential of DERs to offset these investments. III. Utility Regulatory Incentives Must Change in Order to Capture DER Benefits Section II demonstrated how California could realize an additional $1.4 billion per year by 2020 in net benefits from the deployment of new DERs during the 2016-2020 timeframe. This state-wide methodology was then applied to the planned distribution capacity projects for California’s most recent GRC request, showing how the deployment of DERs in lieu of planned distribution capacity expansion projects in PG&E’s next rate case could save customers over $100 million. Despite this potential value from embracing a distribution-centric grid, utilities face institutional barriers to realizing these benefits. Reducing the size of a utility’s ratebase – its wires-related investments – cuts directly into shareholder profits. Expecting utilities to proactively integrate DERs into grid planning, when doing so has the potential to adversely impact shareholder earnings, is a structurally flawed approach. It will be impossible to completely capture the potential benefits of DERs until the grid planner’s financial conflict with the deployment of DERs is neutralized. Incentive Barriers Realigning the incentives of the grid planner to solely focus on delivering a safe, reliable and affordable grid, regardless of the ownership and service models that materialize in the market, is a necessary first step to realize the potential of DERs. There are two fundamental paths forward to address this conflict of interest.
  • 19. SolarCity Grid Engineering | www.solarcity.com/gridx | Page 19 The first path towards realizing this objective would be to separate the role of distribution planning, sourcing, and operations from the role of distribution asset owner, similar to the evolution of Independent System Operators (ISOs) and Regional Transmission Operators (RTO) at the bulk system level. FERC’s decree to create independent operators in Order 2000 was driven by the observation that the lack of independent operation of the bulk power system enabled transmission owners to continue discriminatory operation of their systems to favor their own affiliates and further their own interests. 47 However, while an independent distribution system operator (IDSO) is an appealing governance model, some state regulators may choose a second path for addressing the utility conflict of incentives: maintaining the utilities’ traditional role in planning and operating the distribution grid, while neutralizing the misalignment by changing utility incentives. Given the near-term focus in many states on retaining the utility’s current role in grid planning and operation, this paper chooses to focus on this path and proposes a model that ensures the utility incentive against non-utility owned assets is neutralized. Proposed Solution In order to ensure least cost/best fit distribution investments in states without an IDSO, this paper proposes the creation of a new utility incentive model, Infrastructure-as-a-Service, which would neutralize the utility incentive to deploy utility-owned infrastructure in lieu of more cost-effective third-party options. This model would enable utility shareholders to derive income from third-party grid services, mitigating the financial impact that may bias utility decision-making. Such a model would help ensure that utilities take full advantage of DER readily being adopted by customers. Infrastructure-as-a-Service Infrastructure-as-a-Service is a regulatory mechanism that would modify the incentives faced by utilities when sourcing solutions to meet grid needs. This new mechanism would allow utilities to earn income, or a rate of return, from the successful provision of grid services from non-utility owned DERs. Infrastructure-as-a-Service facilitates the least cost/best fit development of distribution grids by creating competitive pathways for DERs to defer or replace conventional grid investments, while maintaining equal or superior levels of safety, reliability, resiliency, power quality, and customer satisfaction. As the figure below shows, the three primary steps of a utility distribution planning process (forecast, identify needs and evaluate solutions) remain identical to the current process, followed by the infrastructure-as-a-Service mechanism’s enhancements to sourcing in steps four (select and deploy) and five (operate and collect). 48 Utility Planning and Sourcing Utilizing Infrastructure-as-a-Service Model
  • 20. SolarCity Grid Engineering | www.solarcity.com/gridx | Page 20 Under the proposed approach, after evaluating all feasible technical solutions for a particular grid need, including alternative grid solutions derived from DER portfolios, Infrastructure-as-a-Service would empower distribution planners to select and deploy third-party assets that address the specified need if more cost-effective for ratepayers than conventional solutions. Importantly, Infrastructure-as-a-Service would create an opportunity for utilities to operate and collect streams of service income, or a rate of return, based on the successful deployment of competitively sourced third-party solutions. This service income provides fair compensation for effective administration of third-party contracts that enable alternative resources to deliver grid services, and helps mitigate the structural bias towards utility-owned infrastructure that currently exists under distribution “cost plus” regulation. Note that other mechanisms attempting to achieve a similar utility indifference to DER solutions have been proposed, such as the modified clawback mechanism being discussed in New York. 49 While the clawback mechanism offers the potential to reduce the financial disincentive that utilities face in utilizing DERs, the potential utility upside may be small as compared to the lost opportunity and insufficient to neutralize the utility disincentive. This downside to the clawback mechanism may be overcome via the infrastructure-as-a-service mechanism. Distribution Loading Order Neutralizing the utility disincentive to utilizing DERs is critical but not sufficient to drive transformation in distribution planning. New incentives may be ignored in practice without corresponding changes to long-established and familiar utility processes that have sourced only self-supplied solutions to date. The adoption of a Distribution Loading Order 50 would borrow an existing concept from bulk system procurement policy in California, which prioritizes procurement of preferred resources, including energy efficiency, demand response, and renewable energy, ahead of fossil fuel-based sources. In the distribution context, a Distribution Loading Order prioritizes the utilization of flexible DER portfolios over traditional utility infrastructure, when such portfolios are cost-effective and able to meet grid needs. The table below depicts the types of resources that would be prioritized over traditional investments in such a policy. Distribution Loading Order: Sourcing Solutions In concert with a mechanism like Infrastructure-as-a-Service, a Distribution Loading Order provides the procedural framework for evaluating distribution solutions in order to ensure grid planning is consistent with longer term policy objectives that support environmental, reliability, and customer choice goals. Importantly, a Distribution Loading Order would ensure that DER solutions are properly incorporated into grid planning. However, utilities would always maintain the authority to select and deploy a suitable portfolio of solutions, including conventional solutions when more appropriate, to ensure reliability. For these conventional investments, utilities would continue to earn an authorized rate of return. Benefits of Infrastructure as a Service Creating a pathway for DERs to offer grid services in lieu of utility infrastructure investment would be beneficial for utility ratepayers for a variety of reasons. 1. Saves ratepayers money: Allowing full and fair consideration of DER solutions equips grid planners with a broader suite of tools to meet grid needs, resulting in higher infrastructure utilization and lower customer electricity bills. 2. Promotes competition: Expanding the set of suppliers that are eligible to offer distribution solutions unleashes the power of markets to benefit ratepayers. Well-designed competitive markets can deliver superior solutions that are more affordable than those resulting from a self-supply “cost plus” planning model. 3. Increased flexibility and sources the best solution: Sourcing mechanisms that can deliver resources with new desirable characteristics (e.g. granular sizing, fast lead-times, flexible operational traits) into the distribution planners’ toolbox creates no-regrets flexibility. And by rendering a utility neutral to the choice of ownership structure, the planner can focus on the singular objective of delivering the least-cost, best-fit solution. 4. Encourages innovation: Providing clear market opportunities for third-party solutions promotes product and service innovation, putting the collective innovation capabilities of all market participants and customers to work.
  • 21. SolarCity Grid Engineering | www.solarcity.com/gridx | Page 21 5. Engages customers: Utilizing DERs to provide grid services increases the capability and willingness of individual customers to actively manage their energy profiles. Ultimately, a neutral decision model like Infrastructure-as-a- Service will help foster the transition from passive ratepayers to proactive customers. The CPUC recently enhanced the 2016 scope for its Distribution Resource Plan proceeding to formally consider the utility role, business models, and financial interest with respect to DER deployment. 51 Infrastructure-as-a-service is one mechanism to consider that would reduce the conflict of interest towards third-party services inherent in the utility incentive model today. Alternative efforts, such as creating greater functional independence between ownership and operations, as in an IDSO model, should also be explored. Irrespective of the mechanism, an effort to neutralize the utility decision model is needed to ensure that DERs are fully utilized and valued for grid services. IV. Grid Planning Must be Modernized in Order to Capture DER Benefits A second structural impediment to fully realizing DER benefits is the current grid planning approach, which biases grid design toward traditional infrastructure rather than distributed alternatives, even if distributed solutions better meet grid needs. Outdated planning approaches rely on static assumptions about DER capabilities and focus primarily on mitigating potential DER integration challenges, rather than proactively harnessing these flexible assets. A. Adopt Integrated Distribution Planning Grid planning can be modernized by utilizing an approach to meeting grid needs while at the same time expanding customer choice to utilize DERs to manage their own energy. We call this holistic process Integrated Distribution Planning. Integrated Distribution Planning encourages the incorporation of DERs into every aspect of grid planning. The framework, as depicted in the adjacent figure, expedites DER interconnections, integrates DERs into grid planning, sources DER portfolios to meet grid needs, and ensures data transparency for key planning and grid information. Ultimately, the approach reduces overall system costs, increases grid reliability and resiliency, and fosters customer engagement. If grid planning decisions are made before consideration of customers’ decisions to adopt DERs, – which is frequently the case today – grid investments will underutilize the potential of DERs to provide grid services, ultimately resulting in lower overall system utilization and higher societal costs of the collective grid assets. In contrast, prudent planners who proactively plan for customer adoption of DERs may avoid making unnecessary and redundant grid investments, while also enabling the use of customer DERs to meet additional grid needs. Ultimately, planning processes must ensure that DERs are effectively counted on by grid planners and leveraged by grid operators. For more details on integrated distribution planning, see the “Integrated Distribution Planning” white paper overviewing the framework at www.solarcity.com/gridx. B. Grid Planning Data Must be Transparent and Accessible The first step in grid planning is to identify the underlying grid needs. As discussed throughout this paper, the use of alternative solutions such as DERs should be included in the portfolio of solutions that are considered to meet these grid needs. While utilities could ostensibly assess these alternative solutions within their existing process, opening up the planning process by sharing the underlying grid data would drive increased competition and innovation in both assessing and meeting grid needs. Any concerns from sharing such data – such as customer privacy, security, data quality, and qualified access – can be mitigated through data sharing practices already common in other industries. In fact, stakeholder engagement and access to planning data is already a central tenet in electric transmission planning across the country. The challenges of ushering a new industry norm of data transparency are far outweighed by the potential that broader data access can drive in increased stakeholder engagement and industry competition.
  • 22. SolarCity Grid Engineering | www.solarcity.com/gridx | Page 22 Data transparency efforts should first focus on communicating the exhaustive list of grid needs that utilities already identify in their planning process. While utilities may claim that such needs are already communicated within general rate cases, the information contained in those filings are incomplete. A standard set of comprehensive data should be shared about each grid need and planned investment so that stakeholders can proactively propose and develop innovative solutions to those needs. This proactive data access broadens the set of innovative solutions made available to utilities and guards against an insular approach to deploying grid investments. The table below is an initial set of minimally-required data to foster adequate stakeholder engagement in regards to specific, utility-identified grid needs. Data to Foster Engagement in Grid Needs and Planned Investments While data on specific utility-identified grid needs is critical to assessing innovative solutions in place of traditional investments, underlying grid data should also be made available to foster broader engagement in grid design and operations. Access to underlying grid data allows third parties to improve grid design and operation by proactively identifying and developing solutions to meet grid needs, even before they are identified by utilities. The following data should be made available and kept current by utilities in order to encourage broad engagement in grid design. Data to Foster Engagement in General Grid Design and Optimization
  • 23. SolarCity Grid Engineering | www.solarcity.com/gridx | Page 23 Share Standardized, Machine-Readable Data Sets Data that is made available on grid needs and planned investments is rarely provided in an accessible format. Often, information is provided in the form of photocopied images of spreadsheet tables within utility GRC filings, hardly a format the enables streamlined analysis. This data communication approach requires stakeholders to manually recreate entire data sets into electronic version in order to carry out any meaningful analysis, a time-intensive and needless exercise. Other potential stakeholders never attempt to engage due to the barrier of data access. The use of standard, machine-readable data formats is prevalent in many industries and within the utility industry itself; organizations like the Energy Information Agency (EIA) foster such broad access to electronic, standardized data sets. Distribution grid needs and planned investments should follow suit. To illustrate a potential path forward, below is an example of traditional grid capacity needs and corresponding capacity investments as communicated via PG&E’s 2017 GRC Phase 1 filing; the image of the text file on the right shows how those same grid needs and planned investments could be translated into a machine-readable format. General Rate Case Standard Format Worksheet PDF Text File (e.g. JSON) C. Benefits of Integrated Distribution Planning Opening the door to DER solutions in grid planning provides the obvious benefit of a new suite of technological options for grid planners. In some cases, DERs may simply be lower cost on a $/kW basis or more effective at meeting the identified grid need than the conventional solution, making them an obvious choice. DERs, however, also offer an advantage over convertional options due to their targeted and flexible nature, which fundamentally changes the paradigm of grid planning. Status quo grid planning relies on deploying bulky, traditional infrastructure solutions to address forecasts of incremental, near-term grid needs. In many cases, conventional solutions are 15X larger than the near-term grid need that is driving the actual deployment of the infrastructure. 52 This fundamental reality of grid planning creates two major opportunities for DERs to deliver better value to ratepayers than conventional solutions: 1) utilizing small and targeted solutions, and 2) utilizing the flexibility of DER portfolios. Value of Small & Targeted Solutions in Modern Distribution Planning The first source of value is the result of more incremental and targeted investment, which captures the benefit of time value of money. Bulky utility solutions with long equipment lifetimes present a lumpiness challenge for planners. Needs for new resources are driven at the margin, but the available solutions are only cost-effecive when sized to match their long lifetimes, often resulting in low lifetime utilization rates. The significantly smaller building blocks that modern DERs offer planners effectively overcome this historical problem. The figures below compare the deployment timeline of a traditional bulky solution installed to meet demand growth long in the future, relative to a targeted DER solution deployed in small batches to meet continuous demand growth, and the corresponding expectation of idle capacity over time. 53
  • 24. SolarCity Grid Engineering | www.solarcity.com/gridx | Page 24 Option 1 meets every year’s capacity requirement by deploying large solutions infrequently, whereas Option 2 meets annual needs through smaller and more continuous deployments. While the infrastructure deployed with Option 1 will continue to meet the required planning reserve margins decades into the future, it requires a significant upfront investment. Option 2 targets the near-term required planning reserve margins on a continuous basis. Both options ensure that the planning reserve margin for reliability purposes is met, but Option 1 results in higher idle capacity rates over the lifetime of the infrastructure in aggregate when compared to Option 2. Extending the basic financial idea of the time value of money, paying for capacity today is more expensive than paying for capacity tomorrow – even before considering any cost decreases resulting from technological advancements. DER solutions that can preserve reliability, while delaying capital investments for new capacity until future periods, are inherently valuable to ratepayers. This value driver means that solutions that may look more expensive on a per unit of nameplate capacity basis are actually more cost effective on a net present value basis. Value of Increased Flexibility in Modern Distribution Planning The second source of value to be realized from modernizing planning stems from a related but separate challenge that grid planners face: the risk of suboptimal decisions arising from forecast error. This risk is primarily driven by two dynamics: 1. Long lead times are necessary to deploy traditional infrastructure. 2. Long depreciation lifetimes are allowed by regulators for those assets. As a result, grid planners commonly make investment decisions many years into the uncertain future, and then charge customers for the maintenance, depreciation, profit and taxes associated with those assets over 20 to 30 years or more. Investment under uncertainty imposes risks, which, if not managed properly, create unforeseen ratepayer costs. Among other sources of uncertainty, grid planning and expansion using traditional bulky infrastructure is subject to demand growth uncertainty and technology uncertainty. Both of these forecast errors can be large and expensive. Over-forecasting demand can result in an overbuilt system for which ratepayers must bear the full burden, even if the infrastructure was not needed. Under-forecasting demand can require the installation of suboptimal, expensive patchwork solutions, or threaten reliability if solutions cannot be provided in time. Similarly, on the technology side, inaccurately forecasting the future costs and capabilities of technologies may result in premature obsolescence as technological advancement dramatically reduces equipment costs or increases equipment efficiency. While private firms typically bear these investment risks in other industries, utility ratepayers bear 100% of these forecast error risks in the electric industry unless the utility regulator acts to disallow cost recovery. Due to these risks, DERs with shorter lead times can offer real-option value (ROV) by delaying deployment until forecast uncertainty is smaller, effectively buying time for planners and reducing the probability of a mistake. While the value of real options can be significant, it is difficult to quantify without the requisite data, including historical loading data, historical forecasts, and current long-term project forecasts. These data needs are further elaborated on in the subsequent section.
  • 25. SolarCity Grid Engineering | www.solarcity.com/gridx | Page 25 Policy Considerations The additional sources of value, including time value of money and real option value, associated with a transition towards integrated distribution planning that fully leverages DER deployments were explored above, but are not explicitly quantified due to the limited data publically available. Ongoing proceedings in California, such as the Distribution Resource Plan (DRPs) and Integrated Distributed Energy Resources (IDER), create important vehicles to share information between parties in order to explore these important but less conventional sources of value that are not yet well quantified. V. Conclusion In this report, we explored the capability of distributed energy resources to maximize ratepayer benefits while modernizing the grid. The opportunity associated with proactively leveraging DERs deployed over the next five years is significant, creating $1.4 billion a year by 2020 in net societal benefits across the state of California. Applying the state-wide methodology to a subset of real distribution capacity projects identified in California’s most recent utility General Rate Case yielded similar results, suggesting DERs can cost effectively replace real-world planned distribution capacity projects today. The impediments to capturing these benefits in practice remain significant. Utility incentives must be realigned to ensure that the full potential of DERs can be realized. Shifting the utility’s core financial incentive from its current focus of “build more to profit more” towards a future state where the utility is financially indifferent between sourcing utility-owned and customer-driven solutions would neutralize bias in the utility decision making process. However, modernizing grid planning is also necessary. Grid planning must be updated to incorporate DERs into every aspect of grid planning, and the process itself must become radically more transparent with greater access to and standardization of data. The benefits of achieving these changes would be real – and large. While initially complex to consider, the greater flexibility DERs can provide to grid planners and operators leads to greater reliability and resiliency. Similarly, the more targeted and incremental deployments of DERs can enable more efficient and affordable grids. Most importantly, utilities that can successfully modify planning processes would be able to fully take advantage of the assets their customers chose to adopt. While no single report will adequately address all the issues – engineering, economic, regulatory – that naturally come with a transformative time in the industry, we hope that compiling these issues in one place, even with a high-level focus, advances the discussion and provides an overview of the critical topics for regulators and industry stakeholders to consider when evaluating the full potential of distributed energy resources. About Grid Engineering Solutions Our Grid Engineering Solutions team is leading efforts to make the 21 st century’s distributed grid a reality. At SolarCity, grid engineering is more than understanding how the current power system works and how to interconnect distributed energy resources. It encompasses a cross-functional approach to evaluating engineering, technology, economic, and policy considerations side-by-side. We apply our expertise in power systems engineering, energy economics, and advanced grid technology to unlock innovative solutions that enable the grid of the future. The majority of the Grid Engineering Solutions team members, including the authors of this paper, are former utility engineers, economists, technologists, and policy analysts. We treat the design and operation of the electric grid as a major opportunity to partner across the energy industry, with the aim of driving innovation to benefit consumers and our environment. Collaboration across utilities, grid operators, regulators, national laboratories, philanthropists, environmentalists, distributed energy resource providers, energy service providers, and customers is paramount to meeting the challenge of modernizing our grid. We welcome any dialogue that helps foster the next generation of grid design and operations. For more information, please visit us at www.solarcity.com/gridx or contact us at gridx@solarcity.com.
  • 26. SolarCity Grid Engineering | www.solarcity.com/gridx | Page 26 Appendix 1: Overview of Traditional Avoided Cost Categories and Methodologies The traditional avoided cost categories evaluated in this report are detailed in the following table. Descriptions of the avoided cost, overview of the CPUC Public Tool’s treatment of these avoided costs, and TASC’s adjusted methodologies are provided. The adjusted TASC methodologies are used to quantify the traditional avoided cost values used in this paper. See TASC NEM Successor Tariff filing for more details on quantification approach. 54
  • 27. SolarCity Grid Engineering | www.solarcity.com/gridx | Page 27 Appendix 2: Utility-Proposed Distribution Integration Investments in CA DRP The following table presents the DER integration investment categories as identified in SCE’s DRP filing. SCE’s costs were scaled up to estimate total integration costs for all California utilities over 2016-2020. SCE cost estimates were stated at the category level, and were uniformly spread across the underlying investments. For each investment, applicability to DER integration is assessed using the threshold and screening questions identified in this paper. This quantification is necessarily high-level due to the lack of details provided, and additional details are necessary in order to fully evaluate investment plans.
  • 28. SolarCity Grid Engineering | www.solarcity.com/gridx | Page 28 Endnotes 1 “Transforming America’s Power Industry: The Investment Challenge 2010 – 2030”, Chupka, Earle, Fox-Penner, and Hledik, The Brattle Group (Brattle) for The Edison Foundation (EEI), November 2008 http://www.eei.org/ourissues/finance/Documents/Transforming_Americas_Power_Industry_Exec_Summary.pdf 2 “The Integrated Grid: A Benefit-Cost Framework”, K. Forsten et al., Electric Power Research Institute (EPRI), February 2015 http://www.epri.com/abstracts/Pages/ProductAbstract.aspx?ProductId=000000003002004878 3 Compiled from SNL Energy Data based on US Electric Utility FERC Form 1 filings from 2007-2011 http://www.snl.com/Sectors/Energy/ 4 “Transforming America’s Power Industry: The Investment Challenge 2010 – 2030”, Chupka et al., Brattle for EEI, 2008 5 CA Distribution Resource Plan (DRP) proceeding (http://www.cpuc.ca.gov/General.aspx?id=5071), CA CPUC Integrated Distributed Energy Resources (IDER) proceeding (http://docs.cpuc.ca.gov/PublishedDocs/Efile/G000/M153/K740/153740896.PDF), and NY Reforming the Energy Vision (REV) proceeding (www3.dps.ny.gov/W/PSCWeb.nsf/All/CC4F2EFA3A23551585257DEA007DCFE2?OpenDocument) 6 “A Theory of Incentives in Procurement and Regulation”, Jean-Jacques Laffont and Jean Tirole, MIT Press, 1993 7 “Electric and Gas Utility Cost Report: Public Utilities Code Section 747 Report to the Governor and Legislature”, California Public Utilities Commission, April 2015 http://www.cpuc.ca.gov/WorkArea/DownloadAsset.aspx?id=5650 8 Energy Almanac, California Energy Commission, 2005-2014 http://energyalmanac.ca.gov/electricity/electricity_generation.html 9 “The Economics of Battery Storage”, Rocky Mountain Institute (RMI), October 2015 10 “The Integrated Grid: A Benefit-Cost Framework”, K. Forsten et al., EPRI, February 2015 11 California Public Utility Commission (CPUC) Public Tool/2015 NEM Successor Public Tool, developed by Energy+Environmental Economics (E3) for the CPUC, 2015 (https://www.ethree.com/public_projects/cpucPublicTool.php) Note: SolarCity views the CPUC Public Tool as a useful resource to perform cost/benefit analyses, such as the analysis presented in this paper, in a transparent and publically repeatable manner. However, SolarCity cautions that there are structural flaws and limitations to the Public Tool that result in overstatement of PV and DER adoption and understatement of avoided cost benefits. Therefore, SolarCity does not support the use of the Public Tool in its current form to be the basis of ratemaking or tariff decisions. 12 CPUC Distribution Resources Plan proceeding 13 “A Review of Solar PV Benefit and Cost Studies”, L. Hansen and V. Lacy, RMI, 2013 http://www.rmi.org/Knowledge-Center%2FLibrary%2F2013-13_eLabDERCostValue 14 “A Regulator’s Guidebook: Calculating the Benefits and Costs of Distributed Solar Generation”, RMI for Interstate Renewable Energy Council (IREC), October 2013 www.irecusa.org/a-regulators-guidebook-calculating-the-benefits-and-costs-of-distributed-solar-generation/ 15 “A Review of Solar PV Benefit and Cost Studies”, L. Hansen and V. Lacy, RMI, 2013 16 “The Integrated Grid: A Benefit-Cost Framework”, K. Forsten et al., EPRI, February 2015 17 Ibid 18 “Proposal for AB 327 Successor Tariff of the Alliance for Solar Choice”, The Alliance for Solar Choice (TASC), August 2015 http://docs.cpuc.ca.gov/PublishedDocs/Efile/G000/M154/K226/154226059.PDF 19 “Proposal for AB 327 Successor Tariff of the Alliance for Solar Choice”, TASC, August 2015 20 “Petition to amend final decision to convert generating units to synchronous condensers”, Lee, Edison Mission Huntington Beach, 2012 http://www.energy.ca.gov/sitingcases/huntingtonbeach/compliance/2012-10- 04_Petition_to_Amend_Final_Decision_to_Convert_Generating_Units_to_Synchronous_Condensers_TN-67538.pdf 21 “Quarterly Compliance Report (January 2014) of Southern California Edison Company regarding status of transmission projects and generation interconnection projects”, G. Chen, Southern California Edison (SCE), January 2014 www3.sce.com/sscc/law/dis/dbattach5e.nsf/0/A62A276183AFF26E88257C5A0082E9B9/$FILE/I.00-11-001%20AB970%20- %20SCE%20Quarterly%20Compliance%20Report%20-%20%20January%202014.pdf 22 “Quarterly Compliance Report (April 2013) of Southern California Edison Company (U 338-E) regarding status of transmission projects”, G. Chen, SCE, April 2013 http://www3.sce.com/sscc/law/dis/dbattach5e.nsf/0/1685093939AACD2588257B42006463C7/$FILE/SCE+Quarterly+Compliance+Report+ (April+2013)+Memo.pdf 23 “2012 – 2013 Transmission Plan”, California Independent System Operator (CAISO), March 2013 www.caiso.com/documents/boardapproved2012-2013transmissionplan.pdf 24 “Decision on the 2012/2013 ISO Transmission Plan”, N. Millar, CAISO, March 2013 www.caiso.com/Documents/DecisionISO_2012-2013_TransmissionPlan-Presentation-Mar2013.pdf 25 “2012 Grid Assessment Results”, San Diego Gas & Electric Company (SDG&E), September 2012 www.caiso.com/Documents/SDGE_2012-2013ProposedSolutions.pdf 26 “Sycamore-Penasquitos 230 kV Line Description and Functional Specifications Eligible for Competitive Solicitation”, CAISO, April 2013 www.caiso.com/documents/description-functionalspecificationssycamore-penasquitos230kvline.pdf 27 “Responses to CPUC/BLM Data Request No. SCE-1”, SCE, January 2007 www.cpuc.ca.gov/environment/info/aspen/sunrise/datareqs/sce_dr1_response.pdf
  • 29. SolarCity Grid Engineering | www.solarcity.com/gridx | Page 29 28 SolarCity technical analysis from joint demonstration project with investor-owned utility, December 2015 29 “Payment for Reactive Power”, Commission Staff Report AD14-7, Federal Energy Regulatory Commission, April 2014 30 “Evaluation of Conservation Voltage Reduction on a National Level”, Schneider, Fuller, Tuffner, and Singh, Pacific Northwest National Laboratory (PNNL) for the US Department of Energy (DOE), July 2010 http://www.pnl.gov/main/publications/external/technical_reports/PNNL-19596.pdf 31 Winder, “Transformers: Principles and Applications”, Marcel Dekker, Inc., Basel, Switzerland, 2002, pp. 118-121. 32 IEEE Std. C57.12.00-2000. “IEEE Standard Requirements for Liquid-Immersed Distribution, Power, and Regulating Transformers”, Institute of Electrical and Electronics Engineers, Inc., New York, 2000, pp. 44-48. 33 “Updated Value of Service Reliability Estimates for Electric Utility Customers in the United States”, Sullivan, Schellenberg, and Blundell, Lawrence Berkeley National Laboratory (LBNL), 2015 https://emp.lbl.gov/sites/all/files/value-of-service-reliability-final.pdf.pdf 34 Opinion of the U.S. Supreme Court, FERC v. Electric Power Supply Association et al., January 2016, p. 16 35 “High-Penetration PV Integration Handbook for Distribution Engineers”, NREL, January 2016 http://www.nrel.gov/docs/fy16osti/63114.pdf 36 U.S. Energy Information Agency (EIA), July 2015 preliminary data 37 Levelized costs are based on societal discount rate (CPUC Public Tool default of 5%) and estimates of deprecation life for each DER integration investment type. 38 “Report of Southern California Edison Company (U 338-E) On Renewable Integration Cost Study For 33% Renewables Portfolio Standard”, W. Walsh and C. Schmid-Frazee, SCE, May 2015 http://www3.sce.com/sscc/law/dis/dbattach5e.nsf/0/9ED56ECBA141C78188257E54007CE0F5/$FILE/R.13-12-010_2014%20LTPP- SCE%20Report%20on%20Renewable%20Integration%20Cost%20Study%20for%2033%20Perc%20RPS.pdf 39 “The Economics of Grid Defection”, Figure 19, Battery Price Projections, Creyts and Guccione et al., RMI, February 2014 http://www.rmi.org/cms/Download.aspx?id=10994&file=RMIGridDefectionFull_2014-05.pdf 40 This approach allows capital investments, variable costs, and benefits to be considered through a single metric, avoiding the analytical error of comparing the costs and benefits with different useful lives in without any normalization. 41 “Electric and Gas Utility Cost Report: Public Utilities Code Section 747 Report to the Governor and Legislature”, CPUC, April 2015 42 CPUC Public Tool/2015 NEM Successor Public Tool, Revenue Requirement Module, Reference Case Forecast 2013-2050, developed by E3 for the CPUC, 2015 43 Pacific Gas and Electric only provides project-level information for distribution capacity projects exceeding $3 million. Investment in smaller distribution capacity projects is incorporated into the broader distribution budget, but is not broken out in any detail. 44 This calculation reflects a 25-year useful life of assets and ratebase depreciation schedule with an authorized WACC of 7.8% and corporate tax rate of 42%. Property taxes are omitted. Project expenses are based on the O&M share of PG&E’s 2014 distribution revenue requirement (41%), but revised down to a 30% ratio acknowledging that a portion of O&M is fixed O&M as opposed to variable O&M. CPUC Public Tool’s default value for the societal discount rate of 5% is used to calculate societal net present cost. 45 PG&E’s 2017 General Rate Case; Chapter 13, Electric Distribution Capacity; Forecast Capital Expenditures – Projects Detail, Workpaper Table 13-11 46 PG&E NEM Successor Tariff Filing. The compiled input scenarios are available on the CPUC’s website at the following at http://cpuc.ca.gov/General.aspx?id=5818 47 “…we do conclude that opportunities for undue discrimination continue to exist that may not be remedied adequately by functional unbundling.” FERC Order 2000, page 65 https://www.ferc.gov/legal/maj-ord-reg/land-docs/RM99-2A.pdf 48 See additional details on Integrated Distribution Planning at www.solarcity.com/gridx 49 “Staff White Paper on Ratemaking and Utility Business Models”, State of New York Department of Public Services, July 2015, pp. 40-44 50 See additional details on Integrated Distribution Planning at www.solarcity.com/gridx 51 CPUC Scoping Memo on Distribution Resource Plans, Track III, January 2016 http://docs.cpuc.ca.gov/PublishedDocs/Efile/G000/M157/K902/157902794.PDF 52 According to PG&E’s 2017 GRC Workpaper 13-11, 1,400 MWs of capacity expansions could be linked to 114MW of deficiency. 53 For a more complete discussion on these concepts, please see RMI’s book, “Small is Profitable: The Hidden Economic Benefits of Making Electrical Resources the Right Size”, A. Lovins, RMI, 2002 54 “Proposal for AB 327 Successor Tariff of the Alliance for Solar Choice”, TASC, August 2015