1. Lesson Plan in Mathematics
Grade 5
Grade V – Acacia (7:50-8:50)
Molave (8:50-9:50)
I. Learning Objectives
Cognitive: Read and interpret data presented on a line graph
Psychomotor: Construct a line graph
Affective: give accurate interpretation of data
II. Learning Content
Skills: Reading and interpreting data presented on a line graph
Reference: BEC-PELC III.D.2.1 Mathematics 5: Mathematics for the Better
Future,Coronel and Bamba, pp. 268-269
Materials: PPT presentation of line graphs
Value: Accuracy
III. Learning Experiences
A. Preparatory Activities
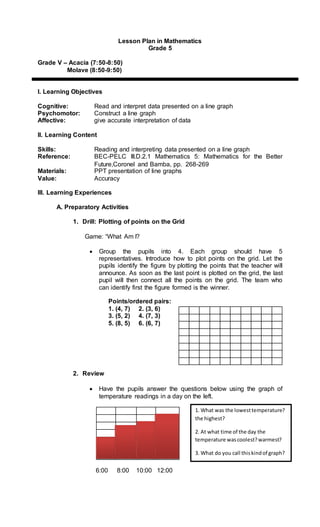
1. Drill: Plotting of points on the Grid
Game: “What Am I?
Group the pupils into 4. Each group should have 5
representatives. Introduce how to plot points on the grid. Let the
pupils identify the figure by plotting the points that the teacher will
announce. As soon as the last point is plotted on the grid, the last
pupil will then connect all the points on the grid. The team who
can identify first the figure formed is the winner.
Points/ordered pairs:
1. (4, 7) 2. (3, 6)
3. (5, 2) 4. (7, 3)
5. (8, 5) 6. (6, 7)
2. Review
Have the pupils answer the questions below using the graph of
temperature readings in a day on the left.
6:00 8:00 10:00 12:00
1. What was the lowesttemperature?
the highest?
2. At what time of the day the
temperature wascoolest?warmest?
3. What do you call thiskindof graph?
2. 3. Motivation
Ask the pupils: Do you see any graph on your school bulletin
board? What information does the graph give?
B. Developmental Activities
1. Presentation
Activity: “Data Gathering”
Using the format below. Have the pupils gather data about the
pupil’s favourite fruits. Let them make their own graph out of the
data that they have gathered. Have them report their work.
Pupil’s favourite Fruits
Fruits
Number of Pupils
Male Female Total
Mango
Orange
Apple
Rambutan
Avocado
2. Fixing Skills
A. Let the pupils answer the questions in the box using the graph.
Harry’s Average Weight
(2001-2008)
2001 2002 2003 2004 2005 2006 2007 2008
YEAR
A
V
E
R
A
G
E
W
E
I
G
H
T
(In kg)
Questions:
1. What was Harry’s average weight in 2005?
2. What is the title of the graph?
3. What is the scale used?
4. In what year did Harry weigh the heaviest? the lightest?
5. What is the average weight of Harry from year 2001 to 2008?
3. 3. Generalization
Ask the pupils:
What is a graph? A line graph?
Why are line graphs useful?
How do you interpret data presented in a line graph?
4. Application
1. Have the pupils answer the following questions using the graph
below.
Carlo’s Weight for 6 months
40
38
36
3
34
32
30
May June July Aug Sept Oct
1. During what month did Carlo gain weight the most/the least?
2. In what month did Carlo lose weight?
3. How many kilograms did Carlo weigh in September?
4. How much more is the weight of Carlo in the month October than
the month of May?
5. How much less is the weight of Carlo in the month of July than
September?
IV. Evaluation
(5 points) Make a Line Graph for a given data and answer the following
questions.
Year Number of Pupils
2003
2004
2005
2006
2007
400
550
700
850
1000
K
I
L
O
G
R
A
M
4. 1. What year has the greatest number of enrolees?
2. What is the title of the graph?
3. How much less is the number of enrolees in the year 2006 than in the
year 2007?
4. How much more is the number of enrolees in the year 2006 than in the
year 0f 2003?
5. How much less is the total number of enrolees in the year 2003 and
2004 than in the year of 2007?
6. (5 points) What is the average number of enrolees in UES from the
year 2003 to 2007?
V. Assignment
a) Draw a bar graph for a given data. 10 pts.
Number of seedlings planted by Boy Scouts
Prepared by:
RENEL R. SITON
Intern
Checked:
LYNARD BOBBY L. ASIRIT
Critic Teacher
Seedling Number of seedlings planted
Mango
Banana
Avocado
Rambutan
Papaya
60
35
18
40
25