
Recommended
Recommended
More Related Content
What's hot
What's hot (18)
Similar to F041033947
Similar to F041033947 (20)
More from IOSR-JEN
Recently uploaded
Recently uploaded (20)
F041033947
- 1. IOSR Journal of Engineering (IOSRJEN) www.iosrjen.org ISSN (e): 2250-3021, ISSN (p): 2278-8719 Vol. 04, Issue 10 (October. 2014), ||V3|| PP 39-47 International organization of Scientific Research 39 | P a g e Electrochemical Deposition of Lead Dioxide Nanostructured Thin Films B. B. Li*a, M. Brachetb, R. Ghasemic, C. F. de Souzaa, A. Hughesd and H. E. Rudaa a Centre for Advanced Nanotechnology, University of Toronto, Toronto, ON M5S 3E3, Canada b CNRS-IMN Site de la Chantrerie, Physique des Matériaux et Nanostructures, Rue Christian Pauc, BP50609, France c Faculty of Electrical and Computer Engineering, University of Toronto, 10 King's College Rd., Toronto, ON M5S 3G4, Canada d Xogen Technologies Inc. 40 Centennial Road, Orangeville, ON L9W 3T4, Canada Abstract: - We report on the preparation of lead oxides nanostructured thin films by anodic and cathodic electrochemical deposition. The films were prepared using an aqueous electrolyte composed of lead chloride and nitric acid, without any catalyst. A controlled potential was applied through the electrolyte to deposit the lead oxide on gold coated silicon and on titanium foil. The formation of lead oxide nanostructures was strongly influenced by the applied potential, deposition temperature and solution pH. The role of these parameters on the synthesis of nanostructured lead dioxide was studied in detail, and enabled the determination of the optimal conditions for the fabrication of nanostructured lead dioxide thin films suitable for wastewater treatment. Keywords: - Electrochemical deposition, Nanostructured lead dioxide, Electrode, Wastewater treatment. I. INTRODUCTION Industrialization has inevitably led to increased discharges of toxic and recalcitrant organic compounds into the environment, producing environmental contamination and severe threats to human health. Identifying effective wastewater treatment methods is a very important and current need. Electrochemical oxidation is a promising technique that can be used for the electrochemical incineration of wastewaters, and has been intensively studied recently1-8. One of the most important requirements for electrochemical oxidation is finding a suitable electrode material. The oxygen evolution overpotential values for some of the most widely used anode materials are 1.3 V for Pt, 1.6 V for IrO2, 1.9 V for SnO2 and PbO2, and 2.7 V for boron doped diamond (BDD)9. BDD is thus the best choice for anode material, owing to its higher overpotential. However, the material is very expensive. On the other hand, although PbO2 and SnO2 have somewhat lower oxygen overpotentials, they are significantly less expensive, making them more attractive to industrial application. PbO2 is an excellent material having high electrical conductivity, high oxygen overpotential and good chemical stability in corrosive media, while being of relatively low cost compared with noble metals and BDD anodes. In fact, PbO2 is commonly used in lead acid batteries10-12, oxidation of organic compounds in wastewater13-15, oxidation of phenol16, and ozone production17. The properties of lead dioxide are highly dependent on the method used for its synthesis which, in turn, affects the structure, morphology and phase composition. PbO2 submicrometer-sized hollow spheres and microtubes18, nanotubes19, porous electrodes20, nanosheets, scrolled nanotubes, nanorods21, and thin films22 have been synthesized by applying different synthesis routes. These include hydrothermal growth, thermal evaporation, anodic co-deposition, and electrodeposition. Although there have been numerous publications concerned with the electrochemical synthesis of lead oxide, in this paper, we present a systematic study focusing on the mechanism for control over structure, morphology, and the phases of PbO2 formed. We present an anodic electrochemical deposition method to fabricate lead dioxide nanostructured thin films. Similar to our previous study of electrochemically deposited vertically-aligned ZnO nanowires23, an in-depth study of the role of the main parameters in nanostructured lead oxide electrochemical deposition, under both cathodic and anodic conditions is presented. Five main parameters (i.e., applied potential, pH of electrolyte, deposition temperature, growth time, and working electrode material) are discussed as they influence the formation and growth of lead dioxide by anodic deposition. In addition, we discuss the influence of reactant concentrations, applied potential, and deposition temperature on the formation of nanostructured lead oxide under the cathodic conditions. This work provides a controllable and simple approach for the preparation of lead dioxide nanostructures without recourse to sophisticated techniques or catalysts. We achieve this by modification of the main deposition parameters.
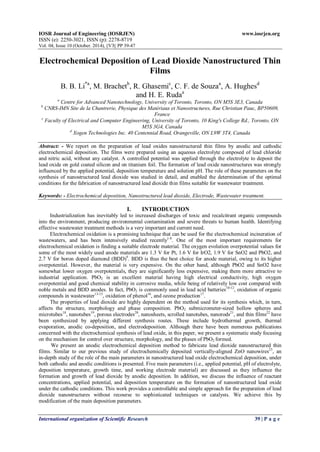
- 2. Electrochemical Deposition of Lead Dioxide Nanostructured Thin Films International organization of Scientific Research 40 | P a g e II. EXPERIMENTAL 2.1. Materials and Equipment All materials used, including titanium foil (99.7%, metals basis), gold wire (99.999%, metals basis) and titanium (99.99%) wire, were supplied by Alfa Aesar. All chemicals used as reactant source materials, including lead chloride (PbCl2, 99.999%, metals basis) and nitric acid (HNO3, 68%), were supplied by Alfa Aesar. Ultrapure water (17.6 cm) was freshly obtained by using our purification system and used to prepare the electrolyte. A three electrode cell was used to conduct deposition experiments. Two Pt wires were wound to form two disks, and used as the counter and reference electrodes, respectively. Pt wire is a satisfactory reference electrode in various electrochemical systems such as aqueous, non-aqueous, gel or frozen electrolyte and for measurements under high temperature27. The working electrode was connected to the substrate - namely, a Au/Ti/Si wafer or a Ti foil that was considered as an option for lower cost substrates to be used in industry. The potential was supplied using a Potentiostat / Galvanostat Model 263A (Princeton Applied Research) controlled by a computer. The temperature of the solution was controlled by a SCILOGEX MS-H-Pro hotplate. The phases of the as-prepared samples were identified using a Philips Powder Diffractometer PW1830, with Cu Κα1 radiation (1.54051 Å) operated at 40 kV and 40 mA. Morphological studies of as-prepared samples were conducted using a Field Emission Scanning Electron Microscope (FE-SEM) (Hitachi S-5200) with Energy Dispersive X-ray (EDX) analysis. 2.2 Procedures The lead dioxide was electrochemically deposited on two kinds of substrates - namely, titanium foil with a thickness of 32 μm and silicon wafers coated with a titanium film (5 nm) and a gold film (100 nm thick). The titanium and gold films were both prepared by physical vapor deposition. The titanium film (5 nm thick) was evaporated prior to the gold film forming Au/Ti/Si structures. The titanium film was added to enhance adhesion of the gold film to the silicon substrate. To facilitate studying the electrochemical reactions, the solution was kept at the same concentration of source materials in all experiments: i.e., PbCl2 with 5 mM and HNO3 with 14 mM. The separation between counter electrode and reference electrode was maintained at 2 cm, while the distance between reference electrode and the working electrode was 1 cm. Prior to deposition, the substrates were cleaned using acetone, methanol, and ultrapure water for 5 minutes at 80℃. The solution for each experiment was made freshly and oxygen bubbled for 30 minutes at room temperature. The pH value was measured before O2 bubbling. The electrolyte pH was adjusted through the addition of NaOH to the wanted value. The deposition was initiated when the electrolyte temperature reached a stable target temperature. In other words, when the expected temperature was reached and remained stable, the potential was then applied. The potential between reference electrode and working electrode was measured and controlled. When the deposition process was terminated, the substrate was washed by repeated immersion in the ultrapure water and dried on the hotplate at around 100℃ for a few minutes. III. RESULTS AND DISCUSSION It is well known that the main parameters used for electrochemical deposition, including the applied potential, electrolyte temperature and solution pH, can influence the morphology, structure, and even phase formation. In this work, two groups of synthesis-namely, anodic and cathodic deposition were conducted and the results are discussed separately. Based on our studies, PbO2 nanostructures on Au coated substrates could be synthesized with HNO3 and PbCl2 as reactants only by anodic deposition. By contrast, under cathodic deposition, lead oxides with various stoichiometries and crystal structures could be obtained, that is, PbO (dimorphous), Pb3O4 (monoclinic), Pb2O3 (triclinic) and Pb5O8 (tetragonal). 3.1. Formation of PbO2 Nanostructures on Au by Anodic Deposition In Fig. 1, SEM images of PbO2 synthesized by anodic electrochemical deposition on Au/Ti/Si substrates are shown. The applied potential, deposition time and solution pH were 1.3 V, 9 minutes and ~2.0 respectively, and the concentration of source materials, HNO3 and PbCl2, were 14 mM and 5 mM, respectively. Figs. 1(a) and 1(b) are top and cross-sectional SEM images, respectively, for growth at room temperature. Figs. 1(c) and 1(d) are top and cross-sectional SEM images, respectively, for growth at 60 °C. Comparing the two groups of SEM images, it can be seen that the rate of deposition increases as the deposition temperature goes up. The inset images in Fig. 1(a), show the details of the structures at a higher magnification where clusters formation is clearly visible. PbO2 growth occurs in a fractal fashion with successive nucleation and growth occurring upon existing larger nuclei. Also, there appears to be a preferred orientation for growth. PbO2 nanoparticles self assemble into complex shapes resulting in a very rough surface with high specific surface area. The nano-particles are on the order of a few nanometers in diameter, while larger clusters are about 100 nm to 500
- 3. Electrochemical Deposition of Lead Dioxide Nanostructured Thin Films International organization of Scientific Research 41 | P a g e nm in diameter with heights of about 300 nm to 700 nm, as seen in the image of Fig. 1(a) and 1(b). The height of the larger clusters increases with increasing deposition temperature, showing a preferentially faster growth rate along the normal to the substrate as compared with the transverse rate. c d a b 20 nm Fig. 1. SEM images of PbO2 anodically deposited on Au/Ti/Si substrate. The potential applied was 1.3 V, deposition time was 8.8 minutes, solution pH was ~2.0, and concentration of HNO3 and PbCl2, was 14 mM and 5mM, respectively. (a) and (b) are top and cross-sectional SEM images, respectively, of deposition at room temperature. (c) and (d) are top and cross-sectional SEM images, respectively, of deposition at 60oC.The small inset image shows details of PbO2 nanostructures. Fig. 2 shows current density versus deposition time curves at two different deposition temperatures. In the two experiments, the pH of solution (~2), voltage applied (1.3V) and concentration of reactants (HNO3 and PbCl2 was 14 mM and 5 mM, respectively) were held constant. From Fig. 2, it can be seen that the current density for the deposition at 60°C increased much faster in the first 2.5 minutes of deposition and that its magnitude was far higher when compared with that performed at room temperature. It confirms that the deposition temperature influences the concentration of ions (Pb2+, H+, Cl-, and OH-) in the electrolytic part of the circuit, and therefore affects the deposition of PbO2. Overall, the deposition rate is much higher at high deposition temperatures, as confirmed by the SEM images shown in Fig. 2. 0 1 2 3 4 5 6 0 5 10 15 20 25 60oC Current density (mA/cm2) Deposition time (minute) 25oC Fig. 2. Current density vs deposition time at different deposition temperatures. The deposition temperatures, with magenta line were at 60oC, red line at room temperature.
- 4. Electrochemical Deposition of Lead Dioxide Nanostructured Thin Films International organization of Scientific Research 42 | P a g e We observed that the solution pH also influences the rate of deposition. In Fig. 3, SEM images of PbO2 deposited using different pH values, 1.19 (Fig. 3(a)) and 4.85 (Fig. 3(b)), respectively, are shown. Here, the potential applied and deposition time of growth was 1.3V and 8.5 minutes for Fig. 3(a), and 0.9V and 5.8 minutes for Fig. 3(b), respectively. The applied potential supplied causes electromigration of ions and electrons. Logically, for higher applied potential, the deposition rate should be higher. In addition, longer deposition times should result in more deposited material. Interestingly, using a lower potential and shorter deposition time for the growth in an electrolyte with higher pH value of 4.85, (Fig. 3(b)) yields a higher deposition rate than that obtained with lower pH. This reveals that the deposition rate clearly increases with increasing pH (toward neutral). Fig. 3. SEM images of PbO2 anodically deposited on Au for two different pH value electrolytes. The concentration of reactants and the deposition temperature are the same for both experiments. The varied parameters of deposition: (a), electrolyte pH is 1.19, the applied potential is 1.3V and the deposition time is 8.5 minutes; (b), electrolyte pH is 4.85, the applied potential is 0.9V and the deposition time is 5.8. In order to explain the influence of solution pH on PbO2 deposition rate, the following reactions for electrochemical deposition are considered28. H O OH H e 2 ads [1] 2 2 PbO OH Pb(OH ) ads [2] Pb OH H O Pb OH H e 2 2 2 2 ( ) ( ) [3] Pb(OH) PbO 2H 2 2 2 [4] In all cases, in strong or weak acidic solutions, the first step is the production of adsorbed OH species, OHads, from H2O (Eq. 1), mainly depending on the applied potential. Then oxidation and electrochemical reaction processes occur favoring Pb(III) species over to Pb(II) (Eq. 2), followed by Pb(III), and Pb(IV) (Eq. 3), until finally PbO2 is nucleated on the substrate (Eq. 4). It is clear from Eqs. (1), (3) and (4) that H+ ions play an important role during the PbO2 formation process. In more acidic solutions, the concentration of H+ is higher and thus the reactions of Eqs. (1), (3) and (4) are retarded. When the solution pH is higher, or the acid is weaker, the H+ concentration decreases and, consequently, the oxidation rate is higher. Therefore, the deposition rate for PbO2 increases when the solution pH increases in the acidic range. In other words, as OH- concentration increases, the reaction is prompted. The morphologies depended on the deposition parameters, such as potential applied, deposition temperature, reactant concentration and electrolyte pH. Nanostructure formation occurs under certain deposition conditions. If the applied potential and deposition temperature are sufficiently high, exceeding critical values, a high density of charged carriers is created in the electrolyte and their migration toward substrate is too fast, and there is insufficient time for high quality deposition on the substrate. 3.2. PbO2 Nanostructures Formed on Ti Foil using Anodic Deposition Top view SEM images of PbO2 anodically deposited on Ti foil surface are shown in Fig. 4. The deposition time was 30 min, and the concentrations of source materials, HNO3 and PbCl2, were 14 mM and 5mM, respectively. Different values for the applied potential were used: 1.1V for Fig. 4(a), 1.0V for Fig. 4(b), and 0.9V for Fig. 4(c), respectively. It can be seen that the preferred orientation growth becomes more marked as the applied potential decreases. Similar to the effect of growth temperature, higher applied potential causes faster a b
- 5. Electrochemical Deposition of Lead Dioxide Nanostructured Thin Films International organization of Scientific Research 43 | P a g e transport of ions toward to the substrate. When applied potential is higher, the driving force for ion transport is enhanced. Then, the ions or charged carriers, Pb2+, Pb(OH)2+ and 2 2 Pb(OH ) , as the predominant species, move toward the working electrode faster. Under conditions for rapid nucleation or deposition, there is insufficient time for nanoparticle self-assembly into well ordered structures. On the other hand, with lower deposition rates, characteristic of lower potential growth, the PbO2 deposits are comprised of self-assembled nanowires (Fig. 4(c)) packed preferentially with the C-axis of PbO2 cell perpendicular to the substrate plane. Fig. 4. Top view SEM images (500K) of anodically deposited PbO2, with the same reactant concentrations, pH of 1.8, at room temperature, for 30 minutes and with different applied potential. (a) 1.1V, (b) 1.0V and (c) 0.9V, respectively. Fig. 5 shows top and cross-sectional SEM images of PbO2 anodically deposited on Ti foil surface of two samples. In these depositions, two conditions were kept the same: 30 minutes for deposition time, and source material concentrations, HNO3 and PbCl2, were 14 mM and 5mM, respectively. Sample a, in Figs. 5(a1), (a2) and (a3), was synthesized at 25 oC, with an applied potential of 0.9 V and sample b, in Figs. 5(b1), (b2) and (b3), was synthesized at 45 oC, with an applied potential of 1.1 V. From these images we observe that for the PbO2 deposited at 45oC, the sample consists of polyhedral structures, comprised of nanoparticles with sectional dimensions around 10-20 nm while the PbO2 grown at room temperature is mostly formed by hierarchical structures comprised of nanospheres of densely packed thin nanorods with diameters around 10 nm. Fig. 5. SEM images of top and cross-section view of PbO2 anodically deposited on the surface of Ti foil. The deposition time was 30 minutes and the concentration of HNO3 and PbCl2, was 14 mM and 5mM, respectively. (a1) is a cross-sectional image and (a2) and (a3) are SEM top view images, under high magnification, deposited at room temperature, with an applied potential of 0.9V. (b1) is a low magnification SEM cross-sectional view image while (b2) and (b3) are high magnification SEM top view images, deposited at 45 ℃, with an applied potential of 1.1 V. a b c
- 6. Electrochemical Deposition of Lead Dioxide Nanostructured Thin Films International organization of Scientific Research 44 | P a g e From these results, it is clear that under lower deposition temperature and lower applied potential, the deposition appears to favor preferred growth along the C-axis of PhO2 cell as the nanorods of the tetragonal structure of PbO2. This hierarchical structure markedly increases the specific surface area and was considered as a strong candidate to provide high efficiency for electrolysis of organic pollutants in wastewater treatment. On the other hand, higher deposition temperatures (45oC) densify the assembly of nanoparticles along the C-axis of PhO2 cell. Hence, there is a difference in the specific surface area between the two morphologies – namely, the bundle branches of tetrahedral structures obtained at 45oC, in Fig. 5(b1) and the hierarchical nanospheres of nanorods obtained at 25oC, in Fig. 5(a2). Because the specific surface area of the nanostructures is expected to influence the efficiency of electro-oxidation in wastewater treatment, the most favorable deposition parameters for optimal morphology of the film should able be found. Comparing the SEM images of Fig. 1 and Fig. 5, we can see how diverse the morphology of PbO2 for different working electrode materials. 3.3. X-Ray Diffraction Characteristics of Anodically Deposited PbO2 Nanostructures on Au and Ti Foils PbO2 has two major polymorphs, namely, alpha (α) and beta (β), which occur naturally as the minerals scrutinyite and plattnerite, respectively. The α form has orthorhombic symmetry while the β form is tetragonal. In fact the composition, structure and morphology of electrochemically deposited PbO2 depends on many parameters, including the substrate used, electrolyte, pH, and deposition conditions9, 29, 30. Some groups report that β-PbO2 can be grown in acidic solution while α-PbO2 is deposited in alkaline solution31, 32. In the lead nitrate acid electrolyte reactor reported herein, with pH of 1.8, and substrates of Au and Ti, lead dioxide is deposited as the β-PbO2 phase agreeing with the references. Typical X-ray diffraction (XRD) patterns are shown in Fig. 6. Spectra 6(a) and 6(b) are XRD patterns of the samples synthesized on Ti foil. The spectrum in Fig. 6(c) is for a sample deposited on Au film. Both of them are the β phase. In Table 1, the relative intensity of the four main characteristic peaks of β-PbO2 for Figs. 6(a), 6(b), 6(c) and beta PbO2 quoted from JCPDS card 05-0680 are shown. Considering potential applied and deposition temperature, the morphology of 6(a) should be trending to the nanorods, see Fig. 5(a2), whereas 6(b) to the nanopolyhedral, see Fig. 5(b2). 25 30 35 40 45 50 0 100 200 300 400 500 600 (211) (200) (101) (110) c b Ti Au a Intensity (a.u.) 2Degree PbO 2 Fig. 6. XRD spectra of anodically deposited PbO2. (a) and (b) are XRD patterns of PbO2 deposited on Ti foil and (c) is the XRD pattern of PbO2 on Au film. The parameters are as follows: deposition temperature, 25oC, 45oC and 60oC; potential applied, 0.9V, 1.1V and 0.9V; growth time, 30 min, 30 min, and 5.8 min. They correspond to samples shown in Figs. (a), (b) and (c), respectively. ■ marks PbO2 specific peaks, ▲ marks Au peak, and ^ marks Ti peak. Table 1. Relative intensity of four main characteristic peaks of β-PbO2 spectra quoted from Fig. 6. Spectrum Temperature Potential Relative intensity of characteristic peak (oC) (V) 110 101 200 211 6(a) 25 0.9 63 100 16 34 6(b) 45 1.1 65 100 30 40 6(c) 60 0.9 48 100 14 30 PbO2 JCPDS: 5-0680 100 100 28 100
- 7. Electrochemical Deposition of Lead Dioxide Nanostructured Thin Films International organization of Scientific Research 45 | P a g e The texture coefficient (TC) is a parameter used to estimate the predominance of crystal planes in any structure and is calculated using the formula33. n N n hkl hkl hkl hkl hkl I I I I TC 1 ( ) 0( ) 1 ( ) 0( ) ( ) ( ) / / where I(hkl) and I0(hkl) are the obtained and standard intensity values of the hkl plane, respectively and N is the number of available diffraction peaks in the XRD profile. TC(hkl) values obtained from the spectra seen in Figs. 6(a), 6(b) and 6(c) are shown in Fig. 7. From the TC(hkl) values in Fig. 7, it is revealed that sample 6(a) shows a predominance of the planes (110), while, in the case of sample 6(b), the results shows a preferential growth along (200) direction that is confirmed by morphology seen in SEM images (Fig.5). Sample 6(c) shows a preferential growth along (110) direction too. 6(a) 6(b) 6(c) 0.4 0.6 0.8 1.0 1.2 1.4 1.6 1.8 Texture Coefficient Samples (101) (110) (200) (211) Fig. 7. Texture coefficient of PbO2 anodically deposited. 6(a) and 6(b) are the PbO2 deposited on Ti foil and (c) is PbO2 on Au film. Calculations based on relative intensity of four main characteristic peaks of PbO2 spectra quoted from Fig. 6 or Table 1. 3.4. The PbO2 Nanostructures on Au Films using Cathodic Deposition Lead oxide can occur with many different stoichiometries such as PbO2, Pb5O8, Pb12O19, Pb12O17, Pb3O4 and PbO. Lead oxide in different phases with various morphologies can be easily obtained by cathodic deposition depending on the parameters or deposition conditions. In this work, several parameters such as the deposition temperature, applied potential and concentration of source materials were studied in detail. In Fig. 8, SEM images for cathodic deposition of lead oxide on Au/Ti/Si wafer, at 60℃, deposition time for 1 hour, with three groups varying concentrations of nitric acid and lead chloride, and applied voltage, are shown. Group 1: [HNO3]=75 mM and [PbCl2]=30 mM, with applied potential, -9V and -10V, are shown in Figs. 8(a) and 8(b), respectively; Group 2: [HNO3]=80 mM and [PbCl2]=30 mM, with applied potential, -3V and -10V, can be seen in Figs. 8(c) and 8(d), respectively; and Group 3: [HNO3]=80 mM and [PbCl2]=15 mM, with applied potential, -5V and -10V, are displayed in Figs. 8(e) and 8(f), respectively. It is clearly seen that the applied potential can significantly influence the morphology and phase during cathodic deposition of lead oxide. By comparing the images related to each group, Figs. 8(a) and 8(b), 8(c) and 8(d) or 8(e) and 8(f), it seems that for a higher cathodic potential, larger needle-like crystals, with stronger preferential growth are formed. Additionally, in our cathodic deposition no lead dioxide nanostructures were deposited. This can be explained using the Pourbaix diagram of Fig. 934. When the applied potential is negative, e.g. with cathodic deposition, PbO2 can not be synthesized. In the current case, the pH of the solution lay in the range of 1.3 to 1.9. In PbCl2 aqueous solutions, lead exists in the ionic form Pb2+, so the oxidation reactions (see Eqs. (2), (3) and (4)) are blocked. This indicates that the reactions represented by Eqs. (2), (3) and (4) can only occur under positive potential.
- 8. Electrochemical Deposition of Lead Dioxide Nanostructured Thin Films International organization of Scientific Research 46 | P a g e Fig. 8. SEM images of lead oxide synthesized by cathodic deposition on Au/Ti/Si wafers, at 60oC, for 1 hour. (a) and (b): [HNO3]=75 mM, [PbCl2]=30 mM with applied potential of -9V and -10V, respectively. (c) and (d): [HNO3]=80 mM, [PbCl2]=30 mM with applied potential of -3V and -10V, respectively. (e) and (f): [HNO3]=80 mM, [PbCl2]=15 mM with applied potential of -5V and -10V, respectively. Fig. 9. Pourbaix diagram (potential – pH) for aqueous solutions of lead.
- 9. Electrochemical Deposition of Lead Dioxide Nanostructured Thin Films International organization of Scientific Research 47 | P a g e IV. CONCLUSIONS In conclusion, lead dioxide nanostructures, β-PbO2, with tetragonal crystal system were successfully synthesized on both gold films and titanium foil using anodic electrochemical deposition in acidic electrolytes. The deposition rate increases with lower electrolyte acidity. Higher deposition temperature enhances the PbO2 deposition rate and strongly affects the morphology of the PbO2 nanostructures. At room temperature, the deposited films consisted of hill-like structures. At higher temperature (45oC), the film morphology changes to pillar-like with nano-trenches of square cross-section. Using different deposition parameters, such as applied potential, deposition temperature, and concentration of reactants, under anodic deposition, the PbO2 morphology changes but the phase structure remains the same. Through a proper selection of applied potential and deposition temperature, one can favor a preferred orientation of growth along the C axis. However, using cathodic deposition, lead dioxide could not be obtained under any of the conditions used, as confirmed from the XRD results. Regarding lead oxide, it was synthesized in different morphologies, nanostructures and even phases under cathodic deposition. V. ACKNOWLEDGEMENTS The authors would like to thank Ilya Gourevich for assisting in scanning electron microscopy. Funding for this work was provided by NSERC, CSA, OCE and ORF. REFERENCES [1] F. Montilla, P. A. Michaud, E. Morallon, J. L. Vazquez, C. Comninellis, Electrochimica Acta 47, 3509 (Aug 15, 2002). [2] A. Medel, E. Bustos, K. Esquivel, L. A. Godinez, Y. Meas, International Journal of Photoenergy, (2012). [3] Y. Hou, J. Qu, X. Zhao, H. Liu, Journal of Environmental Sciences-China 21, 1321 (2009). [4] Y. Lei et al., Environmental Science & Technology 44, 7921 (Oct 15, 2010). [5] P. Perret, T. Brousse, D. Belanger, D. Guay, Journal of the Electrochemical Society 156, A645 (2009). [6] R. Inguanta, E. Rinaldo, S. Piazza, C. Sunseri, Electrochemical and Solid State Letters 13, K1 (2010). [7] P. Perret, Z. Khani, T. Brousse, D. Belanger, D. Guay, Electrochimica Acta 56, 8122 (Oct 1, 2011). [8] R. Inguanta, E. Rinaldo, S. Piazza, C. Sunseri, Journal of Solid State Electrochemistry 16, 3939 (Dec, 2012). [9] Guohua Chen and Yung-Tse Hung, Handbook of environmental engineering, Volume 5. Totowa, N.J. : Humana Press, 83 (2007) . [10] I. Petersson, B. Berghult, E. Ahlberg, Journal of Power Sources 74, 68 (Jul 15, 1998). [11] H. Karami, M. Shamsipur, S. Ghasemi, M. F. Mousavi, Journal of Power Sources 164, 896 (Feb 10, 2007). [12] M. Ghaemi, E. Ghafouri, J. Neshati, Journal of Power Sources 157, 550 (Jun 19, 2006). [13] D. C. Johnson, J. Feng, L. L. Houk, Electrochimica Acta 46, 323 (Nov 1, 2000). [14] K. T. Kawagoe, D. C. Johnson, Journal of the Electrochemical Society 141, 3404 (Dec, 1994). [15] C. Bock, B. MacDougall, Journal of the Electrochemical Society 146, 2925 (Aug, 1999). [16] S. Y. Ai, M. N. Gao, W. Zhang, Z. D. Sun, L. T. Jin, Electroanalysis 15, 1403 (Sep, 2003). [17] R. Amadelli et al., Electrochimica Acta 45, 713 (1999). [18] G. C. Xi et al., Inorganic Chemistry Communications 7, 607 (May, 2004). [19] J. S. Lee, S. K. Sim, K. H. Kim, K. Cho, S. Kim, Materials Science and Engineering B-Solid State Materials for Advanced Technology 122, 85 (Sep 15, 2005). [20] U. Casellato, S. Cattarin, M. Musiani, Electrochimica Acta 48, 3991 (Nov 30, 2003). [21] L. Shi, Y. Xu, Q. Li, Crystal Growth & Design 8, 3521 (Oct, 2008). [22] T. Mahalingam et al., Materials Characterization 58, 817 (Aug-Sep, 2007). [23] David R. Lide, CRC Handbook of Chemistry and Physics: 71st ed, CRC Press, Vancouver, WA, USA, (1991). [24] Richard S. Kelly, The Journal of the Analytical Sciences Digital Library, Courseware 10057 (2009). [25] Adrian W. Bott, Current Separations, 14:2, 64-68 (1995). [26] K. K. Kasem, S. Jones, Platinum Metals Review 52, 100 (Apr, 2008). [27] R. Inguanta, S. Piazza, C. Sunseri, Journal of the Electrochemical Society 155, K205 (2008). [28] A. B. Velichenko et al., Journal of the Electrochemical Society 149, C445 (Sep, 2002). [29] D. Devilliers, B. Devos, H. Groult, Journal of New Materials for Electrochemical Systems 10, 187 (Jul, 2007). [30] H. P. Chang, D. C. Johnson, Journal of the Electrochemical Society 136, 17 (Jan, 1989). [31] J. Lee, H. Varela, S. Uhm, Y. Tak, Electrochemistry Communications 2, 646 (Sep, 2000). [32] K. Ravichandran, K. Thirumurugan, N. J. Begum, S. Snega, Superlattices and Microstructures 60, 327 (Aug, 2013). [33] M. Pourbaix, Atlas of electrochemical equilibria in aqueous solutions, Pergamon Press, (1966).