Cutting Parameter Optimization for Surface Finish and Hole Accuracy in Drilling Of EN-31
•
1 recomendación•166 vistas

This document describes a study that used Taguchi's design of experiments methodology to optimize cutting parameters for surface finish and hole accuracy in drilling of EN-31 material. Experiments were conducted varying speed, feed rate, drill depth, and tool type. Response variables of surface roughness and hole diameter error were measured. Analysis of variance and regression analysis were used to determine the significant factors and develop models. For surface finish, speed of 30m/min, feed of 0.2mm/rev, and HSS tool were found to be optimal. For hole accuracy, optimal settings were 30m/min speed, 0.2mm/rev feed, HSS+TiN tool, and 20mm drill depth.

Recomendados
Recomendados
Más contenido relacionado
La actualidad más candente
La actualidad más candente (17)
Destacado
Destacado (20)
Similar a Cutting Parameter Optimization for Surface Finish and Hole Accuracy in Drilling Of EN-31
Similar a Cutting Parameter Optimization for Surface Finish and Hole Accuracy in Drilling Of EN-31 (20)
Más de IOSR Journals
Último
Último (20)
Cutting Parameter Optimization for Surface Finish and Hole Accuracy in Drilling Of EN-31
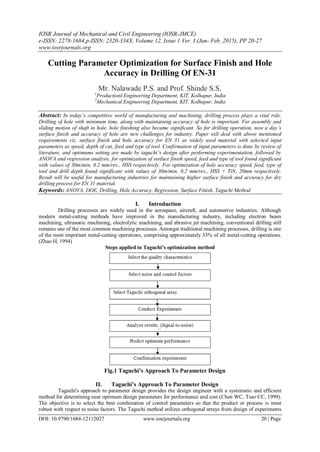
- 1. IOSR Journal of Mechanical and Civil Engineering (IOSR-JMCE) e-ISSN: 2278-1684,p-ISSN: 2320-334X, Volume 12, Issue 1 Ver. I (Jan- Feb. 2015), PP 20-27 www.iosrjournals.org DOI: 10.9790/1684-12112027 www.iosrjournals.org 20 | Page Cutting Parameter Optimization for Surface Finish and Hole Accuracy in Drilling Of EN-31 Mr. Nalawade P.S. and Prof. Shinde S.S. 1 Productionl Engineering Department, KIT, Kolhapur, India 2 Mechanical Engineering Department, KIT, Kolhapur, India Abstract: In today’s competitive world of manufacturing and machining, drilling process plays a vital role. Drilling of hole with minimum time, along with maintaining accuracy of hole is important. For assembly and sliding motion of shaft in hole, hole finishing also became significant. So for drilling operation, now a day’s surface finish and accuracy of hole are new challenges for industry. Paper will deal with above mentioned requirements viz. surface finish and hole accuracy for EN 31 as widely used material with selected input parameters as speed, depth of cut, feed and type of tool. Confirmation of input parameters is done by review of literature, and optimums setting are made by taguchi’s design after performing experimentation, followed by ANOVA and regression analysis, for optimization of surface finish speed, feed and type of tool found significant with values of 30m/min, 0.2 mm/rev., HSS respectively. For optimization of hole accuracy speed, feed, type of tool and drill depth found significant with values of 30m/min, 0.2 mm/rev., HSS + TiN, 20mm respectively. Result will be useful for manufacturing industries for maintaining higher surface finish and accuracy for dry drilling process for EN 31 material. Keywords: ANOVA, DOE, Drilling, Hole Accuracy, Regression, Surface Finish, Taguchi Method I. Introduction Drilling processes are widely used in the aerospace, aircraft, and automotive industries. Although modern metal-cutting methods have improved in the manufacturing industry, including electron beam machining, ultrasonic machining, electrolytic machining, and abrasive jet machining, conventional drilling still remains one of the most common machining processes. Amongst traditional machining processes, drilling is one of the most important metal-cutting operations, comprising approximately 33% of all metal-cutting operations. (Zhao H, 1994) Steps applied in Taguchi’s optimization method Fig.1 Taguchi’s Approach To Parameter Design II. Taguchi’s Approach To Parameter Design Taguchi's approach to parameter design provides the design engineer with a systematic and efficient method for determining near optimum design parameters for performance and cost (Chen WC, Tsao CC, 1999). The objective is to select the best combination of control parameters so that the product or process is most robust with respect to noise factors. The Taguchi method utilizes orthogonal arrays from design of experiments
- 2. Cutting Parameter Optimization for Surface Finish and Hole Accuracy in Drilling of EN 31 DOI: 10.9790/1684-12112027 www.iosrjournals.org 21 | Page theory to study a large number of variables with a small number of experiments. Using orthogonal arrays significantly reduces the number of experimental configurations to be studied. Furthermore, the conclusions drawn from small scale experiments are valid over the entire experimental region spanned by the control factors and settings (Dasch JM et al., 2010) 2.1 Orthogonal Arrays: These are not unique to Taguchi. They were discovered considerably earlier However, Taguchi has simplified their use by providing tabulated sets of standard orthogonal arrays and corresponding linear graphs to fit specific projects (Pirtini M, Lazoglu I, 2005) 2.2Linear Graphs: Linear graphs are simple tools for the allocation of effects (main effects and interactions) to the columns of an orthogonal array. A linear graph consists of dots, lines and numbers. A dot represents a main effect; a line between two dots represents the interaction between the two connected main effects (dots). Each of the dots and lines is numbered, the numbers representing the columns of the orthogonal array (Phadke, 1989). 2.3Signal-to-Noise Ratio: Asignal-to-noise (S/N) ratio is a performance measure, which estimates the effect of the noise factors on the quality characteristic. For each of the three optimization goals a S/N ratio has been developed. These S/N ratios are proposed to provide a product design that simultaneously places the response on a target and a minimum variance (Yang JL, Chen JC, 2001). III. Experimental Work Taguchi methods which combine the experiment design theory and the quality loss function concept have been used in developing robust designs of products and processes and in solving some taxing problems of manufacturing (Furness RJ, 1996). The ranges of cutting parameters are selected based on the tool manufacturer’s recommendation and industrial applications. 3.1 Drilling Tools and Work Piece Material: In this study, drilling tests were performed using 10 mm diameter, HSS twist uncoated drills, HSS TiAlN-coated drills, and HSS TiN-coated drills. Table 3 shows the dimensional properties of the drilling tools. The work piece material was EN31, which is extensively used in the manufacturing industry. 3.1.1 Dimensional Properties of Cutting Tool: The dimensional properties of the cutting tool plays very important role in drilling process which are mentioned in the following Table no.1 Table 1: Dimensional properties of cutting tool Drill 1 2 3 Too Diameter 10 mm 10 mm 10 mm Flute 2 flute 2 flute 2 flute Point Angle 118 118 118 Helix Angle 30 30 30 Flute Angle 87 87 87 Shank Type Cylindrical Cylindrical Cylindrical Coating Uncoated TiAlN TiN 3.2 Surface Finish: For optimizqtion of surface finish parameters, with reference to duscussion with expert and from literatute, we have selected 3 parameters viz. Cutting Speed, Feed rate and type of tool with 3 levels as shown infollowing table. We will set smaller is better for optimization of setting of parameters for achieving higher surface finish. 3.2.1 Levels of parameters for surface finish: By taking the opinion from experts in academic and industry and also after intense literature review the input parameters and their levels are selected which are given in the following Table no. 2 For 3 factors and 3 levels we have to conduct 3^3=27 experiments. To avoid this, by using orthogonal array for 3 factors and 3 levels, we will use L9 orthogonal array, so that we will need to do 9 experiments only.
- 3. Cutting Parameter Optimization for Surface Finish and Hole Accuracy in Drilling of EN 31 DOI: 10.9790/1684-12112027 www.iosrjournals.org 22 | Page Table No2: Levels of parameters for surface finish Parameter Level 1 Level 2 Level 3 Cutting Speed(m/min) 30 40 50 Feed Rate(mm/min) 0.2 0.3 0.4 Type of tool HSS+TiN HSS+TiAlN HSS (uncoated) 3.2.2 Surface Finish Values with S/N Ratio: After performing above mentioned experiments with mentioned levels, following surface finish values are obtained which are tabulated below in Table no.3. Table No3: Surface Finish Values with S/N Ratio Experiment No. (A) Feed rate (mm/min) (B) Cutting speed (m/min (C) Drilling tool Surface finish value (μm) S/N Ratio 1 1 1 1 5.72 -15.1479 2 1 2 2 5.56 -14.9015 3 1 3 3 3.64 -11.222 4 2 1 3 5.94 -15.4757 5 2 2 2 5.22 -14.3534 6 2 3 1 7.48 -17.478 7 3 1 3 5.16 -14.253 8 3 2 1 7.32 -17.2902 9 3 3 2 7.76 -17.7972 3.3 Hole Acuuracy: For 4 factors and 3 levels we have to conduct 3^4=81 experiments. To avoid this, by using orthogonal array for 3 factors and 4 levels, we will use mix L18 orthogonal array, so that we will need to do 18 experiments only for hole accuracy. 3.3.1 Selection of factors and their levels for hole accuracy: For optimizqtion of surface finish parameters, with reference to duscussion with expert and from literatute , we have selected 4 parameters viz. Cutting Speed, Feed Rate ,Type of Tool & Drilling Depth with 3 levels as shown infollowing Table no. 4. Table No 4: Selection of factors and their levels for hole accuracy Parameter Level 1 Level 2 Level 3 Cutting Speed ( m/min) 30 40 50 Feed Rate(mm/min) 0.2 0.3 0.4 Type of tool HSS+TiN HSS+TiAlN HSS (uncoated) Drill Depth (or mm) 15 20 - Table No 5: Hole diametral error values with S/N Ratio Experiment No. Drill Depth (mm) Feed Rate(mm/min) Cutting Speed ( m/min) Type of tool Hole diametral error value (μm) S/N Ratio 1 1 1 1 1 42.47 -32.5616 2 1 1 2 2 52.90 -34.4691 3 1 1 3 3 51.62 -34.2564 4 1 2 1 1 52.90 -34.4691 5 1 2 2 2 68.72 -36.7417 6 1 2 3 3 72.38 -37.1924 7 1 3 1 2 84.10 -38.4959 8 1 3 2 3 80.72 -38.1396 9 1 3 3 1 104.70 -40.3989 10 2 1 1 3 40.16 -32.0759 11 2 1 2 1 37.20 -31.4109 12 2 1 3 2 51.48 -34.2328 13 2 2 1 2 56.88 -35.0992 14 2 2 2 3 58.70 -35.3728 15 2 2 3 1 58.60 -35.358 16 2 3 1 3 70.66 -36.9835 17 2 3 2 1 79.20 -37.9745 18 2 3 3 2 68.40 -36.7011
- 4. Cutting Parameter Optimization for Surface Finish and Hole Accuracy in Drilling of EN 31 DOI: 10.9790/1684-12112027 www.iosrjournals.org 23 | Page 3.3.2 Hole diametral error values with S/N Ratio: After performing above mentioned experiments with mentioned levels, following hole diametral error values are obtained which are given with their S/N ratio in Table no. 5. IV. Analysis Of Experimental Work 4.1 Response Table for Surface Finish: After performing 9 experiments for surface finish, following table gives optimum setting for achieving higher surface finish value and the optimum values of the various parameters are given in the Table no.6. Table No 6: Response Table for Surface Finish Levels (A) Feed rate (mm/min) (B) Cutting speed (m/min) (C) Drilling tool 1 4.97333* 5.6067* 6.84 2 6.21333 6.0333 6.4200 3 6.74667 6.29333 4.67333* Δmax-min (Delta) 1.77333 0.68667 2.16667 Rank 2 3 1 4.2 Graphical Representation of Effect of Drilling Parameter on Surface Finish (SN Ratio): Following graphs gives additional information with confirmation for setting of optimum values and effect of each parameter on surface finish. As we expect S/N ratio value should be higher, we can predict setting level for surface finish from following graph as Feed rate - setting at Level 1 Cutting Speed - setting at Level 1 Type of Tool - setting at Level 3 Fig.: 2 Graph 1: Effect of drilling parameter on Surface Finish (S/N Ratio) 4.3 Response table for hole diametral error: After performing 18 experiments for hole diametral error, following table gives optimum setting for achieving lower hole diametral error and the optimum values of the various parameters are given in the following Table no.7 Table No7: Response table for hole diametral error Levels (D) Drill Depth ( mm) (A) Feed rate (mm/min) (B) Cutting speed (m/min) (C) Drilling tool 1 67.8344 45.9717* 57.8617* 62.5117* 2 57.9200* 61.3633 62.9067 63.7467 3 - 81.2967 67.8633 62.373 Δ(max-min) Delta) 9.9144 35.3250 10.0017 1.3733 Rank 3 1 2 4 4.4 Graphical representation of Effect of drilling parameter on hole diametral error (SN Ratio): Following graphs gives additional information with confirmation for setting of optimum values and effect of each parameter on hole diametral error. As we expect S/N ratio value should be higher, we can predict setting level for Hole accuracy from following graph as
- 5. Cutting Parameter Optimization for Surface Finish and Hole Accuracy in Drilling of EN 31 DOI: 10.9790/1684-12112027 www.iosrjournals.org 24 | Page Feed rate – setting at Level 1 Cutting Speed - setting at Level 1 Type of Tool - setting at Level 1 Drill Depth- setting at Level 2 Fig. 3: Effect of drilling parameter on hole diametral error (S/N Ratio). 4.5 Regression Analysis: The cutting speed, feed rate, drilling depth, and drilling tool were considered in the development of mathematical models for the hole diameter accuracy, while cutting speed, feed rate, and drilling tool for surface finish. The correlation between factors (cutting speed, feed rate, drilling depth, and drilling tool) and hole diameter accuracy for dry drilling conditions on the EN31 alloy were obtained by multiple linear regression. A linear polynomial model is developed to control whether the hole diameter accuracy and surface finish data represent a fitness characteristic as below: Hole diameter accuracy HDA=b0+b1 (drilling depth) +b2f+b3Vc++b4 (drilling tool) + ε Surface finish value (Ra) = b0+b1f+b2Vc+b3d+ ε Where b1, b2, b3, and b4 are estimates of the process parameters and ε is the error. The standard commercial statistical software package MINITAB was used to derive the models of the form: - For hole diameter accuracy: HDA=f (drilling depth, f, Vc, drilling tool) - For the surface finish value: Ra=f (f, Vc, drilling tool) Where the drilling depth is in mm, f=feed rate in mm/min, Vc=cutting speed in rev/min, and the drilling tools are uncoated, TiAlN, and TiN-coated). The models obtained are as follows: Surface Finish = 4.43 + 8.87 f + 0.0188 Vc - 0.932 drilling tool ……………………….. (Eq.1) R-Sq = 84.0% Hole Diameter Error = 32.6 - 9.91 dd + 17.7 f + 5.00 Vc - 0.07 drilling tool …………..... (Eq.2) R-Sq = 87.6% 4.6 Analysis of Variance (ANOVA) 4.6.1 Analysis of variance (ANOVA) results for the whole diametral error for the drilling: The depth of drilling and feed rate factors present statistical and physical significance on the hole diameter accuracy value, because the test F>Fα=5%, as shown in Table no. 8. The P-value reports the significance level (suitable and unsuitable) in Table 8. Percent (%) is defined as the significance rate of the process parameters on the hole diameter accuracy. The percent numbers depict that the depth of drilling, feed rate and cutting speed have significant effects on the hole diameter accuracy. It can observed from Table 14 that the depth of drilling (A), feed rate (B), cutting speed (C), and drill tool affect the hole diameter accuracy by 8.64%, 73.53%, 5.86%, and 0.13% in the dry drilling.
- 6. Cutting Parameter Optimization for Surface Finish and Hole Accuracy in Drilling of EN 31 DOI: 10.9790/1684-12112027 www.iosrjournals.org 25 | Page Table No 8 : (ANOVA) results for the hole diametral error for the drilling Source DF Seq. SS Adj. SS Adj. MS F P % Depth of cut 1 442.33 442.33 442.33 7.30 0.022 8.64 Feed Rate 2 3764.19 3764.19 1882.10 31.08 0.000 73.53 Cutting 2 300.11 300.11 150.05 2.48 0.134 5.86 Drilling 2 6.86 6.86 3.43 0.06 0.945 0.13 Error 10 605.64 605.64 60.56 11.83 Total 17 5119.13 The F-ratio corresponding to the 95% confidence level in the calculation of the process parameters accurately is F0.05, 1, 17=4.451 for the depth of drilling parameter (A) and F0.05, 2, 17=3.592 for the feed rate (B), cutting speed (C), and drill tools (D). The depth of drilling and feed rate factors present statistical and physical significance on the hole diameter accuracy value, because the test F>Fα=5%, as shown Table 14. 4.6.2 Analysis of variance (ANOVA) results for the hole surface finish: The F-ratio corresponding to the 95% confidence level in the calculation of the process parameters accurately is F0.05, 2, 8=4.459. The feed rate and different drill tool factors present statistical and physical significance on the surface finish, because the test F>Fα=5%, as shown in Table no. 9. Table No9 : (ANOVA) results for the hole surface finish Source DF Seq. SS Adj. SS Adj. MS F P % Feed Rate 2 4.9668 4.9668 2.4834 8.63 0.104 35.01 Cutting 2 0.7212 0.7212 0.3606 1.25 0.444 5.08 Drilling 2 7.9217 7.9217 3.9608 13.76 0.068 55.84 Error 2 0.5756 0.5756 0.2878 4.05 Total 8 14.1852 P-value reports the significance level (suitable and unsuitable) in Table 15. Percent (%) is defined as the significance rate of the process parameters on the surface finish values. The percent numbers depict that the cutting speed and drill tool factors have significant effects on the surface finish. It can observed from Table 17 that the feed rate (A),cutting speed (B), and drill tool (C) affect the surface finish value by 35.01%, 5.08%, and 55.84% in the drilling, respectively. The F-ratio corresponding to the 95% confidence level in the calculation of the process parameters accurately is F0.05, 2, 8=4.459. The feed rate and different drill tool factors present statistical and physical significance on the surface finish, because the test F>Fα=5%, as shown in Table 15. V. Confirmation Of Experiment 5.1 Confirmation Test: The experimental confirmation test is the final step in verifying the results drawn based on Taguchi’s design approach. The optimal conditions are set for the significant factors (the insignificant factors are set at economic levels) and a selected number of experiments are run under specified cutting conditions. The average of the results from the confirmation experiment is compared with the predicted average based on the parameters and levels tested. The confirmation experiment is a crucial step and is highly recommended by Taguchi to verify the experimental results. In this study, a confirmation experiment was conducted by utilizing the levels of the optimal process parameters (A1B1C3) for surface finish and (A2B1C1D2) for the hole diameter accuracy value in the dry drilling. 5.2 Determination of Minimum Ra and Diametral Error: Using the aforementioned data, one can predict the optimum surface finish and minimum hole diametral error value performance using the cutting parameters as follows. For the diametral error: Predicted mean (min diametral error) =A1+B1+C1+D2-3(Y) =45.9717+57.8617+62.5117+57.9200- 3(62.87) =35.65μm Similarly, the maximum S/N ratio is calculated to determine whether or not the minimum surface finish is acceptable.
- 7. Cutting Parameter Optimization for Surface Finish and Hole Accuracy in Drilling of EN 31 DOI: 10.9790/1684-12112027 www.iosrjournals.org 26 | Page Also, the maximum S/N ratio for the diametral error varies in the range (−40.39 dB) < (−32.56 dB) < (+∞ dB). The S/ N ratio could be predicted as: Predicted S/N ratio ðmax: ηA1+ ηB1+ ηC1+ ηD2- 3ðη = -35.023-33.167-34.9475-35.3621-3(-35.6629) =-31.51dB Where η is the average value of the hole diametral error or S/N ratio. With this prediction, one could conclude that the machine creates the optimal hole diameter accuracy (HDA= 35.65 μm) within the range of specified cutting conditions. For the surface finish: Predicted mean min: Ra A1 + B1 + C3 - 2Y = 4.97333+5.6067+4.67333-2(5.97) =3.31μm Similarly, the maximum S/N ratio is calculated to determine whether or not the minimum surface finish is acceptable. Also, the maximum S/N ratio for the surface finish varies in the range Ra= ((−17.7972 dB) < (−11.222dB) < (+∞ dB). The S/N ratio could be predicted as: Predicted S/N ratio max: ηA1+ ηB1+ ηC3- 2ðη -13.757-14.958-13.65-(2-15.32) =-11.725dB VI. Result 6.1 Results of the confirmation experiment for surface finish: After performing an experiment and doing the calculations the results are obtained in which the predicted and confirmed values of surface finish have been compared as shown in following Table no.10 and obtained results are with input parameters as cutting speed, feed, type of tool with corresponding levels to achieve higher surface finish. Table No 10 : confirmation experiment for surface finish. Optimal Machining Parameters Predicted Confirmation Level A1B1C3 A1B1C3 Ra ( Micron) 3.31 3.4 S/N Ratio for Ra -11.725dB -11.52dB 6.2 Results of the confirmation experiment for hole diameter accuracy: After performing an experiment and doing the calculations the results are obtained in which the predicted and confirmed values of hole diametral error have been compared as shown in following Table no.11 and obtained results are with input parameters as cutting speed, feed, type of tool and drill depth with corresponding levels to achieve higher surface finish. Table No 11 : confirmation experiment for hole diameter accuracy Optimal Machining Parameters Predicted Confirmation Level A1B1C1D2 A1B1C1D2 Dia. Error 35.65μm 35.42μm S/N Ratio for Dia. Error -31.51dB -31.34dB VII. Conclusions This study has discussed an application of the Taguchi method for investigating the effects of cutting parameters on the surface finish and hole diameter accuracy values in the dry drilling. In the drilling process, the parameters were selected taking into consideration of manufacturer and industrial requirements. The obtained optimal parameters have been used in drilling processes by the manufacturer. From the analysis of the results in the drilling process using the conceptual signal-to-noise (S/N) ratio approach, regression analysis, analysis of variance (ANOVA), and Taguchi’s optimization method, the following can be concluded from the present study:
- 8. Cutting Parameter Optimization for Surface Finish and Hole Accuracy in Drilling of EN 31 DOI: 10.9790/1684-12112027 www.iosrjournals.org 27 | Page For Surface Finish For Hole Accuracy Input Parameter Level (Setting Value) Cutting Speed 1 (30 m/min) Feed 1 (0.2 mm/min) Type of Tool 3 (HSS Un Coated) References [1]. Chen WC, Tsao CC (1999) Cutting performance of different coated twist drills. J Mater Process Technol 88:203–207 [2]. Dasch JM, Ang CC, Wong CA, Cheng YT, Weiner AM, Lev LC (2006) A comparison of five categories of carbon-based tool coatings for dry drilling of aluminum. Surf Coat Technol200:2970–2977 [3]. Pirtini M, Lazoglu I (2005) Forces and hole quality in drilling. IntJ Mach Tools Manuf 45:1271–1281 [4]. Phadke MS (1989) Quality engineering using robust design. Prentice-Hill, Englewood Cliffs, NJ [5]. Yang JL, Chen JC (2001) A systematic approach for identifying optimum surface roughness performance in end-milling operations.J IndTechnol 17:1–8 [6]. Zhao H (1994) Predictive models for forces, power and holeoversize in drilling operations. PhD thesis, University of Melbourne, Australia Input Parameter Level (Setting Value) Cutting Speed 1 (30 m/min) Feed 1 (0.2mm /min) Type of Tool 1 (HSS+ TIN) Drill Depth 2(20 mm)