SlideShare a Scribd company logo
1 of 6
Download to read offline
IOSR Journal of Mechanical and Civil Engineering (IOSR-JMCE)
e-ISSN: 2278-1684,p-ISSN: 2320-334X, Volume 12, Issue 1 Ver. I (Jan- Feb. 2015), PP 14-19
www.iosrjournals.org
DOI: 10.9790/1684-12111419 www.iosrjournals.org 14 | Page
The Effect of Imbalance on the Performance of Unpaced
Production Line – A Mathematical Modeling Approach
M.T. Jamali1
, Mohd. Ziaulhaq2
, Dr. A. Suhail3
, Mohammad Khalid4
1
Lecturer in Industrial Engineering, KingKhalid University, K.S.A.
2
Asst. Prof. in Mechanical Engineering, AIET, Lucknow, India.
3
Professors, in Mechanical Engineering, Aligarh Muslim University, Aligarh. India.
4
Lecturer in Mechanical Engineering, Polytechnic, Aligarh Muslim University, Aligarh India.
Abstract: In this study a five station unpaced production line with Exponentially distributed operation time
with no buffer capacities is consider. A practical situation where five operation times are to be assigned on five
station is investigated. Assuming that precedence restriction are minimal the operation can be permitted on
stations. A number of data set with different kind of imbalance and with different degree of imbalance have been
used for arriving at important conclusions. Operations on the production rate of the line is studied.This result in
60 different assignment operation on stations. The effect of such ordering on production rate is studied by
calculating the percent improvement in production rate that is possible by following the best assignment over
that with worst assignment. It is seen that the effect is highly significant at moderate degree of imbalance.
Keywords: Unpaced Production/Assembly line, Production rate, degree of imbalance, five station
Notation
Xi = Mean operation time chosen on station i, where i = 1, 2, 3, 4, 5
μi = Mean operation time assigned on station i, where i = 1, 2, 3, 4,5
D = Degree of imbalance = (Xmax – Xmin)
R = Production rate
RH = Best Production rate
RL = Worst Production rate
E = Percentage difference between best & worst Production rate
Δ = small time interval
Pij = steady state probability at any station, where i, j = 1, 2, 3,
Pij(t) = transient state probability at any station where i, j = 1, 2, 3
Pijklm = steady state probability at any station where i, j, k, l, m = 1, 2, 3
Pijklm(t)= transient state probability at any station where i, j, k, l, m = 1, 2, 3
αi = Mean operation rate of station i, where i = 1, 2, 3, 4, 5
I. Introduction
An unpaced Production line consists of a series of workstations arranged in work sequence. There may
or may not be buffer space of limited capacities between workstation. The raw job enters the first station and
passes from station to station till the work is completed on the last station. On each station the assigned task is
completed and the job is passed on the next buffer if there is space available. In case no buffer space, the job is
passed on the next station, provided the station is free Fig.1
Fig.1. structure for the unpaced Production line
Several researchers on unpaced production line, Hiller & Boiling (1966) showed that unpaced line,
with exponentially distributed operation line, deliberately unbalanced in a particular way gave production rate
that was higher than then balanced line.They show that if end station were assigned work loads requiring higher
The Effect of Imbalance on the Performance of unpaced production line…
DOI: 10.9790/1684-12111419 www.iosrjournals.org 15 | Page
mean operation time and central stations were assigned work loads requiring less operation time the production
rate may be improved over that of the balanced line. They called it bow phenomenon. EL – Rayah (1979)
Proved that this is fact was true. Several researches on unpaced production line to find efficiency of balanced
line or to find the unbalancing strategy to achieve maximum production rate.
These researchers are Yamashina and Okamura (1983), Hillier & so (1993), Pike & martin 1994,
Akbay (1996).
In the present study attempt has been made to determine, whether a particular order of stations is better
than another ordering of station, if station workload remains fixed and unbalanced.
The study has been carried out on a 5 – station unpaced Production line. The station times are assumed
to be exponentially distributed due to ease of mathematical modeling. There are no buffer capacities in between
the station. A work piece can leave the line only from the last station and that no work piece can move backward
in the line. Processing times are independent across the workstation.
II. Problem Formulation & Methodology
A hypothetical process to be completed on a five station unpaced production line has to be broken into
5 operation each to be performed on a station. A data set
X= {X1, X2, X3, X4, X5} is chosen mean operation time and the values are assigned to stations.
Xi, i= 1,2,3,4,5 is arranged in ascending order, the sum of all Xi„s being equal to 5 & μi, i=1,2,3,4,5 is
the mean operation time assign on station i.
D is Degree of Imbalance is the difference between highest mean operation time and lowest
mean operation time irrespective of which stations have been assigned to mathematically D= Xmax –
Xmin.
μi represents ordering permuted by computer program such as
μ1 = X1, μ2 = X2 , μ3 = X3, μ4 = X4, μ5 = X5
μ1 = X1, μ2 = X2 , μ3 = X3, μ4 = X5, μ5 = X4
………………
Each ordering has a mirror image also and since the production rate is forward and reverse direction is
same, there are actually 60 orderings in all. For the same degree of imbalance irrespective of ordering the
production rate has been obtained.
The effect of imbalance is to find the effect of ordering on the percentage difference (E) between best
(RH) and worst production rate RL.
The percentage difference E is then calculated as
E = (RH-RL) *100 / RL
Where RH = best Production rate
RL = Worst Production rate
The value of E will be used to convince that ordering of task results in significant difference in
production rate and substantial improvement in line performance can be achieved by judicially selecting the
ordering of tasks.
III. Mathematical Modeling
Before the development of model following assumption have been made
(a) There are always jobs available for the first station so that first station is never starved
(b) There is always space available after the last station so that the last station is never blocked.
(c) All operation times are exponentially distributed
(d) There are no buffer space between stations
(e) The system reaches a steady state of statistical equilibrium after sometime, and the interest in this study lies
in steady state only.
(f) The time required for the transfer of the job in between the station is negligible.
Exponential distribution property is known as forgetfulness or lack of memory. Let us define an event
to be the completion of processing of work piece on a station. Than it states that on a particular station of the
production line, process on a work piece begins at time „t0‟ then at any time t, the probability that the process on
that work piece will end during a small time interval Δ, where Δ is very small, is independent of the magnitude
of (t-t0). Let probability density function (pdf) of an exponential distribution is
f(t) = α e-α t
; t ≥ 0 ………………….(i)
This equation represent an exponential distribution with a mean of 1/ α time unit.
Where α is operation rate at the station; which means that on an average α work piece are processed on
the station per unit time. The probability that an operation at this station will end in a small interval Δ is equal to
The Effect of Imbalance on the Performance of unpaced production line…
DOI: 10.9790/1684-12111419 www.iosrjournals.org 16 | Page
α Δ irrespective of times elapsed since its beginning. Similarly the probability that the operation at that station
will not end in time interval Δ is equal to ( 1- α Δ).
Since each station may be in one of the three states, namely working, starved or blocked. These states
are coded as follows.
1- starved
2- blocked
3- working
System states are formed by combining station states and the probability of various system states are
determined by forming probability equations.
Since model of 5 -station line consist of large number of system states and equation, the whole procedure of
modeling is described with the help of a 2-station line.
III.A. Development Of A Model For 2 – Station Line
Let
ij – system state where i is the state of station 1 and j is the state of station 2, i= 1,2,3 j = 1,2,3 station state
dPij(t) / dt --- first derivative of Pij (t) with respect to t.
αi = Mean operation rate of station i, αi = 1/ μi
the total system states that can be formed with two station can be given as
11, 12 , 13, 21 ,22 , 23 , 31 , 32 , 33 using assumption only valid states are
23, 31 , 33
since Δ is very small, the usual assumption that two or more events cannot occurs during Δ is taken here as well.
Let us see how can the probability that, at time (t+Δ), the system is in state 23 be found out. This can occur if.
Either
The system was in state 23 at time t AND nothing changed during Δ
OR
The system was in state 33 at time t AND the first station completed its operation during Δ
The above can be written in the form of state transition in the following way
To 23 FROM 23/X 33/1
Where the notation ij/K represents that the system was in state ij at time t AND Δ station K completed its
operation. The notation ij/x denotes that the system was in state ij at time „t‟ AND nothing changed during Δ
Similar argument may be given to arrive at various system state at time (t+ Δ). All system state transition for a
two station line are shown in table1.
Table :1
TO FROM
23
31
33
23/X
31/X
33/X
33/1
33/2
33/2 33/1
The following three equation6
can now be written for Pij(t+ Δ) for all system states.
P23(t+ Δ) = P23 (t) (1- α 2 Δ) + P33 (t) α 1Δ (1- α 2 Δ)………………(ii)
P31(t+ Δ) = P31 (t) (1- α 1 Δ) + P33 (t)α2Δ (1- α 1 Δ)………………(iii)
P33(t+ Δ) = P33 (t) (1- α 1 Δ) (1- α 2 Δ) + P23 (t) α 2Δ +P31 (t) α 1 Δ…..(iv)
Ignoring higher power of Δ and recalling the fact that
dPij (t) / dt = lim Δ 0 [ Pij (t+Δ) – Pij(t)] / Δ ……………..(v)
The equation (ii) to (iv) can be arranged to give three differential equation as follows
dP23 (t) / dt = - α 2 P23 (t) + α 1 P33 (t) ……………..(vi)
dP31 (t) / dt = - α 1 P31 (t) + α 2 P33 (t) ……………..(vii)
dP33 (t) / dt = - (α 1 + α 2 ) P33 (t) + α 2 P23 (t) + α 1 P31(t) ………(viii)
These equations are in time independent steady state solution. Therefore the probabilities stabilize to a constant
value, all derivative tends to zero.
dPij (t) / dt = 0 ………………(ix)
Therefore these equations are
- α 2 P23 + α 1 P33 = 0 ……………..(x)
- α 1 P31 + α 2 P33 = 0 ……………..(xi)
The Effect of Imbalance on the Performance of unpaced production line…
DOI: 10.9790/1684-12111419 www.iosrjournals.org 17 | Page
- (α 1 + α 2 ) P33 + α 2 P23 + α 1 P31 ………(xii)
The probabilities are mutually exclusive. Therefore the sum of all probabilities is equal to 1.0.
P23 + P31 + P33 = 1.0 ……………….(xiii)
Consider any two equations from (x) to (xii) and (xiii). The system of simultaneous linear equation can be
solved to find the probability of all system states the production rate of the line can be obtained from any station
of the line because in steady state the production rate is equal to across all the station. Thus
R = (Probability that station 1 is in working state) * α 1
R = (Probability that station 2 is in working state) * α 2
Therefore
R = (P31 + P33) * α1………………. (xiv)
R = (P23 + P33) * α2 …………(xv)
Solving the system of equation (x) to (xiii) and using (xiv) or (xv), the production rate of the line is obtained in
closed form as
R = α1 * α2 (α1 + α2 ) / (α1
2
+ α2
2
+ α1* α2)……………(xvi)
III.b. Model for 5 Station line
A 5 -station line can be modeled with similar consideration as given above for 2-station line. In this
case ijklm system state. Where i, j, k, l, m are states of the station 1 to 5 respectively. Where i = 1,2,3 ; j = 1,2,3
; k = 1,2,3 ; l= 1,2,3 ; m = 1,2,3
pijklm – steady state probabilities that the system is in state ijklm
the total system states for 5 station line will be 55. Which are given below
22223 22231 22233 22311 22313
22323 22331 22333 23111 23113
….. …… ……. ……. …….
Etc….. 33333
The state transition are
Table :2
TO FROM
22223
….
….
33333
222223/X
…..
…..
33333/X
22233/4 22323/3 23223/2 32223/1
….. ……. …….. …….
…… ……. ……. …….
22223/5 22231/4 22313/3 23133/2 31333/1
The 55 equation are
- α5 P22223 + α4 P22233 + α3 P22323 + α2 P23223 + α1 P32223 =0
……………………………………………………..
……………………………………………………..
-(α1 +α2 + α3 +α4 + α5) P33333 + α5 P22223 + α4 P22231 + α3 P22313 + α2 P23133 + α1 P31333 =0
Sum of all Probabilities being equal to one. The Production rate can than found by adding all such probabilities
where any station i is working and multiplying the sum by αi.
A closed form solution for production rate R will be difficult to obtain. Therefore a computer program in C was
developed to solve the simultaneous linear equation numerically by Gaussian7
elimination to obtain production
rate R for specific value of
μi , i = 1,2,3,4,5
IV. Results And Discussion
The kind of imbalance and the data sets considered for each data set the production rates have been
calculated for all be orderings and percent difference „E‟ between highest and lowest production rate have been
obtained for each degree of imbalance D
Table Data set of distribution & Result
S.N. Data Set (Work Load
Distribution)
Degree of
imbalance D
RH RL E%
1. Linear
{0.1, 0.55, 1.0, 1.45, 1.9}
{0.4, 0.7, 1.0, 1.3, 1.6}
{0.7, 0.85, 1.0, 1.15, 1.3}
{0.9, 0.95, 1.0, 1.05, 1.1}
1.8
1.2
0.6
0.2
0.4859
0.469
0.4884
0.4902
0.3694
0.4131
0.4566
0.4786
18.0
13.53
6.96
2.42
2. Random
{0.1, 0.15, 0.25, 0.5, 4}
{0.1,0.3,0.6,2.0,2.0}
3.9
1.9
0.2498
0.4022
0.2468
0.3293
1.22
22.14
The Effect of Imbalance on the Performance of unpaced production line…
DOI: 10.9790/1684-12111419 www.iosrjournals.org 18 | Page
{0.82,0.83,0.84,0.9,1.6}
{0.7,1.0,1.05,1.1,1.15}
{0.7,1.0,1.1,1.1,1.1}
0.79
0.45
0.45
0.4694
0.4885
0.4875
0.4472
0.4674
0.4686
4.92
4.51
4.03
3 Three values are equal to 1.0
and other values are different
{0.1,1.0,1.0,1.0,1.9}
{0.4,1.0,1.0,1.0,1.6}
{{0.7,1.0,1.0,1.0,1.3}
{0.9,1.0,1.0,1.0,1.1}
{1.0,1.0,1.0,1.0,1.0}
{2.0,2.0,2.0,2.0,2.0}
1.8
1.2
0.6
0.2
0.0
0.0
0.4396
0.4689
0.48590.
4884
0.4858
0.2429
0.3918
0.4290
0.4635
0.4805
0.4858
0.2429
12.20
9.30
4.83
1.64
0.0
0.0
4. Two equal values are higher &
other three values are equally
lower
{0.28, 0.28, 0.28, 2.08, 2.08}
{0.52, 0.52, 0.52, 1.72, 1.72}
{0.76, 0.76, 0.76, 1.36, 1.36}
{0.92, 0.92, 0.92, 1.12, 1.12}
1.8
1.2
0.6
0.2
0.391
0.446
0.485
0.491
0.319
0.379
0.444
0.477
22.3
17.31
9.31
3.04
5. Two equal values are lower &
other three values are equally
higher
{0.04, 0.04, 1.64, 1.64, 1.64}
{0.40, 0.40, 1.40, 1.40, 1.40}
{0.64, 0.64, 1.24, 1.24, 1.24}
{0.88, 0.88, 1.08, 1.08, 1.08}
1.6
1.0
0.6
0.2
0.4078
0.4556
0.4788
0.4885
0.343
0.4
0.4416
0.4571
18.89
13.90
8.42
2.82
6. Four equal values are higher &
other one value is lower
{0.04, 1.24, 1.24, 1.24, 1.24}
{0.36, 1.16, 1.16, 1.16, 1.16}
{0.84, 1.04, 1.04, 1.04, 1.04}
1.2
0.8
0.2
0.4501
0.4727
0.4879
0.4151
0.443
0.4795
8.43
6.70
1.75
7. Four equal values are lower &
other one value is higher
{0.64, 0.64, 0.64, 0.64, 2.44}
{0.76, 0.76, 0.76, 0.76, 1.96}
{0.88, 0.88, 0.88, 0.88, 1.48}
{0.96, 0.96, 0.96, 0.96, 1.16}
1.8
1.2
0.6
0.2
0.3799
0.4331
0.4763
0.4874
0.3691
0.4165
0.4599
0.48
2.93
3.99
3.57
1.54
Fig. 2. Degree of imbalance Vs % Different E
The behavior of D Vs E is seen in fig2. It is seen that for a certain kind of imbalance and in general, the
effect of production rate increases as degree of imbalance increases initially and than decrease. At a particular
level of degree of imbalance increases, the effect of production rate is increases because the mean operation
time on the station is not much higher than other station in the production line. Therefore the one station mean
operating time effect the other station mean operating time. Therefore best and worst ordering have high
difference on production rate. However it is also evident that the degree of imbalance has no specific universal
relationship with the effect on the production rate.
The Effect of Imbalance on the Performance of unpaced production line…
DOI: 10.9790/1684-12111419 www.iosrjournals.org 19 | Page
The case when the effect become very low at very high degree of imbalance can be understood by the
following reasoning. When D is very high, one of the station has very large mean operation time compared to all
others. This makes the station with the maximum mean operation time so slow that other station have hardly any
effect on production rate. Therefore the best and worst orderings have very little difference in production rate.
V. Conclusion
The ordering of operation, by assigning different operations of the same data set to different station of
the line, affects the production rate significantly. The percent difference between best and worst ordering was
sometimes as high as 22%.
It may be concluded that, in general, the effect of ordering increases as the degree of imbalance
increases from low to moderate. But as the degree of imbalance increase further the effect starts stabilizing and
then decrease. At very high degree of imbalance the effect of ordering is minimal. This is due to the fact that
when degree of imbalance is high, one station becomes so slow that other station have very tittle effect on
Production rate thus ordering also has little effect.
The general trends of the variation of production rate with degree of imbalance was similar for all kind
of imbalance. However, it is observed that the degree of imbalance is not a very good parameter to assess the
effect of ordering on production rate universally. Nevertheless, in a specific kind of imbalance it may be used as
an effective measure.
References
[1]. Hiller. F.S. and Boling, R.W (1966). “ the effect of some design factor on the efficiency of production line with variable operation
time” J. Ind. Engg. , 17, 651
[2]. E1 – Rayah. T.E. (1979), “ the efficiency of balanced and unbalanced production line.” Int. J. Prod. Res. 17,61
[3]. Yasmashina, H, , and Okamura, K(1983). “ Analysis of in process buffer for multistage transfer line system.” Int. J.Prod. Res. 21,
183.
[4]. Kunter, S. Akbay (1996), “ using simulation optimization to find the best solution,” Ind. Engg. Solution 28, No 5.
[5]. R. Pike & G.F. Martin (1994) the bowl phenomenon in unpaced line to large production”. Int. J.Pood. Res. 32,483.
[6]. R.A. Johnson “ Probability Densities” Proceeding of the Seminar on „Probability and statistics for engineers‟ New Delhi, 1996,
Chapter 5, P137
[7]. E. Balagrusamy „Numerical Methods‟ tata Mc Graw Hill, New Delhi, 1999.

More Related Content

What's hot

Simulation in terminated system
Simulation in terminated system Simulation in terminated system
Simulation in terminated system Saleem Almaqashi
 
Parallel algorithms
Parallel algorithmsParallel algorithms
Parallel algorithmsDanish Javed
 
Design of sampled data control systems 5th lecture
Design of sampled data control systems  5th  lectureDesign of sampled data control systems  5th  lecture
Design of sampled data control systems 5th lectureKhalaf Gaeid Alshammery
 
Optimal Chain Matrix Multiplication Big Data Perspective
Optimal Chain Matrix Multiplication Big Data PerspectiveOptimal Chain Matrix Multiplication Big Data Perspective
Optimal Chain Matrix Multiplication Big Data Perspectiveপল্লব রায়
 
Discrete state space model 9th &10th lecture
Discrete  state space model   9th  &10th  lectureDiscrete  state space model   9th  &10th  lecture
Discrete state space model 9th &10th lectureKhalaf Gaeid Alshammery
 
Dcs lec03 - z-analysis of discrete time control systems
Dcs   lec03 - z-analysis of discrete time control systemsDcs   lec03 - z-analysis of discrete time control systems
Dcs lec03 - z-analysis of discrete time control systemsAmr E. Mohamed
 
APPROACHES IN USING EXPECTATIONMAXIMIZATION ALGORITHM FOR MAXIMUM LIKELIHOOD ...
APPROACHES IN USING EXPECTATIONMAXIMIZATION ALGORITHM FOR MAXIMUM LIKELIHOOD ...APPROACHES IN USING EXPECTATIONMAXIMIZATION ALGORITHM FOR MAXIMUM LIKELIHOOD ...
APPROACHES IN USING EXPECTATIONMAXIMIZATION ALGORITHM FOR MAXIMUM LIKELIHOOD ...cscpconf
 
Application Of The Three-In-One Control Platform Based On OPC In The Lifting-...
Application Of The Three-In-One Control Platform Based On OPC In The Lifting-...Application Of The Three-In-One Control Platform Based On OPC In The Lifting-...
Application Of The Three-In-One Control Platform Based On OPC In The Lifting-...IJRES Journal
 
Analytical Models of Parallel Programs
Analytical Models of Parallel ProgramsAnalytical Models of Parallel Programs
Analytical Models of Parallel ProgramsDr Shashikant Athawale
 
Adaptive pi based on direct synthesis nishant
Adaptive pi based on direct synthesis nishantAdaptive pi based on direct synthesis nishant
Adaptive pi based on direct synthesis nishantNishant Parikh
 
Parallel algorithms
Parallel algorithmsParallel algorithms
Parallel algorithmsguest084d20
 
GEOframe-NewAge: documentation for probabilitiesbackward component
GEOframe-NewAge: documentation for probabilitiesbackward componentGEOframe-NewAge: documentation for probabilitiesbackward component
GEOframe-NewAge: documentation for probabilitiesbackward componentMarialaura Bancheri
 

What's hot (20)

Matrix Multiplication Report
Matrix Multiplication ReportMatrix Multiplication Report
Matrix Multiplication Report
 
Simulation in terminated system
Simulation in terminated system Simulation in terminated system
Simulation in terminated system
 
solver (1)
solver (1)solver (1)
solver (1)
 
03 time and motion
03 time and motion03 time and motion
03 time and motion
 
Parallel algorithms
Parallel algorithmsParallel algorithms
Parallel algorithms
 
Design of sampled data control systems 5th lecture
Design of sampled data control systems  5th  lectureDesign of sampled data control systems  5th  lecture
Design of sampled data control systems 5th lecture
 
MPC
MPCMPC
MPC
 
Optimal Chain Matrix Multiplication Big Data Perspective
Optimal Chain Matrix Multiplication Big Data PerspectiveOptimal Chain Matrix Multiplication Big Data Perspective
Optimal Chain Matrix Multiplication Big Data Perspective
 
Discrete state space model 9th &10th lecture
Discrete  state space model   9th  &10th  lectureDiscrete  state space model   9th  &10th  lecture
Discrete state space model 9th &10th lecture
 
Dcs lec03 - z-analysis of discrete time control systems
Dcs   lec03 - z-analysis of discrete time control systemsDcs   lec03 - z-analysis of discrete time control systems
Dcs lec03 - z-analysis of discrete time control systems
 
Deadbeat Response Design _8th lecture
Deadbeat Response Design _8th lectureDeadbeat Response Design _8th lecture
Deadbeat Response Design _8th lecture
 
APPROACHES IN USING EXPECTATIONMAXIMIZATION ALGORITHM FOR MAXIMUM LIKELIHOOD ...
APPROACHES IN USING EXPECTATIONMAXIMIZATION ALGORITHM FOR MAXIMUM LIKELIHOOD ...APPROACHES IN USING EXPECTATIONMAXIMIZATION ALGORITHM FOR MAXIMUM LIKELIHOOD ...
APPROACHES IN USING EXPECTATIONMAXIMIZATION ALGORITHM FOR MAXIMUM LIKELIHOOD ...
 
Application Of The Three-In-One Control Platform Based On OPC In The Lifting-...
Application Of The Three-In-One Control Platform Based On OPC In The Lifting-...Application Of The Three-In-One Control Platform Based On OPC In The Lifting-...
Application Of The Three-In-One Control Platform Based On OPC In The Lifting-...
 
Analytical Models of Parallel Programs
Analytical Models of Parallel ProgramsAnalytical Models of Parallel Programs
Analytical Models of Parallel Programs
 
Adaptive pi based on direct synthesis nishant
Adaptive pi based on direct synthesis nishantAdaptive pi based on direct synthesis nishant
Adaptive pi based on direct synthesis nishant
 
Parallel algorithms
Parallel algorithmsParallel algorithms
Parallel algorithms
 
GEOframe-NewAge: documentation for probabilitiesbackward component
GEOframe-NewAge: documentation for probabilitiesbackward componentGEOframe-NewAge: documentation for probabilitiesbackward component
GEOframe-NewAge: documentation for probabilitiesbackward component
 
DSP 08 _ Sheet Eight
DSP 08 _ Sheet EightDSP 08 _ Sheet Eight
DSP 08 _ Sheet Eight
 
Parallel Algorithms
Parallel AlgorithmsParallel Algorithms
Parallel Algorithms
 
P1121133705
P1121133705P1121133705
P1121133705
 

Viewers also liked

Cutting Parameter Optimization for Surface Finish and Hole Accuracy in Drilli...
Cutting Parameter Optimization for Surface Finish and Hole Accuracy in Drilli...Cutting Parameter Optimization for Surface Finish and Hole Accuracy in Drilli...
Cutting Parameter Optimization for Surface Finish and Hole Accuracy in Drilli...IOSR Journals
 
A Survey on Mobile Forensic for Android Smartphones
A Survey on Mobile Forensic for Android SmartphonesA Survey on Mobile Forensic for Android Smartphones
A Survey on Mobile Forensic for Android SmartphonesIOSR Journals
 
Implementation of an Improved Microcontroller Based Moving Message Display Sy...
Implementation of an Improved Microcontroller Based Moving Message Display Sy...Implementation of an Improved Microcontroller Based Moving Message Display Sy...
Implementation of an Improved Microcontroller Based Moving Message Display Sy...IOSR Journals
 
Design and Analysis of Image as A Street Light
Design and Analysis of Image as A Street LightDesign and Analysis of Image as A Street Light
Design and Analysis of Image as A Street LightIOSR Journals
 
Data mining Algorithm’s Variant Analysis
Data mining Algorithm’s Variant AnalysisData mining Algorithm’s Variant Analysis
Data mining Algorithm’s Variant AnalysisIOSR Journals
 
Analysis of Spending Pattern on Credit Card Fraud Detection
Analysis of Spending Pattern on Credit Card Fraud DetectionAnalysis of Spending Pattern on Credit Card Fraud Detection
Analysis of Spending Pattern on Credit Card Fraud DetectionIOSR Journals
 
Closed-Form Expressions for Moments of Two-Way Slabs under Concentrated Loads
Closed-Form Expressions for Moments of Two-Way Slabs under Concentrated LoadsClosed-Form Expressions for Moments of Two-Way Slabs under Concentrated Loads
Closed-Form Expressions for Moments of Two-Way Slabs under Concentrated LoadsIOSR Journals
 
New Approach for Determination of Propagation Model Adapted To an Environment...
New Approach for Determination of Propagation Model Adapted To an Environment...New Approach for Determination of Propagation Model Adapted To an Environment...
New Approach for Determination of Propagation Model Adapted To an Environment...IOSR Journals
 
Why And Why Not To Go For HVDC?
Why And Why Not To Go For HVDC?Why And Why Not To Go For HVDC?
Why And Why Not To Go For HVDC?IOSR Journals
 
Design, Modeling and Analysis of Linear Switched Reluctance Motor for Ground ...
Design, Modeling and Analysis of Linear Switched Reluctance Motor for Ground ...Design, Modeling and Analysis of Linear Switched Reluctance Motor for Ground ...
Design, Modeling and Analysis of Linear Switched Reluctance Motor for Ground ...IOSR Journals
 
A Novel Approach for Workload Optimization and Improving Security in Cloud Co...
A Novel Approach for Workload Optimization and Improving Security in Cloud Co...A Novel Approach for Workload Optimization and Improving Security in Cloud Co...
A Novel Approach for Workload Optimization and Improving Security in Cloud Co...IOSR Journals
 
Simulation of Wind Power Dynamic for Electricity Production in Nassiriyah Dis...
Simulation of Wind Power Dynamic for Electricity Production in Nassiriyah Dis...Simulation of Wind Power Dynamic for Electricity Production in Nassiriyah Dis...
Simulation of Wind Power Dynamic for Electricity Production in Nassiriyah Dis...IOSR Journals
 
On Some Types of Fuzzy Separation Axioms in Fuzzy Topological Space on Fuzzy ...
On Some Types of Fuzzy Separation Axioms in Fuzzy Topological Space on Fuzzy ...On Some Types of Fuzzy Separation Axioms in Fuzzy Topological Space on Fuzzy ...
On Some Types of Fuzzy Separation Axioms in Fuzzy Topological Space on Fuzzy ...IOSR Journals
 
Preventing Malicious Node and Provide Secure Routing In Manet
Preventing Malicious Node and Provide Secure Routing In ManetPreventing Malicious Node and Provide Secure Routing In Manet
Preventing Malicious Node and Provide Secure Routing In ManetIOSR Journals
 
Numerical Simulation of 퐒퐢ퟏ−퐱퐆퐞퐱 Thin Film Solar Cell Using AMPS - 1D
Numerical Simulation of 퐒퐢ퟏ−퐱퐆퐞퐱 Thin Film Solar Cell Using AMPS - 1DNumerical Simulation of 퐒퐢ퟏ−퐱퐆퐞퐱 Thin Film Solar Cell Using AMPS - 1D
Numerical Simulation of 퐒퐢ퟏ−퐱퐆퐞퐱 Thin Film Solar Cell Using AMPS - 1DIOSR Journals
 
Literature Survey on Detection of Brain Tumor from MRI Images
Literature Survey on Detection of Brain Tumor from MRI Images Literature Survey on Detection of Brain Tumor from MRI Images
Literature Survey on Detection of Brain Tumor from MRI Images IOSR Journals
 
Design and Implementation of an Improved Wind Speed Meter (Anemometer)
Design and Implementation of an Improved Wind Speed Meter (Anemometer)Design and Implementation of an Improved Wind Speed Meter (Anemometer)
Design and Implementation of an Improved Wind Speed Meter (Anemometer)IOSR Journals
 
Algorithm for the Comparison of Different Types of First Order Edge Detection...
Algorithm for the Comparison of Different Types of First Order Edge Detection...Algorithm for the Comparison of Different Types of First Order Edge Detection...
Algorithm for the Comparison of Different Types of First Order Edge Detection...IOSR Journals
 
Investigation of Thermal Insulation on Ice Coolers
Investigation of Thermal Insulation on Ice CoolersInvestigation of Thermal Insulation on Ice Coolers
Investigation of Thermal Insulation on Ice CoolersIOSR Journals
 
Fungal Identification method by RDNA sequence analysis: Molecular approach to...
Fungal Identification method by RDNA sequence analysis: Molecular approach to...Fungal Identification method by RDNA sequence analysis: Molecular approach to...
Fungal Identification method by RDNA sequence analysis: Molecular approach to...IOSR Journals
 

Viewers also liked (20)

Cutting Parameter Optimization for Surface Finish and Hole Accuracy in Drilli...
Cutting Parameter Optimization for Surface Finish and Hole Accuracy in Drilli...Cutting Parameter Optimization for Surface Finish and Hole Accuracy in Drilli...
Cutting Parameter Optimization for Surface Finish and Hole Accuracy in Drilli...
 
A Survey on Mobile Forensic for Android Smartphones
A Survey on Mobile Forensic for Android SmartphonesA Survey on Mobile Forensic for Android Smartphones
A Survey on Mobile Forensic for Android Smartphones
 
Implementation of an Improved Microcontroller Based Moving Message Display Sy...
Implementation of an Improved Microcontroller Based Moving Message Display Sy...Implementation of an Improved Microcontroller Based Moving Message Display Sy...
Implementation of an Improved Microcontroller Based Moving Message Display Sy...
 
Design and Analysis of Image as A Street Light
Design and Analysis of Image as A Street LightDesign and Analysis of Image as A Street Light
Design and Analysis of Image as A Street Light
 
Data mining Algorithm’s Variant Analysis
Data mining Algorithm’s Variant AnalysisData mining Algorithm’s Variant Analysis
Data mining Algorithm’s Variant Analysis
 
Analysis of Spending Pattern on Credit Card Fraud Detection
Analysis of Spending Pattern on Credit Card Fraud DetectionAnalysis of Spending Pattern on Credit Card Fraud Detection
Analysis of Spending Pattern on Credit Card Fraud Detection
 
Closed-Form Expressions for Moments of Two-Way Slabs under Concentrated Loads
Closed-Form Expressions for Moments of Two-Way Slabs under Concentrated LoadsClosed-Form Expressions for Moments of Two-Way Slabs under Concentrated Loads
Closed-Form Expressions for Moments of Two-Way Slabs under Concentrated Loads
 
New Approach for Determination of Propagation Model Adapted To an Environment...
New Approach for Determination of Propagation Model Adapted To an Environment...New Approach for Determination of Propagation Model Adapted To an Environment...
New Approach for Determination of Propagation Model Adapted To an Environment...
 
Why And Why Not To Go For HVDC?
Why And Why Not To Go For HVDC?Why And Why Not To Go For HVDC?
Why And Why Not To Go For HVDC?
 
Design, Modeling and Analysis of Linear Switched Reluctance Motor for Ground ...
Design, Modeling and Analysis of Linear Switched Reluctance Motor for Ground ...Design, Modeling and Analysis of Linear Switched Reluctance Motor for Ground ...
Design, Modeling and Analysis of Linear Switched Reluctance Motor for Ground ...
 
A Novel Approach for Workload Optimization and Improving Security in Cloud Co...
A Novel Approach for Workload Optimization and Improving Security in Cloud Co...A Novel Approach for Workload Optimization and Improving Security in Cloud Co...
A Novel Approach for Workload Optimization and Improving Security in Cloud Co...
 
Simulation of Wind Power Dynamic for Electricity Production in Nassiriyah Dis...
Simulation of Wind Power Dynamic for Electricity Production in Nassiriyah Dis...Simulation of Wind Power Dynamic for Electricity Production in Nassiriyah Dis...
Simulation of Wind Power Dynamic for Electricity Production in Nassiriyah Dis...
 
On Some Types of Fuzzy Separation Axioms in Fuzzy Topological Space on Fuzzy ...
On Some Types of Fuzzy Separation Axioms in Fuzzy Topological Space on Fuzzy ...On Some Types of Fuzzy Separation Axioms in Fuzzy Topological Space on Fuzzy ...
On Some Types of Fuzzy Separation Axioms in Fuzzy Topological Space on Fuzzy ...
 
Preventing Malicious Node and Provide Secure Routing In Manet
Preventing Malicious Node and Provide Secure Routing In ManetPreventing Malicious Node and Provide Secure Routing In Manet
Preventing Malicious Node and Provide Secure Routing In Manet
 
Numerical Simulation of 퐒퐢ퟏ−퐱퐆퐞퐱 Thin Film Solar Cell Using AMPS - 1D
Numerical Simulation of 퐒퐢ퟏ−퐱퐆퐞퐱 Thin Film Solar Cell Using AMPS - 1DNumerical Simulation of 퐒퐢ퟏ−퐱퐆퐞퐱 Thin Film Solar Cell Using AMPS - 1D
Numerical Simulation of 퐒퐢ퟏ−퐱퐆퐞퐱 Thin Film Solar Cell Using AMPS - 1D
 
Literature Survey on Detection of Brain Tumor from MRI Images
Literature Survey on Detection of Brain Tumor from MRI Images Literature Survey on Detection of Brain Tumor from MRI Images
Literature Survey on Detection of Brain Tumor from MRI Images
 
Design and Implementation of an Improved Wind Speed Meter (Anemometer)
Design and Implementation of an Improved Wind Speed Meter (Anemometer)Design and Implementation of an Improved Wind Speed Meter (Anemometer)
Design and Implementation of an Improved Wind Speed Meter (Anemometer)
 
Algorithm for the Comparison of Different Types of First Order Edge Detection...
Algorithm for the Comparison of Different Types of First Order Edge Detection...Algorithm for the Comparison of Different Types of First Order Edge Detection...
Algorithm for the Comparison of Different Types of First Order Edge Detection...
 
Investigation of Thermal Insulation on Ice Coolers
Investigation of Thermal Insulation on Ice CoolersInvestigation of Thermal Insulation on Ice Coolers
Investigation of Thermal Insulation on Ice Coolers
 
Fungal Identification method by RDNA sequence analysis: Molecular approach to...
Fungal Identification method by RDNA sequence analysis: Molecular approach to...Fungal Identification method by RDNA sequence analysis: Molecular approach to...
Fungal Identification method by RDNA sequence analysis: Molecular approach to...
 

Similar to The Effect of Imbalance on Unpaced Production Line Performance

International Journal of Engineering Research and Development
International Journal of Engineering Research and DevelopmentInternational Journal of Engineering Research and Development
International Journal of Engineering Research and DevelopmentIJERD Editor
 
Reliability engineering chapter-2 reliability of systems
Reliability engineering chapter-2 reliability of systemsReliability engineering chapter-2 reliability of systems
Reliability engineering chapter-2 reliability of systemsCharlton Inao
 
JGrass-NewAge probabilities backward component
JGrass-NewAge probabilities backward component JGrass-NewAge probabilities backward component
JGrass-NewAge probabilities backward component Marialaura Bancheri
 
Estimating Reconstruction Error due to Jitter of Gaussian Markov Processes
Estimating Reconstruction Error due to Jitter of Gaussian Markov ProcessesEstimating Reconstruction Error due to Jitter of Gaussian Markov Processes
Estimating Reconstruction Error due to Jitter of Gaussian Markov ProcessesMudassir Javed
 
Lecture 02 Traffic Flow Characteristics (Traffic Engineering هندسة المرور & D...
Lecture 02 Traffic Flow Characteristics (Traffic Engineering هندسة المرور & D...Lecture 02 Traffic Flow Characteristics (Traffic Engineering هندسة المرور & D...
Lecture 02 Traffic Flow Characteristics (Traffic Engineering هندسة المرور & D...Hossam Shafiq I
 
JGrass-NewAge probabilities forward component
JGrass-NewAge probabilities forward component JGrass-NewAge probabilities forward component
JGrass-NewAge probabilities forward component Marialaura Bancheri
 
Data-Driven Security Assessment of Power Grids Based on Machine Learning Appr...
Data-Driven Security Assessment of Power Grids Based on Machine Learning Appr...Data-Driven Security Assessment of Power Grids Based on Machine Learning Appr...
Data-Driven Security Assessment of Power Grids Based on Machine Learning Appr...Power System Operation
 
Performance of metaheuristic methods for loop
Performance of metaheuristic methods for loopPerformance of metaheuristic methods for loop
Performance of metaheuristic methods for loopIAEME Publication
 
saad faim paper3
saad faim paper3saad faim paper3
saad faim paper3Saad Farooq
 
Using Genetic Algorithm for Shortest Path Selection with Real Time Traffic Flow
Using Genetic Algorithm for Shortest Path Selection with Real Time Traffic FlowUsing Genetic Algorithm for Shortest Path Selection with Real Time Traffic Flow
Using Genetic Algorithm for Shortest Path Selection with Real Time Traffic FlowIJCSIS Research Publications
 
presentation_final
presentation_finalpresentation_final
presentation_finalSushanta Roy
 
MultiLevelROM_ANS_Summer2015_RevMarch23
MultiLevelROM_ANS_Summer2015_RevMarch23MultiLevelROM_ANS_Summer2015_RevMarch23
MultiLevelROM_ANS_Summer2015_RevMarch23Mohammad Abdo
 

Similar to The Effect of Imbalance on Unpaced Production Line Performance (20)

Aa4506146150
Aa4506146150Aa4506146150
Aa4506146150
 
International Journal of Engineering Research and Development
International Journal of Engineering Research and DevelopmentInternational Journal of Engineering Research and Development
International Journal of Engineering Research and Development
 
Tutorial marzo2011 villen
Tutorial marzo2011 villenTutorial marzo2011 villen
Tutorial marzo2011 villen
 
Reliability engineering chapter-2 reliability of systems
Reliability engineering chapter-2 reliability of systemsReliability engineering chapter-2 reliability of systems
Reliability engineering chapter-2 reliability of systems
 
JGrass-NewAge probabilities backward component
JGrass-NewAge probabilities backward component JGrass-NewAge probabilities backward component
JGrass-NewAge probabilities backward component
 
Estimating Reconstruction Error due to Jitter of Gaussian Markov Processes
Estimating Reconstruction Error due to Jitter of Gaussian Markov ProcessesEstimating Reconstruction Error due to Jitter of Gaussian Markov Processes
Estimating Reconstruction Error due to Jitter of Gaussian Markov Processes
 
Lecture 02 Traffic Flow Characteristics (Traffic Engineering هندسة المرور & D...
Lecture 02 Traffic Flow Characteristics (Traffic Engineering هندسة المرور & D...Lecture 02 Traffic Flow Characteristics (Traffic Engineering هندسة المرور & D...
Lecture 02 Traffic Flow Characteristics (Traffic Engineering هندسة المرور & D...
 
Genetic Algorithms
Genetic AlgorithmsGenetic Algorithms
Genetic Algorithms
 
JGrass-NewAge probabilities forward component
JGrass-NewAge probabilities forward component JGrass-NewAge probabilities forward component
JGrass-NewAge probabilities forward component
 
4267
42674267
4267
 
4267
42674267
4267
 
40220140505002
4022014050500240220140505002
40220140505002
 
Data-Driven Security Assessment of Power Grids Based on Machine Learning Appr...
Data-Driven Security Assessment of Power Grids Based on Machine Learning Appr...Data-Driven Security Assessment of Power Grids Based on Machine Learning Appr...
Data-Driven Security Assessment of Power Grids Based on Machine Learning Appr...
 
Data-Driven Security Assessment of Power Grids Based on Machine Learning Appr...
Data-Driven Security Assessment of Power Grids Based on Machine Learning Appr...Data-Driven Security Assessment of Power Grids Based on Machine Learning Appr...
Data-Driven Security Assessment of Power Grids Based on Machine Learning Appr...
 
Performance of metaheuristic methods for loop
Performance of metaheuristic methods for loopPerformance of metaheuristic methods for loop
Performance of metaheuristic methods for loop
 
saad faim paper3
saad faim paper3saad faim paper3
saad faim paper3
 
Differential Evolution Algorithm with Triangular Adaptive Control Parameter f...
Differential Evolution Algorithm with Triangular Adaptive Control Parameter f...Differential Evolution Algorithm with Triangular Adaptive Control Parameter f...
Differential Evolution Algorithm with Triangular Adaptive Control Parameter f...
 
Using Genetic Algorithm for Shortest Path Selection with Real Time Traffic Flow
Using Genetic Algorithm for Shortest Path Selection with Real Time Traffic FlowUsing Genetic Algorithm for Shortest Path Selection with Real Time Traffic Flow
Using Genetic Algorithm for Shortest Path Selection with Real Time Traffic Flow
 
presentation_final
presentation_finalpresentation_final
presentation_final
 
MultiLevelROM_ANS_Summer2015_RevMarch23
MultiLevelROM_ANS_Summer2015_RevMarch23MultiLevelROM_ANS_Summer2015_RevMarch23
MultiLevelROM_ANS_Summer2015_RevMarch23
 

More from IOSR Journals (20)

A011140104
A011140104A011140104
A011140104
 
M0111397100
M0111397100M0111397100
M0111397100
 
L011138596
L011138596L011138596
L011138596
 
K011138084
K011138084K011138084
K011138084
 
J011137479
J011137479J011137479
J011137479
 
I011136673
I011136673I011136673
I011136673
 
G011134454
G011134454G011134454
G011134454
 
H011135565
H011135565H011135565
H011135565
 
F011134043
F011134043F011134043
F011134043
 
E011133639
E011133639E011133639
E011133639
 
D011132635
D011132635D011132635
D011132635
 
C011131925
C011131925C011131925
C011131925
 
B011130918
B011130918B011130918
B011130918
 
A011130108
A011130108A011130108
A011130108
 
I011125160
I011125160I011125160
I011125160
 
H011124050
H011124050H011124050
H011124050
 
G011123539
G011123539G011123539
G011123539
 
F011123134
F011123134F011123134
F011123134
 
E011122530
E011122530E011122530
E011122530
 
D011121524
D011121524D011121524
D011121524
 

Recently uploaded

Call Girls Delhi {Jodhpur} 9711199012 high profile service
Call Girls Delhi {Jodhpur} 9711199012 high profile serviceCall Girls Delhi {Jodhpur} 9711199012 high profile service
Call Girls Delhi {Jodhpur} 9711199012 high profile servicerehmti665
 
welding defects observed during the welding
welding defects observed during the weldingwelding defects observed during the welding
welding defects observed during the weldingMuhammadUzairLiaqat
 
Software and Systems Engineering Standards: Verification and Validation of Sy...
Software and Systems Engineering Standards: Verification and Validation of Sy...Software and Systems Engineering Standards: Verification and Validation of Sy...
Software and Systems Engineering Standards: Verification and Validation of Sy...VICTOR MAESTRE RAMIREZ
 
Risk Assessment For Installation of Drainage Pipes.pdf
Risk Assessment For Installation of Drainage Pipes.pdfRisk Assessment For Installation of Drainage Pipes.pdf
Risk Assessment For Installation of Drainage Pipes.pdfROCENODodongVILLACER
 
Application of Residue Theorem to evaluate real integrations.pptx
Application of Residue Theorem to evaluate real integrations.pptxApplication of Residue Theorem to evaluate real integrations.pptx
Application of Residue Theorem to evaluate real integrations.pptx959SahilShah
 
TechTAC® CFD Report Summary: A Comparison of Two Types of Tubing Anchor Catchers
TechTAC® CFD Report Summary: A Comparison of Two Types of Tubing Anchor CatchersTechTAC® CFD Report Summary: A Comparison of Two Types of Tubing Anchor Catchers
TechTAC® CFD Report Summary: A Comparison of Two Types of Tubing Anchor Catcherssdickerson1
 
Architect Hassan Khalil Portfolio for 2024
Architect Hassan Khalil Portfolio for 2024Architect Hassan Khalil Portfolio for 2024
Architect Hassan Khalil Portfolio for 2024hassan khalil
 
IVE Industry Focused Event - Defence Sector 2024
IVE Industry Focused Event - Defence Sector 2024IVE Industry Focused Event - Defence Sector 2024
IVE Industry Focused Event - Defence Sector 2024Mark Billinghurst
 
Class 1 | NFPA 72 | Overview Fire Alarm System
Class 1 | NFPA 72 | Overview Fire Alarm SystemClass 1 | NFPA 72 | Overview Fire Alarm System
Class 1 | NFPA 72 | Overview Fire Alarm Systemirfanmechengr
 
Call Us ≽ 8377877756 ≼ Call Girls In Shastri Nagar (Delhi)
Call Us ≽ 8377877756 ≼ Call Girls In Shastri Nagar (Delhi)Call Us ≽ 8377877756 ≼ Call Girls In Shastri Nagar (Delhi)
Call Us ≽ 8377877756 ≼ Call Girls In Shastri Nagar (Delhi)dollysharma2066
 
Sachpazis Costas: Geotechnical Engineering: A student's Perspective Introduction
Sachpazis Costas: Geotechnical Engineering: A student's Perspective IntroductionSachpazis Costas: Geotechnical Engineering: A student's Perspective Introduction
Sachpazis Costas: Geotechnical Engineering: A student's Perspective IntroductionDr.Costas Sachpazis
 
Unit7-DC_Motors nkkjnsdkfnfcdfknfdgfggfg
Unit7-DC_Motors nkkjnsdkfnfcdfknfdgfggfgUnit7-DC_Motors nkkjnsdkfnfcdfknfdgfggfg
Unit7-DC_Motors nkkjnsdkfnfcdfknfdgfggfgsaravananr517913
 
Introduction to Machine Learning Unit-3 for II MECH
Introduction to Machine Learning Unit-3 for II MECHIntroduction to Machine Learning Unit-3 for II MECH
Introduction to Machine Learning Unit-3 for II MECHC Sai Kiran
 
CCS355 Neural Network & Deep Learning Unit II Notes with Question bank .pdf
CCS355 Neural Network & Deep Learning Unit II Notes with Question bank .pdfCCS355 Neural Network & Deep Learning Unit II Notes with Question bank .pdf
CCS355 Neural Network & Deep Learning Unit II Notes with Question bank .pdfAsst.prof M.Gokilavani
 
CCS355 Neural Network & Deep Learning UNIT III notes and Question bank .pdf
CCS355 Neural Network & Deep Learning UNIT III notes and Question bank .pdfCCS355 Neural Network & Deep Learning UNIT III notes and Question bank .pdf
CCS355 Neural Network & Deep Learning UNIT III notes and Question bank .pdfAsst.prof M.Gokilavani
 
Past, Present and Future of Generative AI
Past, Present and Future of Generative AIPast, Present and Future of Generative AI
Past, Present and Future of Generative AIabhishek36461
 

Recently uploaded (20)

Design and analysis of solar grass cutter.pdf
Design and analysis of solar grass cutter.pdfDesign and analysis of solar grass cutter.pdf
Design and analysis of solar grass cutter.pdf
 
Call Girls Delhi {Jodhpur} 9711199012 high profile service
Call Girls Delhi {Jodhpur} 9711199012 high profile serviceCall Girls Delhi {Jodhpur} 9711199012 high profile service
Call Girls Delhi {Jodhpur} 9711199012 high profile service
 
welding defects observed during the welding
welding defects observed during the weldingwelding defects observed during the welding
welding defects observed during the welding
 
Software and Systems Engineering Standards: Verification and Validation of Sy...
Software and Systems Engineering Standards: Verification and Validation of Sy...Software and Systems Engineering Standards: Verification and Validation of Sy...
Software and Systems Engineering Standards: Verification and Validation of Sy...
 
Risk Assessment For Installation of Drainage Pipes.pdf
Risk Assessment For Installation of Drainage Pipes.pdfRisk Assessment For Installation of Drainage Pipes.pdf
Risk Assessment For Installation of Drainage Pipes.pdf
 
Application of Residue Theorem to evaluate real integrations.pptx
Application of Residue Theorem to evaluate real integrations.pptxApplication of Residue Theorem to evaluate real integrations.pptx
Application of Residue Theorem to evaluate real integrations.pptx
 
TechTAC® CFD Report Summary: A Comparison of Two Types of Tubing Anchor Catchers
TechTAC® CFD Report Summary: A Comparison of Two Types of Tubing Anchor CatchersTechTAC® CFD Report Summary: A Comparison of Two Types of Tubing Anchor Catchers
TechTAC® CFD Report Summary: A Comparison of Two Types of Tubing Anchor Catchers
 
young call girls in Green Park🔝 9953056974 🔝 escort Service
young call girls in Green Park🔝 9953056974 🔝 escort Serviceyoung call girls in Green Park🔝 9953056974 🔝 escort Service
young call girls in Green Park🔝 9953056974 🔝 escort Service
 
Architect Hassan Khalil Portfolio for 2024
Architect Hassan Khalil Portfolio for 2024Architect Hassan Khalil Portfolio for 2024
Architect Hassan Khalil Portfolio for 2024
 
IVE Industry Focused Event - Defence Sector 2024
IVE Industry Focused Event - Defence Sector 2024IVE Industry Focused Event - Defence Sector 2024
IVE Industry Focused Event - Defence Sector 2024
 
Class 1 | NFPA 72 | Overview Fire Alarm System
Class 1 | NFPA 72 | Overview Fire Alarm SystemClass 1 | NFPA 72 | Overview Fire Alarm System
Class 1 | NFPA 72 | Overview Fire Alarm System
 
Call Us ≽ 8377877756 ≼ Call Girls In Shastri Nagar (Delhi)
Call Us ≽ 8377877756 ≼ Call Girls In Shastri Nagar (Delhi)Call Us ≽ 8377877756 ≼ Call Girls In Shastri Nagar (Delhi)
Call Us ≽ 8377877756 ≼ Call Girls In Shastri Nagar (Delhi)
 
young call girls in Rajiv Chowk🔝 9953056974 🔝 Delhi escort Service
young call girls in Rajiv Chowk🔝 9953056974 🔝 Delhi escort Serviceyoung call girls in Rajiv Chowk🔝 9953056974 🔝 Delhi escort Service
young call girls in Rajiv Chowk🔝 9953056974 🔝 Delhi escort Service
 
Sachpazis Costas: Geotechnical Engineering: A student's Perspective Introduction
Sachpazis Costas: Geotechnical Engineering: A student's Perspective IntroductionSachpazis Costas: Geotechnical Engineering: A student's Perspective Introduction
Sachpazis Costas: Geotechnical Engineering: A student's Perspective Introduction
 
Unit7-DC_Motors nkkjnsdkfnfcdfknfdgfggfg
Unit7-DC_Motors nkkjnsdkfnfcdfknfdgfggfgUnit7-DC_Motors nkkjnsdkfnfcdfknfdgfggfg
Unit7-DC_Motors nkkjnsdkfnfcdfknfdgfggfg
 
Introduction to Machine Learning Unit-3 for II MECH
Introduction to Machine Learning Unit-3 for II MECHIntroduction to Machine Learning Unit-3 for II MECH
Introduction to Machine Learning Unit-3 for II MECH
 
POWER SYSTEMS-1 Complete notes examples
POWER SYSTEMS-1 Complete notes  examplesPOWER SYSTEMS-1 Complete notes  examples
POWER SYSTEMS-1 Complete notes examples
 
CCS355 Neural Network & Deep Learning Unit II Notes with Question bank .pdf
CCS355 Neural Network & Deep Learning Unit II Notes with Question bank .pdfCCS355 Neural Network & Deep Learning Unit II Notes with Question bank .pdf
CCS355 Neural Network & Deep Learning Unit II Notes with Question bank .pdf
 
CCS355 Neural Network & Deep Learning UNIT III notes and Question bank .pdf
CCS355 Neural Network & Deep Learning UNIT III notes and Question bank .pdfCCS355 Neural Network & Deep Learning UNIT III notes and Question bank .pdf
CCS355 Neural Network & Deep Learning UNIT III notes and Question bank .pdf
 
Past, Present and Future of Generative AI
Past, Present and Future of Generative AIPast, Present and Future of Generative AI
Past, Present and Future of Generative AI
 

The Effect of Imbalance on Unpaced Production Line Performance

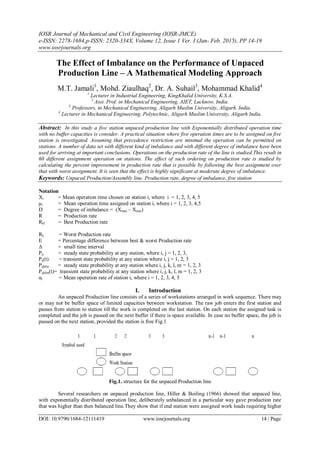
  • 1. IOSR Journal of Mechanical and Civil Engineering (IOSR-JMCE) e-ISSN: 2278-1684,p-ISSN: 2320-334X, Volume 12, Issue 1 Ver. I (Jan- Feb. 2015), PP 14-19 www.iosrjournals.org DOI: 10.9790/1684-12111419 www.iosrjournals.org 14 | Page The Effect of Imbalance on the Performance of Unpaced Production Line – A Mathematical Modeling Approach M.T. Jamali1 , Mohd. Ziaulhaq2 , Dr. A. Suhail3 , Mohammad Khalid4 1 Lecturer in Industrial Engineering, KingKhalid University, K.S.A. 2 Asst. Prof. in Mechanical Engineering, AIET, Lucknow, India. 3 Professors, in Mechanical Engineering, Aligarh Muslim University, Aligarh. India. 4 Lecturer in Mechanical Engineering, Polytechnic, Aligarh Muslim University, Aligarh India. Abstract: In this study a five station unpaced production line with Exponentially distributed operation time with no buffer capacities is consider. A practical situation where five operation times are to be assigned on five station is investigated. Assuming that precedence restriction are minimal the operation can be permitted on stations. A number of data set with different kind of imbalance and with different degree of imbalance have been used for arriving at important conclusions. Operations on the production rate of the line is studied.This result in 60 different assignment operation on stations. The effect of such ordering on production rate is studied by calculating the percent improvement in production rate that is possible by following the best assignment over that with worst assignment. It is seen that the effect is highly significant at moderate degree of imbalance. Keywords: Unpaced Production/Assembly line, Production rate, degree of imbalance, five station Notation Xi = Mean operation time chosen on station i, where i = 1, 2, 3, 4, 5 μi = Mean operation time assigned on station i, where i = 1, 2, 3, 4,5 D = Degree of imbalance = (Xmax – Xmin) R = Production rate RH = Best Production rate RL = Worst Production rate E = Percentage difference between best & worst Production rate Δ = small time interval Pij = steady state probability at any station, where i, j = 1, 2, 3, Pij(t) = transient state probability at any station where i, j = 1, 2, 3 Pijklm = steady state probability at any station where i, j, k, l, m = 1, 2, 3 Pijklm(t)= transient state probability at any station where i, j, k, l, m = 1, 2, 3 αi = Mean operation rate of station i, where i = 1, 2, 3, 4, 5 I. Introduction An unpaced Production line consists of a series of workstations arranged in work sequence. There may or may not be buffer space of limited capacities between workstation. The raw job enters the first station and passes from station to station till the work is completed on the last station. On each station the assigned task is completed and the job is passed on the next buffer if there is space available. In case no buffer space, the job is passed on the next station, provided the station is free Fig.1 Fig.1. structure for the unpaced Production line Several researchers on unpaced production line, Hiller & Boiling (1966) showed that unpaced line, with exponentially distributed operation line, deliberately unbalanced in a particular way gave production rate that was higher than then balanced line.They show that if end station were assigned work loads requiring higher
  • 2. The Effect of Imbalance on the Performance of unpaced production line… DOI: 10.9790/1684-12111419 www.iosrjournals.org 15 | Page mean operation time and central stations were assigned work loads requiring less operation time the production rate may be improved over that of the balanced line. They called it bow phenomenon. EL – Rayah (1979) Proved that this is fact was true. Several researches on unpaced production line to find efficiency of balanced line or to find the unbalancing strategy to achieve maximum production rate. These researchers are Yamashina and Okamura (1983), Hillier & so (1993), Pike & martin 1994, Akbay (1996). In the present study attempt has been made to determine, whether a particular order of stations is better than another ordering of station, if station workload remains fixed and unbalanced. The study has been carried out on a 5 – station unpaced Production line. The station times are assumed to be exponentially distributed due to ease of mathematical modeling. There are no buffer capacities in between the station. A work piece can leave the line only from the last station and that no work piece can move backward in the line. Processing times are independent across the workstation. II. Problem Formulation & Methodology A hypothetical process to be completed on a five station unpaced production line has to be broken into 5 operation each to be performed on a station. A data set X= {X1, X2, X3, X4, X5} is chosen mean operation time and the values are assigned to stations. Xi, i= 1,2,3,4,5 is arranged in ascending order, the sum of all Xi„s being equal to 5 & μi, i=1,2,3,4,5 is the mean operation time assign on station i. D is Degree of Imbalance is the difference between highest mean operation time and lowest mean operation time irrespective of which stations have been assigned to mathematically D= Xmax – Xmin. μi represents ordering permuted by computer program such as μ1 = X1, μ2 = X2 , μ3 = X3, μ4 = X4, μ5 = X5 μ1 = X1, μ2 = X2 , μ3 = X3, μ4 = X5, μ5 = X4 ……………… Each ordering has a mirror image also and since the production rate is forward and reverse direction is same, there are actually 60 orderings in all. For the same degree of imbalance irrespective of ordering the production rate has been obtained. The effect of imbalance is to find the effect of ordering on the percentage difference (E) between best (RH) and worst production rate RL. The percentage difference E is then calculated as E = (RH-RL) *100 / RL Where RH = best Production rate RL = Worst Production rate The value of E will be used to convince that ordering of task results in significant difference in production rate and substantial improvement in line performance can be achieved by judicially selecting the ordering of tasks. III. Mathematical Modeling Before the development of model following assumption have been made (a) There are always jobs available for the first station so that first station is never starved (b) There is always space available after the last station so that the last station is never blocked. (c) All operation times are exponentially distributed (d) There are no buffer space between stations (e) The system reaches a steady state of statistical equilibrium after sometime, and the interest in this study lies in steady state only. (f) The time required for the transfer of the job in between the station is negligible. Exponential distribution property is known as forgetfulness or lack of memory. Let us define an event to be the completion of processing of work piece on a station. Than it states that on a particular station of the production line, process on a work piece begins at time „t0‟ then at any time t, the probability that the process on that work piece will end during a small time interval Δ, where Δ is very small, is independent of the magnitude of (t-t0). Let probability density function (pdf) of an exponential distribution is f(t) = α e-α t ; t ≥ 0 ………………….(i) This equation represent an exponential distribution with a mean of 1/ α time unit. Where α is operation rate at the station; which means that on an average α work piece are processed on the station per unit time. The probability that an operation at this station will end in a small interval Δ is equal to
  • 3. The Effect of Imbalance on the Performance of unpaced production line… DOI: 10.9790/1684-12111419 www.iosrjournals.org 16 | Page α Δ irrespective of times elapsed since its beginning. Similarly the probability that the operation at that station will not end in time interval Δ is equal to ( 1- α Δ). Since each station may be in one of the three states, namely working, starved or blocked. These states are coded as follows. 1- starved 2- blocked 3- working System states are formed by combining station states and the probability of various system states are determined by forming probability equations. Since model of 5 -station line consist of large number of system states and equation, the whole procedure of modeling is described with the help of a 2-station line. III.A. Development Of A Model For 2 – Station Line Let ij – system state where i is the state of station 1 and j is the state of station 2, i= 1,2,3 j = 1,2,3 station state dPij(t) / dt --- first derivative of Pij (t) with respect to t. αi = Mean operation rate of station i, αi = 1/ μi the total system states that can be formed with two station can be given as 11, 12 , 13, 21 ,22 , 23 , 31 , 32 , 33 using assumption only valid states are 23, 31 , 33 since Δ is very small, the usual assumption that two or more events cannot occurs during Δ is taken here as well. Let us see how can the probability that, at time (t+Δ), the system is in state 23 be found out. This can occur if. Either The system was in state 23 at time t AND nothing changed during Δ OR The system was in state 33 at time t AND the first station completed its operation during Δ The above can be written in the form of state transition in the following way To 23 FROM 23/X 33/1 Where the notation ij/K represents that the system was in state ij at time t AND Δ station K completed its operation. The notation ij/x denotes that the system was in state ij at time „t‟ AND nothing changed during Δ Similar argument may be given to arrive at various system state at time (t+ Δ). All system state transition for a two station line are shown in table1. Table :1 TO FROM 23 31 33 23/X 31/X 33/X 33/1 33/2 33/2 33/1 The following three equation6 can now be written for Pij(t+ Δ) for all system states. P23(t+ Δ) = P23 (t) (1- α 2 Δ) + P33 (t) α 1Δ (1- α 2 Δ)………………(ii) P31(t+ Δ) = P31 (t) (1- α 1 Δ) + P33 (t)α2Δ (1- α 1 Δ)………………(iii) P33(t+ Δ) = P33 (t) (1- α 1 Δ) (1- α 2 Δ) + P23 (t) α 2Δ +P31 (t) α 1 Δ…..(iv) Ignoring higher power of Δ and recalling the fact that dPij (t) / dt = lim Δ 0 [ Pij (t+Δ) – Pij(t)] / Δ ……………..(v) The equation (ii) to (iv) can be arranged to give three differential equation as follows dP23 (t) / dt = - α 2 P23 (t) + α 1 P33 (t) ……………..(vi) dP31 (t) / dt = - α 1 P31 (t) + α 2 P33 (t) ……………..(vii) dP33 (t) / dt = - (α 1 + α 2 ) P33 (t) + α 2 P23 (t) + α 1 P31(t) ………(viii) These equations are in time independent steady state solution. Therefore the probabilities stabilize to a constant value, all derivative tends to zero. dPij (t) / dt = 0 ………………(ix) Therefore these equations are - α 2 P23 + α 1 P33 = 0 ……………..(x) - α 1 P31 + α 2 P33 = 0 ……………..(xi)
  • 4. The Effect of Imbalance on the Performance of unpaced production line… DOI: 10.9790/1684-12111419 www.iosrjournals.org 17 | Page - (α 1 + α 2 ) P33 + α 2 P23 + α 1 P31 ………(xii) The probabilities are mutually exclusive. Therefore the sum of all probabilities is equal to 1.0. P23 + P31 + P33 = 1.0 ……………….(xiii) Consider any two equations from (x) to (xii) and (xiii). The system of simultaneous linear equation can be solved to find the probability of all system states the production rate of the line can be obtained from any station of the line because in steady state the production rate is equal to across all the station. Thus R = (Probability that station 1 is in working state) * α 1 R = (Probability that station 2 is in working state) * α 2 Therefore R = (P31 + P33) * α1………………. (xiv) R = (P23 + P33) * α2 …………(xv) Solving the system of equation (x) to (xiii) and using (xiv) or (xv), the production rate of the line is obtained in closed form as R = α1 * α2 (α1 + α2 ) / (α1 2 + α2 2 + α1* α2)……………(xvi) III.b. Model for 5 Station line A 5 -station line can be modeled with similar consideration as given above for 2-station line. In this case ijklm system state. Where i, j, k, l, m are states of the station 1 to 5 respectively. Where i = 1,2,3 ; j = 1,2,3 ; k = 1,2,3 ; l= 1,2,3 ; m = 1,2,3 pijklm – steady state probabilities that the system is in state ijklm the total system states for 5 station line will be 55. Which are given below 22223 22231 22233 22311 22313 22323 22331 22333 23111 23113 ….. …… ……. ……. ……. Etc….. 33333 The state transition are Table :2 TO FROM 22223 …. …. 33333 222223/X ….. ….. 33333/X 22233/4 22323/3 23223/2 32223/1 ….. ……. …….. ……. …… ……. ……. ……. 22223/5 22231/4 22313/3 23133/2 31333/1 The 55 equation are - α5 P22223 + α4 P22233 + α3 P22323 + α2 P23223 + α1 P32223 =0 …………………………………………………….. …………………………………………………….. -(α1 +α2 + α3 +α4 + α5) P33333 + α5 P22223 + α4 P22231 + α3 P22313 + α2 P23133 + α1 P31333 =0 Sum of all Probabilities being equal to one. The Production rate can than found by adding all such probabilities where any station i is working and multiplying the sum by αi. A closed form solution for production rate R will be difficult to obtain. Therefore a computer program in C was developed to solve the simultaneous linear equation numerically by Gaussian7 elimination to obtain production rate R for specific value of μi , i = 1,2,3,4,5 IV. Results And Discussion The kind of imbalance and the data sets considered for each data set the production rates have been calculated for all be orderings and percent difference „E‟ between highest and lowest production rate have been obtained for each degree of imbalance D Table Data set of distribution & Result S.N. Data Set (Work Load Distribution) Degree of imbalance D RH RL E% 1. Linear {0.1, 0.55, 1.0, 1.45, 1.9} {0.4, 0.7, 1.0, 1.3, 1.6} {0.7, 0.85, 1.0, 1.15, 1.3} {0.9, 0.95, 1.0, 1.05, 1.1} 1.8 1.2 0.6 0.2 0.4859 0.469 0.4884 0.4902 0.3694 0.4131 0.4566 0.4786 18.0 13.53 6.96 2.42 2. Random {0.1, 0.15, 0.25, 0.5, 4} {0.1,0.3,0.6,2.0,2.0} 3.9 1.9 0.2498 0.4022 0.2468 0.3293 1.22 22.14
  • 5. The Effect of Imbalance on the Performance of unpaced production line… DOI: 10.9790/1684-12111419 www.iosrjournals.org 18 | Page {0.82,0.83,0.84,0.9,1.6} {0.7,1.0,1.05,1.1,1.15} {0.7,1.0,1.1,1.1,1.1} 0.79 0.45 0.45 0.4694 0.4885 0.4875 0.4472 0.4674 0.4686 4.92 4.51 4.03 3 Three values are equal to 1.0 and other values are different {0.1,1.0,1.0,1.0,1.9} {0.4,1.0,1.0,1.0,1.6} {{0.7,1.0,1.0,1.0,1.3} {0.9,1.0,1.0,1.0,1.1} {1.0,1.0,1.0,1.0,1.0} {2.0,2.0,2.0,2.0,2.0} 1.8 1.2 0.6 0.2 0.0 0.0 0.4396 0.4689 0.48590. 4884 0.4858 0.2429 0.3918 0.4290 0.4635 0.4805 0.4858 0.2429 12.20 9.30 4.83 1.64 0.0 0.0 4. Two equal values are higher & other three values are equally lower {0.28, 0.28, 0.28, 2.08, 2.08} {0.52, 0.52, 0.52, 1.72, 1.72} {0.76, 0.76, 0.76, 1.36, 1.36} {0.92, 0.92, 0.92, 1.12, 1.12} 1.8 1.2 0.6 0.2 0.391 0.446 0.485 0.491 0.319 0.379 0.444 0.477 22.3 17.31 9.31 3.04 5. Two equal values are lower & other three values are equally higher {0.04, 0.04, 1.64, 1.64, 1.64} {0.40, 0.40, 1.40, 1.40, 1.40} {0.64, 0.64, 1.24, 1.24, 1.24} {0.88, 0.88, 1.08, 1.08, 1.08} 1.6 1.0 0.6 0.2 0.4078 0.4556 0.4788 0.4885 0.343 0.4 0.4416 0.4571 18.89 13.90 8.42 2.82 6. Four equal values are higher & other one value is lower {0.04, 1.24, 1.24, 1.24, 1.24} {0.36, 1.16, 1.16, 1.16, 1.16} {0.84, 1.04, 1.04, 1.04, 1.04} 1.2 0.8 0.2 0.4501 0.4727 0.4879 0.4151 0.443 0.4795 8.43 6.70 1.75 7. Four equal values are lower & other one value is higher {0.64, 0.64, 0.64, 0.64, 2.44} {0.76, 0.76, 0.76, 0.76, 1.96} {0.88, 0.88, 0.88, 0.88, 1.48} {0.96, 0.96, 0.96, 0.96, 1.16} 1.8 1.2 0.6 0.2 0.3799 0.4331 0.4763 0.4874 0.3691 0.4165 0.4599 0.48 2.93 3.99 3.57 1.54 Fig. 2. Degree of imbalance Vs % Different E The behavior of D Vs E is seen in fig2. It is seen that for a certain kind of imbalance and in general, the effect of production rate increases as degree of imbalance increases initially and than decrease. At a particular level of degree of imbalance increases, the effect of production rate is increases because the mean operation time on the station is not much higher than other station in the production line. Therefore the one station mean operating time effect the other station mean operating time. Therefore best and worst ordering have high difference on production rate. However it is also evident that the degree of imbalance has no specific universal relationship with the effect on the production rate.
  • 6. The Effect of Imbalance on the Performance of unpaced production line… DOI: 10.9790/1684-12111419 www.iosrjournals.org 19 | Page The case when the effect become very low at very high degree of imbalance can be understood by the following reasoning. When D is very high, one of the station has very large mean operation time compared to all others. This makes the station with the maximum mean operation time so slow that other station have hardly any effect on production rate. Therefore the best and worst orderings have very little difference in production rate. V. Conclusion The ordering of operation, by assigning different operations of the same data set to different station of the line, affects the production rate significantly. The percent difference between best and worst ordering was sometimes as high as 22%. It may be concluded that, in general, the effect of ordering increases as the degree of imbalance increases from low to moderate. But as the degree of imbalance increase further the effect starts stabilizing and then decrease. At very high degree of imbalance the effect of ordering is minimal. This is due to the fact that when degree of imbalance is high, one station becomes so slow that other station have very tittle effect on Production rate thus ordering also has little effect. The general trends of the variation of production rate with degree of imbalance was similar for all kind of imbalance. However, it is observed that the degree of imbalance is not a very good parameter to assess the effect of ordering on production rate universally. Nevertheless, in a specific kind of imbalance it may be used as an effective measure. References [1]. Hiller. F.S. and Boling, R.W (1966). “ the effect of some design factor on the efficiency of production line with variable operation time” J. Ind. Engg. , 17, 651 [2]. E1 – Rayah. T.E. (1979), “ the efficiency of balanced and unbalanced production line.” Int. J. Prod. Res. 17,61 [3]. Yasmashina, H, , and Okamura, K(1983). “ Analysis of in process buffer for multistage transfer line system.” Int. J.Prod. Res. 21, 183. [4]. Kunter, S. Akbay (1996), “ using simulation optimization to find the best solution,” Ind. Engg. Solution 28, No 5. [5]. R. Pike & G.F. Martin (1994) the bowl phenomenon in unpaced line to large production”. Int. J.Pood. Res. 32,483. [6]. R.A. Johnson “ Probability Densities” Proceeding of the Seminar on „Probability and statistics for engineers‟ New Delhi, 1996, Chapter 5, P137 [7]. E. Balagrusamy „Numerical Methods‟ tata Mc Graw Hill, New Delhi, 1999.