Javier Garcia - Verdugo Sanchez - Six Sigma Training - W4 Lean Intro
•
1 like•423 views

Javier Garcia - Verdugo Sanchez Six Sigma Training. Week 4. Lean Manufacturing introduction.

Recommended
Recommended
More Related Content
What's hot
What's hot (20)
Similar to Javier Garcia - Verdugo Sanchez - Six Sigma Training - W4 Lean Intro
Similar to Javier Garcia - Verdugo Sanchez - Six Sigma Training - W4 Lean Intro (20)
More from J. García - Verdugo
More from J. García - Verdugo (20)
Recently uploaded
Recently uploaded (20)
Javier Garcia - Verdugo Sanchez - Six Sigma Training - W4 Lean Intro
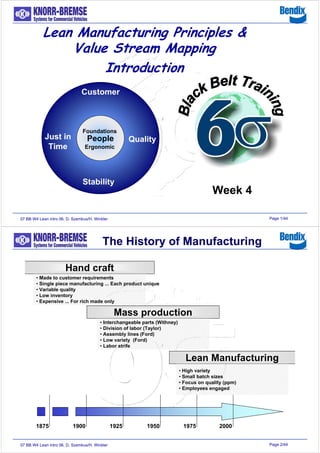
- 1. Page 1/4407 BB W4 Lean intro 06, D. Szemkus/H. Winkler Lean Manufacturing Principles & Value Stream Mapping Introduction People Customer Just in Time Quality Stability Foundations Ergonomic Week 4 Page 2/4407 BB W4 Lean intro 06, D. Szemkus/H. Winkler Hand craft Mass production Lean Manufacturing • Interchangeable parts (Withney) • Division of labor (Taylor) • Assembly lines (Ford) • Low variety (Ford) • Labor strife • High variety • Small batch sizes • Focus on quality (ppm) • Employees engaged 1875 1900 1925 1950 1975 2000 • Made to customer requirements • Single piece manufacturing ... Each product unique • Variable quality • Low inventory • Expensive ... For rich made only The History of Manufacturing
- 2. Page 3/4407 BB W4 Lean intro 06, D. Szemkus/H. Winkler • A way of work organization, developed in Japan, which integrates the knowledge and performance potential of the employees into the production process. • The rigid work sharing will be converted into group work. The employees will get a stronger insight to the problems and the process flows. They will be motivated to work on problem solutions. • Process optimization will be developed and realized by the employees within the groups. Lean Manufacturing Page 4/4407 BB W4 Lean intro 06, D. Szemkus/H. Winkler • The idea has been developed in Japan, the name is given in the US. • Lean is the manufacturing system of the Japanese automotive industry. It needs less production factors than the traditional mass manufacturing. • With other words, less than half of the development time and less than the half of inventories capacities are sufficient for the production. At the same time more product variety with higher quality levels can be offered. The Idea Lean Manufacturing
- 3. Page 5/4407 BB W4 Lean intro 06, D. Szemkus/H. Winkler • The success of the Lean Manufacturing idea is founded on the involvement of the employees with teamwork. • Employees of all areas of the company can be integrated in teams, e.g. design, research, engineering, accounting, sales etc.. Depending on the project, the scope can be planning process, accounting, manufacturing or sales process. • Every employee takes over responsibility for his task. Employee motivation and identification increases while the defect rate is decreasing. The Success Factors Page 6/4407 BB W4 Lean intro 06, D. Szemkus/H. Winkler Create valuableCreate valuable Products &Products & PerformancePerformance for the Customerfor the Customer EfficientEfficient Processes withoutProcesses without Waiting TimeWaiting Time Eliminate DefectsEliminate Defects & reduce Variability& reduce Variability Optimized Products and Solutions LEANING Price On time SIGMA / DPMO DESIGNING CapableValue Lean MASTERING The Six Sigma Elements Sales Customer Development Logistic Production Quality Finance Supplier Six Sigma and Lean Complement Each Other
- 4. Page 7/4407 BB W4 Lean intro 06, D. Szemkus/H. Winkler Customer Oriented through Business Process ManagementCustomer Oriented through Business Process Management FinanceMfg LogisticsSales Materials Mgmt Customer Service Strategy, Business Plan, ObjectivesStrategy, Business Plan, ObjectivesStrategy, Business Plan, Objectives CustomerValueMeasures JustinTime, ShareofPurchase CustomerValueMeasuresCustomerValueMeasures JustinTime,JustinTime, ShareofPurchaseShareofPurchase SupplierMeasures Defective,Delivery, TotalCost SupplierMeasuresSupplierMeasures Defective,Delivery,Defective,Delivery, TotalCostTotalCost Application (Product) Development Order to Delivery Produce Products Credit and Collections Financial Performance Measures Net Income, Productivity, Cash Flow Financial Performance MeasuresFinancial Performance Measures Net Income, Productivity, Cash FlowNet Income, Productivity, Cash Flow Financial Success CustomerSatisfactionCustomerSatisfactionCustomerSatisfaction Financial Success and Customer Satisfaction are crossing. Experience shows that there is friction in the daily business Business Processes vs. Organization Page 8/4407 BB W4 Lean intro 06, D. Szemkus/H. Winkler A Successful Way with DMAIC MeasureAnalysis Measurable Success DefineImprove Control Metrics FinancesCustomer Vision Strategy Analysis Action Control Employees Processes Success through an integrated Approach… Larry Bossidy
- 5. Page 9/4407 BB W4 Lean intro 06, D. Szemkus/H. Winkler The philosophy of lean manufacturing or of a production system is based on 5 Principles: 1) Define values in the eyes of the customer 2) Identify the value stream and eliminate waste 3) Make flow at the pull of the customer 4) Involve and empower the employees 5) Continuously improvement in pursuit of perfection The Lean Principles Page 10/4407 BB W4 Lean intro 06, D. Szemkus/H. Winkler Define Phase Project description and selection of the project leader •Project selection in respect to product or service •Scorecard •Rating of customer needs •Value Chain Diagram; SIPOC •Portfolio analysis in respect to competences •Deficiency analysis to the competitors •Team building Measure Phase Determination of the baseline Value Stream Mapping (supported by other process maps) Cycle times / process times Information flow Baseline elements: cycle times, change over times, maintenance, equipment availability and reliability, number of product variants, theoretical work times, transport distances for products and personal material yield, first time yield (RTY), WIP, batch sizes, monuments, etc. The Phases in a Lean Project
- 6. Page 11/4407 BB W4 Lean intro 06, D. Szemkus/H. Winkler Analysis + Improve Phase Value Stream Mapping (Analysis of the Baseline) Value Stream Design (Definition of the desired process flow) Compilation of reasonable metrics Definition of necessary steps Elimination of rework Optimization of material flow Pull vs. Push; KanBan; One Piece Flow; 5S; Poka Yoke, Autonomation, Production Smoothing, Waste reduction Immediately implementation of improvements Control Phase Sustain improvements Regular review of the metrics Control plan Visual controls The Phases in a Lean Project Page 12/4407 BB W4 Lean intro 06, D. Szemkus/H. Winkler Lean Manufacturing Elements Autonomation Mistake Proofing Six Sigma Visual Controls Standard Work TPM VOC, QFD, Takt Material Systems Production Smoothing Flow / Pull People Customer Just in Time Quality Stability Foundations Ergonomic
- 7. Page 13/4407 BB W4 Lean intro 06, D. Szemkus/H. Winkler Elimination of Waste 7 types of waste (Taiichi Ohno) 1. Due to overproduction 2. Due to waiting and idle 3. Due to transportation 4. Due to inefficient processes 5. Due to unnecessary inventory 6. Due to motion 7. Due to defects (rework) Waste = Activities which are conducted in an organization but don’t add value to the final product (NVA = non value adding). Waste = Activities which are conducted in an organization but don’t add value to the final product (NVA = non value adding). Page 14/4407 BB W4 Lean intro 06, D. Szemkus/H. Winkler After every process step the product will be stored and not transferred to the next step until a certain quantity have been manufactured. After every process step the product will be stored and not transferred to the next step until a certain quantity have been manufactured. „Batch“ Production Terms in the Lean Environment
- 8. Page 15/4407 BB W4 Lean intro 06, D. Szemkus/H. Winkler „Single Piece Flow“ A product will be consistently transferred, piece by piece, from one process step to the next. A product will be consistently transferred, piece by piece, from one process step to the next. Terms in the Lean Environment Page 16/4407 BB W4 Lean intro 06, D. Szemkus/H. Winkler „Just in Time“ Means: At the right time the right quantity the right product, material, information at the right location Terms in the Lean Environment
- 9. Page 17/4407 BB W4 Lean intro 06, D. Szemkus/H. Winkler • It is a method to control the material flow in the manufacturing area • The needed stocks are close to the manufacturing • The number of stocks will be continuously adjusted regarding the changing needs. Not too much, not too less. „KanBan“ KanBan means card signal Terms in the Lean Environment Page 18/4407 BB W4 Lean intro 06, D. Szemkus/H. Winkler Available hours Customer demand =Takt „Takt Time“ Is the calculated time frame which is needed to process a product or a information in order to fulfill the customer requirements Calculation of Takt time: Terms in the Lean Environment
- 10. Page 19/4407 BB W4 Lean intro 06, D. Szemkus/H. Winkler „Cycle Time“ Is the time which is need to perform a work step / process Load Chart 0 1 2 3 4 5 6 7 Arbeitsschritt1 Arbeitsschritt2 Arbeitsschritt3 Arbeitsschritt4 Arbeitsschritt5 Arbeitsschritt6 Arbeitsschritt7 Arbeitsschritt8 Arbeitsschritt9 Arbeitsschritt10 Cycle Takt Cycle Time & Takt Time Terms in the Lean Environment Page 20/4407 BB W4 Lean intro 06, D. Szemkus/H. Winkler Customer Customer „Pull“ from the customer „Push“ to the customer „Push - Pull“ Lean Principle 3: Make flow at the pull of the customer Lean Principle 3: Make flow at the pull of the customer Terms in the Lean Environment
- 11. Page 21/4407 BB W4 Lean intro 06, D. Szemkus/H. Winkler „Visual Controls“ Techniques for a simple control of the production processes and tools to identify fast process deviation * 5S ... cleaning and organization * Andon ... signals * KanBan ... signals * floor markings * Information & metric boards * Work instructions Terms in the Lean Environment Page 22/4407 BB W4 Lean intro 06, D. Szemkus/H. Winkler „5 S “ A systematic method in five steps to organize the work place 1S = “Seiri” = Sorting, put not needed material away 2S = “Seiton” = Storage: a defined place for everything 3S = “Seiso” = Shining: dispose dirt, waste, oil etc. 4S = “Seketsu”= Standardizing: Al rooms and places equal 5S = “Shitsuke” = Sustaining: Regular reviews, control plans Terms in the Lean Environment
- 12. Page 23/4407 BB W4 Lean intro 06, D. Szemkus/H. Winkler •Work steps •Safety •Visual display •Timing •Takt time •A tool for manufacturing of quality products •Basis for continues process improvements •Documentation of a standard for a work process •Own responsibilities of work groups „Standard Work“ Standard Work means a standardized work process which includes the following elements Terms in the Lean Environment Page 24/4407 BB W4 Lean intro 06, D. Szemkus/H. Winkler Is a method for process optimization. A series of one after the other following activities for improvements in a predefined area. This kind of activities can be performed in a time limited workshop (e.g. 5 days) or over a longer time in several steps. „Kaizen“ (KAI = change; ZEN = good) Terms in the Lean Environment
- 13. Page 25/4407 BB W4 Lean intro 06, D. Szemkus/H. Winkler „Poka Yoke“ A method to design processes in that way, that the occurrence of defects are not possible anymore. This applies to production as well for administration. • Equipment can be designed in a way that no defect parts will be accepted in the process • Another example, form sheets for creditors and debtors have different colors Already during the design phase it has to be evaluated what can go wrong and what kind of devices are necessary to avoid that! Already during the design phase it has to be evaluated what can go wrong and what kind of devices are necessary to avoid that! Terms in the Lean Environment Page 26/4407 BB W4 Lean intro 06, D. Szemkus/H. Winkler „Monument“ Under monument we understand large and not moveable equipments or work processes. The organizational and / or technical effort for a simplification or change would be not acceptable. Example: • Large cleaning systems • Storage equipment • Production equipment In a lean environment monuments are undesired, but depending on the manufacturing process they can be economical reasonable. In a lean environment monuments are undesired, but depending on the manufacturing process they can be economical reasonable. Terms in the Lean Environment
- 14. Page 27/4407 BB W4 Lean intro 06, D. Szemkus/H. Winkler „Spaghetti Chart“ Spaghetti Charts displays the material and information flow between buildings and areas on the site. A more detailed illustration of the process is the method Value Stream Mapping Spaghetti Charts displays the material and information flow between buildings and areas on the site. A more detailed illustration of the process is the method Value Stream Mapping Bldg. A Area C Bldg. 2 Bldg. 1 Area B in out Terms in the Lean Environment Page 28/4407 BB W4 Lean intro 06, D. Szemkus/H. Winkler Value Stream Mapping, What is it? Value Stream Mapping is a method for process analysis and optimization in production and administration: - Identification/Definition of a process and/or a product group - Mapping of the current state process (as-is flow) - Development of a future (desired) process flow - Development and implementation of change actions Value Stream Mapping gives you an overview of the entire values stream from the supplier to the customer in a simple and fast way. Mainly lead times and process interfaces will be drawn. In combination with the actual process cycle times the potential improvement opportunities are linked due to reduction of waiting times. Further potentials will be identified due to the observation of transport, storage, WIP, defect rates, etc..
- 15. Page 29/4407 BB W4 Lean intro 06, D. Szemkus/H. Winkler Origin of the Method Value Stream Mapping is a central part of the Toyota Production System (TPS). Within the introduction of Lean Production (Lean Manufacturing) this is an important element for process understanding. The process description is for the Six Sigma strategy an essential need to recognize the critical input factors. Value Stream Mapping can be also included in Six Sigma projects. Mike Rother researched the value stream methodology and published it in his book „Learning to See“ (German version „Sehen lernen“). Page 30/4407 BB W4 Lean intro 06, D. Szemkus/H. Winkler D M A I C X bar + Stdev. „7 cycle Analysis“ Actual data! Definition: •Process & Borders •Product Groups As-Is Process mapping Metric definition Baseline •Value stream Responsible •Employee Support + Training Lean/GB As-Is Process Value added / non value added Desired Process - without waste & over production Communication & Implementation Presentation & Approval by the Management Comparison As-Is and New Process Improvements statistically significant? Continuous Process Improvement Additional projects Lean/6S For example: •Lead times •Change over times •Machine available •Store quantities •Customer requirements: •Order quantity •Lot sizes •Order cycles •Cycle times •Waiting times •Capacities (Employees per step) •Transport (Distances + Times) •WIP •Quality •Scrap •Packaging •Transport, etc. Material + Information The consistent Strategy
- 16. Page 31/4407 BB W4 Lean intro 06, D. Szemkus/H. Winkler The first Steps… The complete value chain from the supplier through the customer will be analyzed. Depending on the company or for simplification certain process borders (start / end) can be defined. A segment or a group of products which follow similar process steps will be analyzed. A product can be also a service! The material and the information flow will be mapped . Value stream mapping is a task across functional borders, therefore a responsible person is needed for this task. This person is responsible for the understanding and the subsequent implementation of the process changes. It is beneficial for this task, if the responsible person belongs to a higher management level. Page 32/4407 BB W4 Lean intro 06, D. Szemkus/H. Winkler Mapping the Current State Process (Baseline) After the definition of the process, the border, a segment or product group, the achievable goals and a responsible person the current process will be mapped and analyzed from “ramp to ramp”. It is recommended, that the process will be followed “upstream” that means starting at shipping or store. All important information will be collected and documented. The actual process metrics will be stored. Depending on the process steps itself or the type of data, it is may be necessary to measure some metrics several times „7 cycle analysis“. The advantage is, that we receive beside the average values also information about the variation. Helpful for the development of optimized solutions, especial at competing (oppositional) targets. The first mapping of the value stream should be sketched by hand with paper and pencil.
- 17. Page 33/4407 BB W4 Lean intro 06, D. Szemkus/H. Winkler Supplier AG Final assembly 18400 pieces./month -12000"L" -6400"R" Container = 20 pieces 2 Shifts Raw material 5,2 days 4800 "L" 2400 "R" 1000 "L" 500 "R" 850 "L" 460 "R" 700 "L" 340 "R" 1200 "L" 580 "R" CT = 2 sec CT = 35 sec CT = 40 sec CT = 62 sec CT = 35 sec CO = 1 h CO = 10 Min CO = 10 Min CO = Ø CO = Ø Machine availability = 82 % Machine availability = 100 % Machine availability = 85 % Machine availability = 100 % Machine availability = 100 % 27.600 sec. available 27.600 sec. available 27.600 sec. available 27.600 sec. available 27.600 sec. available 1 Shift 2 Shifts 2 Shifts 2 Shifts 2 Shifts 5,2 days 7,83 days 1,63 days 1,42 days 1,13 days 1,93 days 2 sec 35 sec 40 sec 62 sec 35 sec Efficiency = 0,0165% Total CT= 174 sec. Lead time = 19,14 days Process 1 1 Process 2a 1 Process 2b 1 Process 3a 1 Process 3b 1 Shipping Provision daily delivery plan Production Planning PPS 90/60/30 days Forecast weekly planning Orders daily 6 weeks Forecast One Fax per Week Tu. and Th. 1300 m Raw material 1 per day Example: Current State Process (Baseline) Page 34/4407 BB W4 Lean intro 06, D. Szemkus/H. Winkler Raw material 5,2 days 4800 "L" 2400 "R" CT = 2 sec CO = 1 h Machine availability = 82 % 27.600 sec. available 1 Shift 5,2 days 7,83 days 2 sec Process 1 1 Process 1 1 Process 2a 14800 pieces „L“ 2400 pieces „R“ Process Step 1 This process is producing several parts for different products. •E.g. automatic press with automatic coating •Stock quantity today: • 4800 finished parts „Left“ • 2400 finished parts „Right“ • 5,2 days raw material •One worker •Cycle time: 2 seconds •Change over time: 1 hour •Machine availability: 82% Pusch-System Explanation of the Metrics
- 18. Page 35/4407 BB W4 Lean intro 06, D. Szemkus/H. Winkler Calculation of the Lead Time 5,2 days lead time results from the information„ 5,2 days raw material“ 2 seconds out of the cycle time for the process step The cycle time of each process step should be in line with the takt time.. Estimation of the inventory lead time based on the takt time. The Takt Time is the calculated time which is needed to process a product or a information to meet the customer demand. Raw material 5,2 days 4800 "L" 2400 "R" CT = 2 sec CO = 1 h Machine availability = 82 % 27.600 sec. available 1 Shift 5,2 days 7,83 days 2 sec Process 1 1 Page 36/4407 BB W4 Lean intro 06, D. Szemkus/H. Winkler Available Working Time Customer Demand =Takt Time Working time: 20 days per month 2 shifts in all production areas 8 hours per shift, if necessary overtime Two 10 minutes break per shift During the breaks manually process are stopped Customer demand: 18.400 pieces per month 12.000 pieces per month „Left“ 6.400 pieces pro month „Right“ Customer works with 2 shifts Shipping container with 20 finished parts per container The customer orders are based on container quantity (several container per order) Delivery to customer on daily basis per truck Takt time = (8 h) – (2 x 10 min) / shift 18.400 pieces / 20 days / month / 2shifts/ day / shift 460 min / shift 460 pieces / shift 27.600 sec / shift 460 pieces / shift Takt time = 60 sec / piece Takt time = Takt time = Calculation of the Takt Time
- 19. Page 37/4407 BB W4 Lean intro 06, D. Szemkus/H. Winkler Estimation of the Inventory Lead Time Takt time = 60 sec/piece -> 60 pieces per hour 2 shifts/day with 40 minutes break -> 15,3 hours/day for production Therefore: 920 pieces can be produced per day! Inventory lead time = 4.600 pieces + 2.400 pieces 920 pieces/day The inventory lead time can be calculated based on the takt time. It is also possible to measure the actual inventory lead times during the Baseline which will be used for the calculation of the total lead time. (depends on the process, e.g. single piece manufacturing) Inventory lead time = 7,83 days Raw material 5,2 days 4800 "L" 2400 "R" CT = 2 sec CO = 1 h Machine availability = 82 % 27.600 sec. available 1 Shift 5,2 days 7,83 days 2 sec Process 1 1 Page 38/4407 BB W4 Lean intro 06, D. Szemkus/H. Winkler Efficiency = 0,0165% Total CT= 174 sec. Lead time = 19,14 days Process step Inventory (days) Cycle time (seconds) Lead time (days) 1 5,2 5,2 2 2 0,000036 3 7,83 7,83 4 35 0,000634 5 1,63 1,63 6 40 0,000724 7 1,42 1,42 8 62 0,001123 9 1,13 1,13 10 35 0,000634 11 1,93 1,93 Sum: 19,140 174 19,143 Lead time (LT): 19,1 Cycle time in days: 0,003151 Efficiency (Cycle time / LT) 0,0001646 Efficiency in % 0,0165% Total cycle time (process time) = 174 sec. Lead time = 19,1 days Efficiency = 0,0165 5,2 days 7,83 days 1,63 days 1,42 days 1,13 days 1,93 days 2 sec 35 sec 40 sec 62 sec 35 sec Calculation of the Total Lead Time
- 20. Page 39/4407 BB W4 Lean intro 06, D. Szemkus/H. Winkler Conclusion out of the Current State Analysis The process works with a push principle. Parts are produced which the customer don’t need at this time Between the process steps we generate a so called WIP (Work in Process) which needs to be stored! For this “between” inventory we need space between the machines. Each process step in the value stream can be considered as an island. If a process step produces defective parts you may recognize them in the following process step. The total cycle time (process time) is 174 seconds, the total lead time about 19 days. The time between purchasing/payment of the raw material and the payment of the final product is depending on the lead time high. Page 40/4407 BB W4 Lean intro 06, D. Szemkus/H. Winkler Guidelines for the creation of a future process 1. Produce according the takt time 2. Establish, where ever possible, a continuous production flow, in the ideal situation a „Single Piece Flow“ 3. Where there continuous flow is interrupted you can use a Supermarket-Pull System for production control. 4. The production control should be applied only at one process step in the value stream. 5. If you produce different products, try to distribute these products equally over the time (planed product mix). The balance will be controlled by the production control at the “pacesetter” process. 6. Define in your process small and even work portions. This “start pull” will be controlled by the production control in the “pacesetter” process. 7. Form the process in a way, that it is possible to produce “every part every day” (EPE), later every shift, etc.. Based on the 5 Lean principles the following guidelines will help to change the current process
- 21. Page 41/4407 BB W4 Lean intro 06, D. Szemkus/H. Winkler Example: Possible Future Process Supplier AG Final assembly 18400 pieces./month -12000"L" -6400"R" Container = 20 pieces 2 Shifts CT= 2 sec Takt 60 sec 2 days CO < 10 Min. CT = 55 sec CO = Ø Machine availability = 100 % 2 Shifts 1,5 days 1,5 days 2 days 2 sec 165 sec Total Cycle Time = 167 sec Lead Time = 5 days Process 1 Process 2a - 3b Shipping Provision Production Planning 90/60/30 days Forecast weekly planning Daily order 6 weeks Forecas Daily order 1 per day Raw material R O X O X 20 20 20 20 20 LL Process 2 Change Over Amount of work = 165 sec Process 2b Machine availability Raw material Lot Size Boxes Rawmaterial Daily Page 42/4407 BB W4 Lean intro 06, D. Szemkus/H. Winkler Overall, production and manufacturing processes in accordance to lean principles are an industrial revolution, which are not limited to the automotive production or to Japan. The consequences should be similar like the change in spring 1914. At that time in Detroit, Henry Ford replaced the hand craft production by an assembly line. Within some months the time effort for the assembly of major parts of a car were reduced from 750 to 90 minutes. Summary
- 22. Page 43/4407 BB W4 Lean intro 06, D. Szemkus/H. Winkler ModellModell PP ModellModell FF PI StagingStaging PI StagingStaging PI PI StagingStaging PI PIPI PI PI Work in process PI PI PI PI Bld.03 DisassyDisassy DisassyDisassy DisassyDisassy DisassyDisassy DisassyDisassy ReceivingReceiving DisassyDisassy DisassyDisassy DisassyDisassy DisassyDisassy DisassyDisassy DisassyDisassy DisassyDisassy DisassyDisassy DisassyDisassy DisassyDisassy DisassyDisassy DisassyDisassy ModellModell L 2L 2 ModellModell L 1L 1ModellModell SS DisassyDisassy Back Log Bld.06 DisassyDisassy DisassyDisassy DisassyDisassy DisassyDisassy DisassyDisassy DisassyDisassy Cleaning DisassyDisassy Example: Push System Page 44/4407 BB W4 Lean intro 06, D. Szemkus/H. Winkler Receiving Strip/Split GB LC Power Sect. UnpackUnpack Modell S Strip/ Split Receiving Strip/Split GB LC Power Sect. UnpackUnpack Modell L 1 Strip/ Split Receiving Strip/Split GB LC Power Sect. UnpackUnpack Modell L 2 Strip/ Split Receiving Strip/Split NC LC Power Sect. UnpackUnpack Modell P UnpackUnpack Modell F KANBAN CARD KANBAN CARD VISUAL CONTROL ANDON LIGTH Priorititationby ADMINTEAM S & L:B ld06 P & F:B ld.20A S & L:B ld 03 P & F:B ld.20A S & L:B ld 06 P & F:B ld.06 S & L:B ld 03 P & F:B ld.20A S & L:B ld 02 P & F:B ld.20A PIPI StagingStaging PIPI PIPI stagingstaging StagingStagingStagingStaging PIPI PIPI StagingStaging PIPI PIPIPIPI PIPI PIPI Kanban Buffer Work in process Receiving M2 M3 M4 M1 Strip Split Cleaning PIPI PIPI Example: Pull System