FEDERAL RESERVE BANK OF ST. LOUIS THE ROAD TO NORMAL
1 Understanding Monetary Trading
1. Johanes L. Sitanggang Company
Jakarta, Indonesia Global Economic and Monetary Policy Structure
Trading the Global Equilibrium
This report is Strictly Confidential and not authorized for distribution, copying, altering, modification and replication. If you are not intended recipient of the report, you shall return this
report and delete from your system.
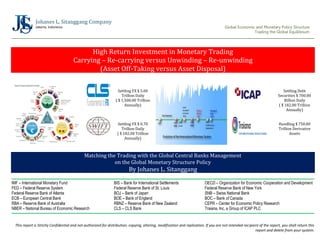
High Return Investment in Monetary Trading
Carrying – Re-carrying versus Unwinding – Re-unwinding
(Asset Off-Taking versus Asset Disposal)
Settling FX $ 5.00
Trillion Daily
( $ 1,500.00 Trillion
Annually)
Settling Debt
Securities $ 700.00
Billion Daily
( $ 182.00 Trillion
Annually)
Settling FX $ 0.70
Trillion Daily
( $ 182.00 Trillion
Annually)
Handling $ 750.00
Trillion Derivative
Assets
Matching the Trading with the Global Central Banks Management
on the Global Monetary Structure Policy
By Johanes L. Sitanggang
IMF – International Monetary Fund BIS – Bank for International Settlements OECD – Organization for Economic Cooperation and Development
FED – Federal Reserve System Federal Reserve Bank of St. Louis Federal Reserve Bank of New York
Federal Reserve Bank of Atlanta BOJ – Bank of Japan SNB – Swiss National Bank
ECB – European Central Bank BOE – Bank of England BOC – Bank of Canada
RBA – Reserve Bank of Australia RBNZ – Reserve Bank of New Zealand CEPR – Center for Economic Policy Research
NBER – National Bureau of Economic Research CLS – CLS Bank Traiana, Inc, a Group of ICAP PLC
2. Johanes L. Sitanggang Company
Jakarta, Indonesia Global Economic and Monetary Policy Structure
Trading the Global Equilibrium
This report is Strictly Confidential and not authorized for distribution, copying, altering, modification and replication. If you are not intended recipient of the report, you shall return this
report and delete from your system.
Background of Monetary Methodology
Before there was currency, nations traded goods directly, paying for one good by exchanging it for another. It was barter on a national scale. Because of its many advantages, money was eventually
created to facilitate trading. In the beginning, trading partners would use a common form of money to conduct their business, which was usually gold or silver. Then eventually the benefits of
paper currency became evident, but since each country issued its own currency, it wasn't very useful for international trading, since the purchasing power of each currency differed considerably
and could differ over time depending on how much currency the countries issued. Hence, foreign exchange history can be viewed as a series of solutions that allowed countries to issue their own
currency and to conduct their own monetary policy while also allowing international trade to be conducted by providing a means of exchanging one currency for another according to the
exchange rate between them, which was either agreed-upon or set by the market.
Money, Currency and Foreign Trade: One of the qualities that money requires is that it be scarce. If it were not, it would have no value as money. For instance, if ordinary stones were money,
then anyone could just pick some up off the ground and pay a merchant for his goods. But why would a merchant accept stones when he could just stoop down to pick up stones, too. He wouldn't
need to sell merchandise, or do anything at all, if he could just pick up some stones and use it for money. Everyone else would think similarly. Hence, there would be no economy, and nothing to
buy with the stones. Although many different items were used for money in the past, people eventually discovered that gold was the ideal material for money. It could not be manufactured or
printed, it was not easily mined, and it was difficult to find new sources of gold. That it was also the most ductile and malleable of metals made it easy to fashion into coins. But gold was heavy, and
how much a person could carry is severely limited, since a 10 dollar gold piece would be 10 times heavier than a 1 dollar gold piece. So governments decided that printed currency, usually
called bills or notes, was the solution. A 10 dollar bill, for instance, weighs just as much as 1 dollar bill or a 100 dollar bill. This was a good solution, but still had some problems. What would
prevent anybody from just printing money? Governments solved that problem by using secret methods of printing and passing harsh laws to punish anyone who would try. But what would
prevent the government from just printing more money to pay itself and others? Many governments have done that—Germany, after World War I, for instance. Consequently, their currency
become worthless. It took a wheelbarrow of cash to buy a loaf of bread. Germans were literally burning money to keep warm in the winter. Oftentimes, people in such economies turn to hard
currency, which is a trusted currency of a stable country, because nobody wants to buy or sell using currency that is continually devaluing. So obviously, there has to be some way to prevent
governments from just printing money, and the way that was done was to make it equal, by law, to something else that couldn't be easily made, printed, or found—gold.
The advantages of using money backed by gold were numerous: Since every country had gold, a natural material, and most people were familiar with it, it provided a common measure of
value. It helped keep inflation in check by keeping the money supply based on the gold standard limited, thus stabilizing economies. Inflation is the result of increasing supplies of money for a
given economic state. More money causes the price of everything to go up because it increases the demand for goods and services before the economy has time enough to expand its supply—so
prices go up. By tying the amount of currency to the amount of gold that a country possesses, it limits the amount of currency that can be printed.
Fixed Exchange Rate: Before there was significant trade between countries, there was little need for foreign exchange, and when there was a need, it was served by gold, since gold was used by
most of the major countries. However, as trade expanded, there was a need to exchange currency rather than gold because gold was heavy and difficult to transport. But how could different
countries equalize their currency in terms of another currency. This was achieved by equalizing all currencies in terms of the amount of gold that it represented—the gold-exchange standard.
Under this system, which prevailed from 1879 to 1934, the value of the major currencies was fixed in terms of how much gold for which they could be exchanged, and thus, they were fixed in
terms of every other currency.
One of the requirements that the countries adhering to the gold standard needed to follow was to maintain their money supply to a fixed quantity of gold, so the government could only issue more
money if it had obtained more gold. This requirement, of course, was to prevent countries from just printing money to pay foreigners, which had to be prevented because, otherwise, there could
be no foreign trade. Why would a trader accept currency for his goods if the country could just print more of it, thereby reducing the value of the currency that was already available, and thereby
reducing the value of the currency held by the trader?
A corollary of this requirement is that gold had to flow freely between different countries; otherwise no country could export more than they import, and vice versa, and still maintain its supply of
currency to the gold it held in stock. So if there was a net transfer of currency from one country to another, gold would have to follow. (Or, at least the ownership of it. The New York Federal
Reserve, for instance, held the gold of many countries, so countries could settle in gold by updating their accounts at the New York Fed.)
3. Johanes L. Sitanggang Company
Jakarta, Indonesia Global Economic and Monetary Policy Structure
Trading the Global Equilibrium
This report is Strictly Confidential and not authorized for distribution, copying, altering, modification and replication. If you are not intended recipient of the report, you shall return this
report and delete from your system.
The Collapse of The Gold Standard: The main problem with the gold standard was that if a country was not competitive in the world marketplace, it would lose more and more gold as more
goods were imported and less exported. With less gold in stock, the country would have to contract the money supply, which would hurt the country's economy. Less money in circulation reduces
employment, income, and output; more money increases employment, income, and output. This is the basis of modern monetary policy, which is implemented by central banks to stimulate a
sluggish economy by increasing the money supply or to reign in an overheating one by contracting the money supply.
During the 1930's, the world was in the throes of the Great Depression. Countries started abandoning the gold standard by reducing the amount of gold backing their currency so that they could
increase the money supply to stimulate their economies. This deliberate reduction of value is called a devaluation of currency. When some of the countries abandoned the gold standard, then it
just collapsed, for it was a system that could not work unless all of the trading countries agreed to it. Of course, at some point, something else would have to take its place; otherwise, there could
be no world trade—at least not in the quantities that were then occurring. As World War II was coming to a close, it was obvious that another system would be needed.
Bretton Woods and the Adjustable-Peg System: The leaders of the allied nations met at Bretton Woods, New Hampshire in 1944, to set up a better system of fixed exchange rates. The U.S.
dollar was fixed at $35 per ounce of gold and all other currencies were expressed in terms of dollars. This official fixed rate of exchange was known as the par value of currency (aka par of
exchange, par exchange rate).
However, to avoid making deleterious macroeconomic adjustments to maintain the exchange rate, the new system provided for an adjustable peg, that allowed the exchange rate to be altered
under specific circumstances. Thus, this Bretton Woods system was also known as the adjustable-peg system. To actuate this new system, the International Monetary Fund (IMF) was created.
Each country had to maintain an account at the IMF that was proportional to the country's population, volume of trade, and national income. One of the services provided by the IMF was to
provide accounts for each of the participating countries that held Special Drawing Rights (SDR), which were units of account that could be used to settle IMF transactions through the transference
of the SDRs. Although initially the SDR was pegged to gold, it is currently equalized to the weighted average of the currencies of the 5 largest IMF exporters. The new system required that each
country value its currency in terms of gold or the United States dollar, which, of course, fixed the exchange rate among all currencies. The countries were required to maintain the exchange rate to
within 1% of the peg, but, if special circumstances required, they could allow the exchange rate to fluctuate by up to 10%. However, if this was not adequate, then the country would have to seek
approval from the IMF board to change the exchange rate by more than 10%. This prevented countries from devaluing their currency for their own benefit.
To maintain the limits, a country could: (i) use official reserves, which is the foreign currency held by a country from a previous surplus., (ii) borrow from the IMF by borrowing the foreign currency,
and using its own currency as collateral, (iii) sell gold to a country for its currency. The Bretton Woods system began to weaken in the 1960s, when foreigners accumulated large amounts of U.S.
dollars from post World War II aid and sales of their exports in the United States. There were concerns as to whether the U.S. had enough gold to redeem all the dollars. With reserves of gold
falling steadily, the situation could not be sustained and the U.S. decided to abandon this system. In 1971, President Nixon announced that U.S. dollars would no longer be convertible into gold, so
the exchange rate was allowed to float. Because of the central role played by the United States, the Bretton Woods system could not be sustained. By 1973, this action led to the system of
managed floating exchange rates that exists today.
Managed Floating
Exchange Rates
4. Johanes L. Sitanggang Company
Jakarta, Indonesia Global Economic and Monetary Policy Structure
Trading the Global Equilibrium
This report is Strictly Confidential and not authorized for distribution, copying, altering, modification and replication. If you are not intended recipient of the report, you shall return this
report and delete from your system.
The Managed Floating Exchange Rate (Currency Band: Exchange Rate Target Zones): Managed floating exchange rates are rates that float, but are sometimes changed by countries, by having
their central banks intervene directly in the forex market, usually by buying or selling the currency that the country wants to influence, so that the exchange rate is changed by the new supply or
demand. However, direct intervention by the major countries has been rare. For instance, the Federal Reserve has only intervened 8 days in 1995, and only 2 days in the 10-year period 1996-
2006. Many smaller countries, however, either peg their currency to the United States dollar, or, like Singapore, peg it to a basket of currencies. The major benefit of the flexible floating exchange
rate is that it corrects imbalances automatically. If a country imports more than it exports, then its currency will decline in relation to the importing country's currency, which will make imports
more expensive and exports less expensive, thus reversing the imbalance, or at least mitigating it. It also helps to adjust the system when events happen that have a significant impact on the
balance of trade, such as the spike in oil prices in 1973-1974 and 1981-1983, or when countries experience significant recessions.
Another major benefit of the floating exchange rate is that it allows countries to manage their own economies through monetary policy, expanding the money supply to stimulate the economy, or
contracting it to rein in inflation. Indeed, the publication of significant changes in monetary policy, such as the raising or lowering of interest rates, by the major countries increases volatility in
their currencies, both before and after the news is published. Many traders stay out of the market during these times because of its unpredictability. Most major forex trading websites have a
calendar of these events for the currency pairs that they offer for trading. Before pegged systems were abandoned, it was feared that flexible exchange rates would diminish trade because of
unknown changes in the rate that could affect sales or projects that take time. However, this problem has been solved with FX forward contracts that eliminate any uncertainty about future
exchange rates.
The International Monetary Fund and the World Bank: The IMF has survived the demise of the Bretton Woods system. Today it loans money to developing countries or to those in crisis, or to
Communist countries changing over to capitalism. It can impose strict rules, if necessary, over the economies of the loan recipients to help them repay their debt. Another organization created by
the Bretton Woods Agreement—the International Bank for Reconstruction and Development (IBRD), or World Bank, has also survived. The World Bank's original purpose was to finance the
reconstruction of Europe and Asia after World War II. Today, the World Bank loans money, mostly to developing countries, for commercial and infrastructure projects, and the loans must be
backed by the country receiving the loans. It does not, however, compete with commercial banks.
The Exchange Rate Target Zone
After the demise of the Bretton Woods system of 'fixed but adjustable' exchange rates in the early 1970s, there followed a period of free floating characterised by a far greater degree of exchange
rate variability than had been generally anticipated (Williamson, 1985). The exchange rate mechanism of the European Monetary System established in 1979 was intended in part to avoid this
problem, by committing member states to taking suitable action to prevent cross-parities from straying outside some given, publicly-announced range, and Williamson's proposal for target zones
was explicitly aimed at preventing exchange rate misalignment among the principal industrial countries. Subsequently, the Louvre Accord struck between members of the Group of Seven in 1987
involved unpublished commitments designed to constrain fluctuation between the U.S. dollar and the currencies of its major trading partners (Funabashi, 1988).
Given the obvious practical importance of understanding the implications of such policy commitments for the economy in general and the exchange rate in particular, it is perhaps not surprising
that the seminal work by Krugman (1988, 1989) on exchange rate determination within a band, has aroused considerable interest. Under the assumption that the velocity of money follows a
Brownian motion process, he obtains an explicit solution for the exchange rate as a function of the fundamental, which shows that the presence of a commitment to intervene so as to defend the band
exerts a stabilising influence on the exchange rate even before any such intervention takes place.
Froot and Obstfeld (1989) note that Krugman's minimalist stochastic specification can be derived from a monetary model of exchange rates where prices are perfectly flexible and full
employment prevails, where international interest differentials match expected exchange rate changes and the exchange rate preserves purchasing power parity (cf. Mussa, 1976); and they show
that the behaviour of the rate inside a currency band can be obtained using results on regulated Brownian motion processes (cf. Harrison, I985). Using the same framework and techniques, Flood and
Garber (1989) indicate how the rate will respond to non- infinitesimal intervention; and Svensson (1989) examines the effect of bandwidth on the stochastic behaviour of interest rates. Klein (1989)
considers the effects of uncertainty about the width of the band. The monetary approach has proved attractive both because it yields explicit analytical solutions and allows direct application of
results on regulated Brownian motion to the study of currency bands. But it has been severely criticised largely for its reliance on price flexibility and on purchasing power parity as the essential
ingredients of exchange rate determination; Dornbusch (I987, I988).
5. Johanes L. Sitanggang Company
Jakarta, Indonesia Global Economic and Monetary Policy Structure
Trading the Global Equilibrium
This report is Strictly Confidential and not authorized for distribution, copying, altering, modification and replication. If you are not intended recipient of the report, you shall return this
report and delete from your system.
In advocating target zones for exchange rates, Williamson (I985) proposed that the monetary authorities in the major industrial countries be prepared to adjust the stance of monetary policy so as to
keep their real effective exchange rates within broad bands (of + 10 % around the equilibrium levels consistent with sustainable current account flows). It was intended that adjustments be
made only at the edges of these bands, however, so that monetary control could be aimed at domestic anti-inflationary objectives within these target zones.
Krugman and Miller (1993) point out, the original justification for constraining EMS exchange rates within a currency band was to reduce exchange rate fluctuations that were seen as
discouraging trade and investment between member countries. To the extent that this objective has been achieved, it would be expected to have had a negative impact on the profitability of any
trading rule that takes positions in the currencies of member countries. Currency band is a currency system that establishes a trading range that a currency's exchange rate can float between.
A currency band represents the price floor and ceiling within which the price of a given currency can trade, and is like a hybrid of a fixed exchange rate and a floating exchange rate. The currency band
restricts how much the price can move relative to a reference currency or currencies. If the value of the currency begins trading outside the band, then the country of that currency will usually revert to
a fixed exchange rate. This usually stabilizes the currency's price back within the band.
A target zone attemps to limit the movement of an exchange rate, avoiding the pitfalls of both a pegged rate and a free floating rate. The European Monetary System was the prime example. An
elegant model of Paul Krugman demonstrates that in theory a target zone does indeed stabilize and exchange rate. An exchange rate target zone is a scheme intended to limit the flexibility of an
exchange rate without going as far as fixing or pegging the value one currency against another. It is a “band”, or “zone”, of values for the exchange rate, around a central or target rate. Within the
zone, the exchange rate is allowed to fluctuate freely without any intervention from the authorities. At the edge of the band, and outside, if the rate strays there, there is more vigirous intervention
to keep the rate within, or return it to, the band.
There are many varieties of target zones. The edges may be hard of soft. It may be defined in terms of nominal or real exchange rates. The central rate – or the target – may be either constant
overtime, possibly with provision for occasional discrete changes, or it may be adjusted continuously. The band may be narrow or wide. Under the EMS, member states were initially required to
keep their bilateral exchange rates within a band +/- 2.25 % around the grid of central parities. Member countries could adjust the central parities accosionally by mutual agreement when
perceived misalignments has built-up. The system was unable to withstand it and the bands were widened to 15 % in 1992 but they narrowed again in 1999.
The uses of target zones sprang from a desire to avoid the pithfalls of a fixed rates and free floating. Under the fixed exchange rates of the Bretton Wood Systems, exchange rate misalignments had
become progressively worse as inflation rates diverged, and weak currency countries put off devaluation. Under the floating exchange rates, exchange rate fluctuated excessively, unrelated to
fundamentals like relative price levels and current accounts. The “disconnect” between exchange rates and economic fundamentals has been confirmed by widespread experience and has become
a central tenet of international macroeconomics.
The EMS was intended to allow exchange rates to offset inflation differentials among members. Realignments were to be sufficiently timely to avoid giving the markets as one way bet. The bands
were intended to enable the markets to determine exchange rate movements without official intervention for most of the time, at the same as discouraging destabilizing speculation. The questions of
how target zones might work in theory, whether they work in practice as the theory predicted, and whether they did indeed cut exchange fluctuations, have generated enermous amount of research.
The key theoritical contribution is that of Krugman 1991. He showed that a fully credible target zone would reduce the volatility of an exchange rate and reduces its sensitivity to fundamentals.
His theoritical model assumes a monetary theory of the exchange rate for a small open economy in a world of perpectly flexible prices and perfect capital mobility, in which purchasing power
parity and uncovered interest parity hold good. Then the log of the exchange rate can be expressed as a function its own anticipated rate of change overtime and a driving fundamental. The
parameter denotes the semi-elasticity of money demand with respect to interest rate. The fundamental reflects money supply and demand. He considers a stochastic model in continuous time, in
which the fundamental follows Brownian motions, the continuous-time analogue of a random walk. Using stochastic calculus and methods widely used in the theory of options pricing, Krugman
shows that the exchange rate is related to the driving fundamental. Krugman’s analysis establishes that the exchange rate within the target zone enjoys the “bias in the band” or the “honeymoon
effect”.
6. Johanes L. Sitanggang Company
Jakarta, Indonesia Global Economic and Monetary Policy Structure
Trading the Global Equilibrium
This report is Strictly Confidential and not authorized for distribution, copying, altering, modification and replication. If you are not intended recipient of the report, you shall return this
report and delete from your system.
MONETARY THEORY AND PRACTICE OF THE MANAGED-FREE FLOATING RATE REGIME OF THE GLOBAL MONETARY SYSTEM
Responding the World of Global Free Trade Era with Free-Mobility
Upper Ceiling - Currency Band Theory: Paul Robin Krugman
Equilibrium State
Disequilibrium State
E
Upper Ceiling – Currency Band Theory: Paul Robin Krugman
Disequilibrium State
Lower Ceiling - Currency Band Theory: Paul Robin Krugman
Out
Of
Band Equilibrium State
Lower Ceiling – Currency Band Theory: Paul Robin Krugman
Out
Of
Band
Central Banks’
Estimated ATWR
(Turning Point) at
Estimated Lower
Medium-Term Price
Stability Band Level
Actual ATWR
(Collective Turning
Point) at Actual Lower
Medium-Term Price
Stability Band Level:
Johanes L. Sitanggang
Central Banks’
Estimated ATWR
(Turning Point) at
Estimated Upper
Short-Term Price
Stability Band Level:
Become Upper
Medium-Term Price
Stability Band Level
Actual ATWR
(Collective Turning
Point) at Actual
Upper Short-Term
Price Stability Band
Level: Become
Upper Medium-
Term Price Stability
Band Level: Johanes
L. Sitanggang
Equilibrium
Exchange Rate
Theory:
Williamsons
Medium-Term
Price Stability
Band: Global
Central Banks
Reflexivity Theory:
Disequilibrium to
Equilibrium
Trading – Negative
Interest Rate
Differential: George
Soros
Central Banks’
Estimated ATWR
(Turning Point) at
Estimated Lower
Medium-Term Price
Stability Band Level
Actual ATWR (Collective
Turning Point) at Actual
Lower Medium-Term
Price Stability Band Level:
Johanes L. Sitanggang
Reflexivity
Theory:
Disequilibrium to
Equilibrium
Trading –
Positive Interest
Rate Differential:
George Soros
Exchange Rate
Target Zone
Theory:
Williamsons
Central Banking Market
Sterilization Theory –
International Reserve
Management
Short-Term Price
Stability Band:
Global Central
Banks
Medium-Term
Price Stability
Band: Global
Central Banks
Price Elasticity Measurement at
Turning for Entry Rate and Risk
Management: Johanes L. Sitanggang
Price Elasticity Measurement at
Turning for Entry Rate and Risk
Management: Johanes L. Sitanggang
7. Johanes L. Sitanggang Company
Jakarta, Indonesia Global Economic and Monetary Policy Structure
Trading the Global Equilibrium
This report is Strictly Confidential and not authorized for distribution, copying, altering, modification and replication. If you are not intended recipient of the report, you shall return this
report and delete from your system.
Theories in Practice
A Johanes L. Sitanggang’s Theories and Equations Development
Asset Disposal
Unwinding
Asset Off-Taking
Carrying (Carry
Trading)
Lower Short-Term Price
Stability Level (Carrying
Currency Pairs)
Price Elasticity at Turning Lower Medium-Term Price
Stability Level (Unwinding
Currency Pairs)
Price Elasticity at Turning
Assessment and
Measurement of
Market Entry
Rate Timing
Assessment and
Measurement of
Market Exit Rate
Timing
Initial Risk
Assumed to Risk
Free Trading
Management
8. Johanes L. Sitanggang Company
Jakarta, Indonesia Global Economic and Monetary Policy Structure
Trading the Global Equilibrium
This report is Strictly Confidential and not authorized for distribution, copying, altering, modification and replication. If you are not intended recipient of the report, you shall return this
report and delete from your system.
High Return Investment at Manageable Risk in FX Margined Price Stability Band Levels Trading
By Johanes L. Sitanggang
Price stability band levels trading is specifically to trade based on the price stability band levels of exchange rates managed by the global central banks
regulated by the IMF in accordance to the global monetary system architect. It is a monetary method and not fundamental or technical methods as widely
published and available in the market.
By the policy and based on the mandates, the global central banks manage the exchange rate price stability to match the global economic stability, financial and
banking stability (global equilibrium – Federal Reserve Bank of St. Louis).
The global exchange rate price stability is medium, short and long-term price stabilities. The medium-term price stability is based on the theory of equilibrium
exchange rates (by Williamsons), exchange rate target zones (by Williamsons) and currency band theory (by Krugman). It is the agreed width of band or
exchange rate target zone for the global central banks to manage the price stability to be fluctuated (lower and upper ceiling). Global monetarist theoretically
suggest 10.00 % but in practice can be as wide as 15.00 % and could be more by matching the global economic, financial and banking stabilities. Recently,
Singapore Monetary Authority decided for 20.00 %.
Global market players may over reacted on the exchange rates and to cause excessive volatility and to move out of the lower or upper ceiling of the bands. This
is responded by the global central banks by undertaking central banking market sterilization to return the exchange rates to move into interior the bands. This
market sterilization to establish “short-term price stability” and sterilization could be undertaken up to the central band/central parity of the medium-term
price stability band levels, thus the width could 50.00 % from the width of the medium-term price stability levels, according to inter-central bank consensus.
Medium-term price stability is “aligning” and “re-aligning” and “continuously realignment” by matching the global economic, financial and banking stabilities to
establish “long-term price stability”. The sustainability and manageability of the target zone rely on the credibility of the global central banks to manage
(Federal Reserve Bank of St. Louis, Federal Reserve Bank of New York).
It can be concluded, the medium-term price stability of the exchange rates is the primary stability to be managed by the global central banks (very often stated
by ECB’s president Draghi and Fed’s Yelen and other). The short-term is part of the medium-term by the market sterilization, and the long-term is the
alignment, realignment and continuous alignment by matching the global economic, financial and banking stabilities. Long, medium, and short-term price
stabilities are measured by long, medium and short-term currency band charts (similar to technical charts).
Bank for International Settlements (BIS) survey reported that “carry trading” and “momentum trading/unwinding trading” are the common practices in the
market by the participating dealers and non-participating dealers. The participating and non-participating dealers are the “64” world’s largest financial
institutions, the shareholders and the settlement members of the CLS Group Holdings AG, the settlement agency for the $ 5.00 trillion daily FX turnover or $
1,500.00 trillion annually FX turnover. CLS regulated and supervised by the Federal Reserve System.
9. Johanes L. Sitanggang Company
Jakarta, Indonesia Global Economic and Monetary Policy Structure
Trading the Global Equilibrium
This report is Strictly Confidential and not authorized for distribution, copying, altering, modification and replication. If you are not intended recipient of the report, you shall return this
report and delete from your system.
Carry traders and momentums traders (unwinding traders) manage their trading operation by matching the price stabilities managed by the global central
banks and often they have anticipate the stability without the needs for the global central banks to undertake market sterilization (honeymoon affect, according
to Krugman).
At what rate or price the exchange rates to “turn” at the lower or at the upper short-, medium- and long-term price stability band levels are assessed and
measured by their average traded weighted rates (ATWR). The ATWR as the turning points are measured in term of “estimated” and “actual”. The “estimated
turning” is the measure by the current width of band at economic fundamental, and the “actual turning” is the measure of the actual turning of the band, but the
actual turning individually remains at risk and therefore a new measure of “collective turning point” to be developed for assurance and guaranteeing the
turning.
“Collective turning point” guarantees and assures the turning point collectively but face the price elasticity at turning point. Price elasticity at turning point is
the measure of lowest and highest rates during the process of actual turning point. These lowest and highest rates become the entry rates at turning point and
the management of the “initial risk assumed” and it is managed to “risk-free” overtime. At risk-free trading position the trade to be hold to achieve the target for
profit.
At such, in FX margined and non-margined trading, long/buy the carry trading currency pairs at the lowest price elasticity rate of actual turning point at the
lower medium-term price stability band level to target the upper medium-term price stability band level (similar to carry trading activity during carry trading
operation), and/or short/sell the unwinding currency pairs at the highest price elasticity rate of actual turning point at the upper medium-term price stability
band level to target the lower medium-term price stability band level (similar to unwinding/momentum trading activity). Initial risk assumed to be managed at
risk-free overtime.
Monetary price stability band levels traders are “lazy traders” with low frequency of trading with medium-term price stability turnaround time 3-4 months and
short-term 2-3 months, similar to carry and unwinding, but could be shorter or longer. Turnaround time by turnaround time is to be assessed and measured. At
such, rationally the trades will be 4 trades per year (lazy work).
Based on the currencies settled by CLS bank, the carry trading currency pairs (as well as unwinding currency pairs) is NZDJPY, AUDJPY, CADJPY, GBPJPY,
EURJPY, CHFJPY, USDJPY, KRWJPY, HKDJPY, SGDJPY, ILSJPY, HUFJPY, NOKJPY, DKKJPY, SEKJPY, MXNJPY, ZARJPY as well as NZDCHF, AUDCHF, CADCHF,
GBPCHF, EURCHF, USDCHF, KRWCHF, HKDCHF, SGDCHF, ILSCHF, HUFCHF, NOKCHF, DKKCHF, SEKCHF, MNXCHF, ZARCHF. Although USD has been entering on
carry trading activity according to recent BIS survey, the target mainly emerging market and developing nations’ currencies not settled by CLS bank.
FX trading is “buying and selling” and unless there is no buyer or seller then there will be no transaction executed. Similarly, carrying and unwinding is the
process of buying and selling, unless there are no asset disposed then there will be no asset for off-taking. At such, the carried/off-taken is the
disposed/unwinded or “asset disposal and asset off-taking”. If have debt securities and intended for sale then unless no buyer the transaction cannot be
completed. The asset disposal/unwinding and asset off-taking/carrying is the template and architect of monetary system of the managed float of two different
market environment at the same period of time, the disposing/unwinding versus the off-taking/carrying. The question becomes which carry trader is on
10. Johanes L. Sitanggang Company
Jakarta, Indonesia Global Economic and Monetary Policy Structure
Trading the Global Equilibrium
This report is Strictly Confidential and not authorized for distribution, copying, altering, modification and replication. If you are not intended recipient of the report, you shall return this
report and delete from your system.
unwinding/disposing environment and which carry trader in on off-taking/carrying environment. By knowing them based on the monetary analysis then
trading operation can be established to match the two environments, buy/long the carrying environment currency pairs and short/sell the
unwinding/disposing environment currency pairs.
There are 17 carry trading currency pairs versus 16 unwinding currency pairs or the opposite numbers with turnaround time 3-4 months. By having 17 carry
trading currency pairs means has many pairs to select for the most feasible and for the lowest risk to target, and by having 16 unwinding currency pairs means
has many pairs to select for the most feasible and for the lowest risk to target. At such, measure and re-measure the profit expectation and the initial risk
assumed could be undertaken to all the 17 and the 16 pairs for selecting 1 or 2 from the 17 and from the 16 pairs to target for assuring the most feasible and
profitable at the lowest risk.
15. Johanes L. Sitanggang Company
Jakarta, Indonesia Global Economic and Monetary Policy Structure
Trading the Global Equilibrium
This report is Strictly Confidential and not authorized for distribution, copying, altering, modification and replication. If you are not intended recipient of the report, you shall return this
report and delete from your system.
EXISTING ASSETS RE-UTILIZATION FOR TWO CASH-FLOW STREAMS
Business
Expansion and
Diversification
Improve
Shareholder
Dividend
High, Moderate,
Low and Non-
Income
Generating
Assets
Private
Investment
Manager,
Traders
Asset Managers,
Investment
Managers,
Corporations
Global Investment
Trading
Platforms, Global
Brokerage Firms
Lending Banks
and Private
Lenders
Custodian
Banks
CASH-FLOW FROM GLOBAL
INVESTMENT TRADING ACTIVITY
Account Funding by Issuance and
Delivery of BGs or SBLCs for
Collateral in Global Investment
Trading Activity
Investment Trading Account
Opening and Agreement
Account Funding with Cash for
Collateral in Global Investment
Trading Activity
Account Funding by Issuance and
Delivery of BGs or SBLCs for
Collateral in Global Investment
Trading Activity
Asset Pledging for
Collateral of Loan
(Working Capital,
Investment Capital,
and BGs or SBLCs
Facility
Loans: Working
Capital, Investment
Capital and Facility
for Issuance and
Delivery of BGs
and SBLCs
DEBT SERVICE
OBLIGATIONS
IMPROVEMENT DEBT
SERVICE OBLIGATIONS
Portfolio Investment in Global Investment Trading Activity Re-Utilized as Collateral to Lending Banks and Private
Lenders
Cash-Flow from
Existing
Businesses or
Asset Management
SUPPORTING
EXPANSION AND
DIFERSIFICATION
FUNDING
Profit Sharing 30/70
Per Trade Basis
(Administered by
Platforms)
IMPROVEMENT
SHAREHOLDERS’
RETURN
(DIVIDEND)
Existing Shareholders’
Return and Expansion