Measures of Central Tendency: Mean, Median and Mode
KBank daily jan 31
1. Capital Markets Research
Jan 31, 2011
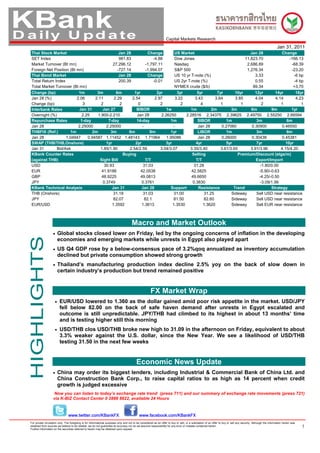
Thai Stock Market Jan 28 Change US Market Jan 28 Change
SET Index 981.83 -4.88 Dow Jones 11,823.70 -166.13
Market Turnover (Bt mn) 27,296.12 -1,797.11 Nasdaq 2,686.89 -68.39
Foreign Net Position (Bt mn) -727.14 -1,994.07 S&P 500 1,276.34 -23.20
Thai Bond Market Jan 28 Change US 10 yr T-note (%) 3.33 -6 bp
Total Return Index 200.39 -0.01 US 2yr T-note (%) 0.55 -4 bp
Total Market Turnover (Bt mn) NYMEX crude ($/b) 89.34 +3.70
Change (bp) 1m 3m 6m 1yr 2yr 3yr 5yr 7yr 10yr 12yr 14yr 18yr
Jan 28 (%) 2.06 2.11 2.29 2.54 2.97 3.22 3.43 3.64 3.85 4.04 4.14 4.23
Change (bp) 3 2 2 0 2 2 4 1 1 2 1 1
Interbank Rates Jan 31 Jan 27 BIBOR 1w 1m 2m 3m 6m 9m 1yr
Overnight (%) 2.25 1.900-2.210 Jan 28 2.26250 2.28516 2.34375 2.39625 2.49750 2.55250 2.66594
Repurchase Rates 1-day 7-day 14-day 1m SIBOR 1m 3m 6m
Jan 28 2.25000 2.25000 - - Jan 28 0.27060 0.30900 0.46550
THBFIX (Ref.) 1m 2m 3m 6m 9m 1yr LIBOR 1m 3m 6m
Jan 28 1.04947 0.94587 1.11452 1.48143 1.71964 1.95086 Jan 28 0.26000 0.30438 0.45381
SWAP (THB/THB,Onshore) 1yr 2yr 3yr 4yr 5yr 7yr 10yr
Jan 31 Bid/Ask 1.85/1.90 2.54/2.59 3.04/3.07 3.35/3.40 3.61/3.65 3.91/3.96 4.15/4.20
KBank Counter Rates Buying Selling Premium/Discount (stgs/m)
(against THB) Sight Bill T/T T/T Export/Import
USD 30.93 31.03 31.28 -1.80/0.00
EUR 41.9188 42.0538 42.5825 -5.90/-0.63
GBP 48.9225 49.0813 49.6650 -4.25/-0.50
JPY 0.3749 0.3761 0.3830 -3.09/1.99
KBank Technical Analysis Jan 31 Jan 28 Support Resistance Trend Strategy
THB (Onshore) 31.18 31.03 31.00 31.25 Sideway Sell USD near resistance
JPY 82.07 82.1 81.50 82.60 Sideway Sell USD near resistance
EUR/USD 1.3592 1.3613 1.3530 1.3620 Sideway Sell EUR near resistance
Macro and Market Outlook
• Global stocks closed lower on Friday, led by the ongoing concerns of inflation in the developing
economies and emerging markets while unrests in Egypt also played apart
• US Q4 GDP rose by a below-consensus pace of 3.2%qoq annualized as inventory accumulation
declined but private consumption showed strong growth
• Thailand’s manufacturing production index decline 2.5% yoy on the back of slow down in
certain industry’s production but trend remained positive
FX Market Wrap
• EUR/USD lowered to 1.360 as the dollar gained amid poor risk appetite in the market. USD/JPY
fell below 82.00 on the back of safe haven demand after unrests in Egypt escalated and
outcome is still unpredictable. JPY/THB had climbed to its highest in about 13 months’ time
and is testing higher still this morning
• USD/THB clos USD/THB broke new high to 31.09 in the afternoon on Friday, equivalent to about
3.3% weaker against the U.S. dollar, since the New Year. We see a likelihood of USD/THB
testing 31.50 in the next few weeks
Economic News Update
• China may order its biggest lenders, including Industrial & Commercial Bank of China Ltd. and
China Construction Bank Corp., to raise capital ratios to as high as 14 percent when credit
growth is judged excessive
Now you can listen to today’s exchange rate trend (press 711) and our summary of exchange rate movements (press 721)
via K-BIZ Contact Center 0 2888 8822, available 24 Hours
www.twitter.com/KBankFX www.facebook.com/KBankFX
1
For private circulation only. The foregoing is for informational purposes only and not to be considered as an offer to buy or sell, or a solicitation of an offer to buy or sell any security. Although the information herein was
obtained from sources we believe to be reliable, we do not guarantee its accuracy nor do we assume responsibility for any error or mistake contained herein.
Further information on the securities referred to herein may be obtained upon request.
2. KBank Daily Update Jan 31, 2011
is likely to have expanded by more than 7.8% (up from
Macro and Market Outlook 7.5%) in the year 2010, in line with the BoT’s forecast of an
Global stocks closed lower on Friday, led by the ongoing 8.0% growth. The December manufacturing production
concerns of inflation in the developing economies and index (MPI) dropped 0.10% mom and 2.5% yoy. Capacity
emerging markets while unrests in Egypt also played a utilization rate declined to 63.4% from 63.6% in November
part. According to some news reports, the events in Tunisia and the average of 63.7% in the fourth quarter.
may have inspired current unrests in Egypt, stoking fear
that unhappiness arising from economic hardship and US Treasuries and Thai rates
higher food prices may cause the long-suppressed political
issues to escalate into unrests among the North African
and Middle East nations. Treasuries headed for their first monthly gain since
September, while Japanese and Australian bonds rose, as
Gold rebounded to around $1,342/ounce this morning, after protests in Egypt fueled demand for the relative safety of
last week’s slump to $1,313/ounce but there is little support government debt.
in the near term as investors’ shifted to stocks. Crude oil U.S. two-year yields were near the lowest level in seven
declined to below $86/barrel last week on news of possible weeks as Asian stocks slid and crude oil advanced. The
production increase among OPEC nations but quickly rose Federal Reserve is scheduled to buy $6 billion to $8 billion
to above $90/barrel this morning on concerns in Egypt. of notes due from August 2013 to December 2014 today as
part of its plan to spur the economy.
% QoQ saar
8 Benchmark 10-year Treasuries yielded 3.32 percent as of
6 9:38 a.m. in Tokyo, according to BGCantor Market Data.
4 Two-year notes yielded 0.54 percent. The rate declined to
2 0.53 percent earlier today, the lowest level since Dec. 8.
0
(Source: Bloomberg)
-2
Government expenditure
-4 Net exports S&P Index (bp)
-6 Private investment
1350 300
-8 Private consumption
GDP Growth 1300 280
-10
Mar-07 Sep-07 Mar-08 Sep-08 Mar-09 Sep-09 Mar-10 Sep-10 1250
260
1200
240
1150
U.S. economic update – was Q4 GDP was slightly below 220
1100
the market’s estimate of a 3.5% qoq saar increase. The
1050 200
actual reading turned out to be at 3.2% but a positive sign
1000 180
is that private consumption rose strongly by 4.4% (forecast
Mar-10 May-10 Jul-10 Sep-10 Nov-10 Jan-11
4.0%). The drag on the GDP in the last quarter had been
the decline in inventories. The remaining worry seems to S&P Index 2-10 Spread (bps, RHS)
be the underlying inflation rate – reflect by the core private
consumption expenditure which rose by the slowest pace Thai interest rate: IRS yields traded lower again as the
since around the year 1960 at 0.4% qoq saar. overnight and two-day swap points reverted to a discount
again. Bond yields rose by 2-3bp on Friday on average,
Meanwhile, consumer sentiment index (U. mainly driven by local investors’ selling of mid-curve bonds
Michigan/Reuters) was not as bad as earlier predicted. The after the Bank of Thailand’s announcement of an
measured was forecasted to fall to 73.3 after the 74.5 unexpected Bt15bn of 4-year bond issuance in February.
reading in December but actual figure was 74.2.
%
For this Friday’s big number – the non-farm payrolls – 4.5
the market expects an increase of 140,000 jobs (Dec 4.0
103,000), but unlikely a number that is strong enough to 3.5
bring down unemployment rate significantly, in line with the 3.0
FOMC statement last week which still see a weak labor
2.5
market in the U.S. and hence, Q.E.2 is likely to remain in
2.0
place.
1.5
120
Dec-09 Mar-10 Jun-10 Sep-10 Dec-10
110
100
2Y 3Y 5Y 10Y
90
80
70 bps Mid-curve government bond yield spread
60 80
50 70
40 60
30
50
20
40
05 06 07 08 09 10 11
30
Conference Board Consumer Confidence index Consumer sentiment index (U Mich) 20
10
0
Thailand economic update - MoF raised GDP growth
May-10 Jun-10 Jul-10 Aug-10 Sep-10 Oct-10 Nov-10 Dec-10 Jan-11
forecast for Q4 from 3.5% to 4.5%, citing better-than-
expected economic numbers. It said that the Thai economy LB155A - LB196A spread LB133A - LB155A spread
2
For private circulation only. The foregoing is for informational purposes only and not to be considered as an offer to buy or sell, or a solicitation of an offer to buy or sell any security. Although the information herein was
obtained from sources we believe to be reliable, we do not guarantee its accuracy nor do we assume responsibility for any error or mistake contained herein.
Further information on the securities referred to herein may be obtained upon request.
3. KBank Daily Update Jan 31, 2011
FX Wrap Currency Movement
Fri 28-Jan-11 Thu 27-Jan-11 % Change
1.42
1.40 USD/THB 31.03 30.90 +0.42
1.38 USD/JPY 81.97 82.86 -1.07
1.36 EUR/USD 1.360 1.373 -0.95
1.34
GBP/USD 1.5856 1.5921 -0.41
1.32
1.30 USD/CHF 0.9079 0.9453 -3.96
1.28 USD/SGD 1.2847 1.2787 +0.47
1.26 USD/TWD 29.05 29.03 +0.06
Aug-10 Sep-10 Oct-10 Nov-10 Dec-10 Jan-11
USD/KRW 1,115.6 1,114.3 +0.12
EUR/USD
USD/PHP 44.08 44.19 -0.25
EUR/USD lowered to 1.360 as the dollar gained amid USD/IDR 9,080 9,022 +0.64
poor risk appetite in the market. USD/MYR 3.054 3.052 +0.08
USD/CNY 6.586 6.582 +0.06
39.00 80 Source: Reuters
82 .FX Consensus Forecast
38.00
84 Spot Jun 2011 Dec 2011
37.00
86
36.00 88 USD/THB 31.18 28.30 28.00
90 USD/JPY 82.14 86.00 88.50
35.00
92
34.00 EUR/USD 1.36 1.29 1.30
94
33.00 96 GBP/USD 1.59 1.55 1.60
1-Jan 1-Mar 1-May 1-Jul 1-Sep 1-Nov 1-Jan
USD/CNY 6.59 6.46 6.30
JPY/THB (LHS) USD/JPY (RHS, inverted axis)
USD/SGD 1.29 1.27 1.24
USD/JPY fell below 82.00 on the back of safe haven USD/IDR 9,055 8,900 8,800
demand after unrests in Egypt escalated and outcome is USD/MYR 3.06 3.02 2.96
still unpredictable. JPY/THB had climbed to its highest in USD/PHP 44.29 42.50 41.50
about 13 months’ time and is testing higher still this
morning. USD/KRW 1,123 1,088 1,050
USD/TWD 29.03 28.65 28.45
31.30
31.10 AUD/USD 0.99 0.99 0.98
30.90
NZD/USD 0.77 0.77 0.76
30.70 Source: Bloomberg, KBank for USD/THB
30.50
30.30 Currency Pair Targets
30.10
Spot Jun 2011 Dec 2011
29.90
29.70 USD/THB 31.18 28.30 28.0
29.50
EUR/THB 42.38 40.0 37.0
Oct-10 Nov-10 Dec-10 Jan-11
JPY/THB 37.90 34.70 29.5
USD/THB
GBP/THB 49.35 47.40 43.7
USD/THB broke new high to 31.09 in the afternoon on
Friday, equivalent to about 3.3% weaker against the U.S. CNY/THB 4.73 4.78 4.2
dollar, 5.9% against the euro, and 1.4% against the AUD/THB 30.89 27.4 26.0
Japanese yen since the New Year.
CHF/THB 33.11 29.6 27.7
Source: KBank, Bloomberg
We see a likelihood of USD/THB testing 31.50 in the next
few weeks, should market view for the baht remained KBank NEER Index
negative and foreigners continue to take money off the
Current 98.86
Thai stock market.
YTD + 6.16%
Sentiment for risky assets remained capped this morning vs 52 weeks ago + 5.23%
as investors flocked to safe haven assets due to concerns vs 1mth ago - 2.24%
of unrests in Europe. This morning, the baht is following vs 1 week ago - 0.14%
regional currencies weaker.
vs 1 day ago - 0.08%
vs long term average + 11.16%
Note: NEER is constructed from the weighted average of bilateral exchange
rates of the baht via Thailand’s 21 major trading partners and trade
competitors. An increase in NEER refers to an appreciation
3
For private circulation only. The foregoing is for informational purposes only and not to be considered as an offer to buy or sell, or a solicitation of an offer to buy or sell any security. Although the information herein was
obtained from sources we believe to be reliable, we do not guarantee its accuracy nor do we assume responsibility for any error or mistake contained herein.
Further information on the securities referred to herein may be obtained upon request.
4. KBank Daily Update Jan 31, 2011
Total Return Analysis – 3 month horizon, annualized Auction results of BoT Bonds Jan 28
Yield shift (bps) -40 -30 -20 -10 0 +10 +20 +30 +40 Bid-
Tenor Amt. Accepted
LB113A 2.10 2.12 2.14 2.15 2.17 2.18 2.20 2.22 1.98 Symbol Avg. Yield (%) coverage
(yrs) (Bt mn) Range (%)
ratio
LB116A 2.72 2.62 2.52 2.43 2.33 2.24 2.14 2.04 1.70
CB11215A 0.04 85,000 2.080/2.143 2.130440 0.96
LB11NA 3.60 3.33 3.06 2.79 2.53 2.26 1.99 1.72 1.20
Source: ThaiBMA
LB123A 4.22 3.85 3.48 3.11 2.73 2.36 1.99 1.62 1.00
Auction Calendar of BoT Bonds
LB12NA 5.36 4.75 4.14 3.52 2.91 2.30 1.68 1.07 0.21
LB133A 6.04 5.30 4.56 3.82 3.08 2.33 1.59 0.85 -0.14 Tenor Amt.
Symbol Auction Date Maturity Date Remark
(yrs) (Bt mn)
LB137A 6.60 5.74 4.87 4.01 3.15 2.28 1.42 0.55 -0.56
LB13OA 7.04 6.08 5.12 4.16 3.20 2.24 1.28 0.32 -0.88 CB11303DA 0.08 25,000 01-Feb-11 03-Mar-11 -
LB143A 7.39 6.37 5.34 4.32 3.30 2.27 1.25 0.22 -1.05 CB11506C 0.25 22,000 01-Feb-11 06-May-11 -
LB145A 7.96 6.81 5.66 4.51 3.37 2.22 1.07 -0.08 -1.47 CB11804B 0.50 15,000 01-Feb-11 04-Aug-11 -
LB145B 7.96 6.81 5.66 4.51 3.37 2.22 1.07 -0.07 -1.47 CB12202A 1.00 50,000 01-Feb-11 02-Feb-12 -
LB14DA 8.75 7.42 6.08 4.75 3.41 2.08 0.75 -0.59 -2.17 BOT142A 3.00 15,000 11-Feb-11 15-Feb-14 -
LB155A 9.53 8.01 6.48 4.96 3.44 1.92 0.40 -1.12 -2.89 BOT152A 4.00 15,000 22-Feb-11 24-Feb-11 -
LB157A 9.39 7.90 6.42 4.94 3.46 1.97 0.49 -0.99 -2.72
Source: ThaiBMA
LB15DA 10.37 8.65 6.92 5.19 3.46 1.74 0.01 -1.72 -3.69
LB167A 10.97 9.11 7.25 5.40 3.54 1.69 -0.17 -2.02 -4.12
LB16NA 11.51 9.53 7.54 5.56 3.57 1.59 -0.40 -2.38 -4.61
LB171A 11.60 9.61 7.62 5.63 3.64 1.65 -0.34 -2.33 -4.57 * Note that the MOF suspends auction of Treasury bills for two months
LB175A 12.13 10.01 7.89 5.77 3.66 1.54 -0.58 -2.69 -5.06 during January – February 2011. This is due to the large amount of Treasury
cash balance.
LB183A 13.21 10.83 8.45 6.08 3.70 1.32 -1.05 -3.43 -6.05
LB183B 12.92 10.61 8.31 6.00 3.70 1.40 -0.90 -3.21 -5.76
LB191A 13.89 11.34 8.80 6.26 3.72 1.18 -1.36 -3.90 -6.68
LB196A 14.83 12.06 9.28 6.50 3.73 0.95 -1.82 -4.59 -7.61
LB198A 14.39 11.74 9.08 6.43 3.78 1.13 -1.52 -4.16 -7.06
LB19DA 14.94 12.16 9.38 6.60 3.83 1.05 -1.72 -4.50 -7.52
LB213A 16.07 13.03 9.99 6.95 3.92 0.88 -2.16 -5.19 -8.47
LB214A 15.96 12.96 9.96 6.96 3.96 0.97 -2.03 -5.02 -8.27
LB22NA 18.04 14.55 11.05 7.56 4.07 0.57 -2.92 -6.40 -10.14
LB233A 18.11 14.61 11.11 7.61 4.11 0.62 -2.88 -6.37 -10.11
LB236A 19.56 15.69 11.83 7.97 4.12 0.26 -3.60 -7.45 -11.55
LB244A 19.68 15.79 11.91 8.04 4.16 0.28 -3.59 -7.46 -11.58
LB24DA 20.29 16.27 12.24 8.22 4.19 0.17 -3.84 -7.86 -12.12
LB267A 20.80 16.66 12.52 8.38 4.24 0.11 -4.03 -8.16 -12.53
LB283A 22.04 17.60 13.15 8.71 4.27 -0.17 -4.60 -9.03 -13.71
LB296A 23.76 18.88 14.02 9.15 4.29 -0.57 -5.42 -10.28 -15.37
LB383A 27.96 22.06 16.15 10.26 4.37 -1.52 -7.40 -13.28 -19.40
LB396A 29.28 23.05 16.83 10.61 4.39 -1.82 -8.02 -14.22 -20.66
Average 13.00 10.65 8.29 5.94 3.59 1.24 -1.11 -3.46 -6.05
Source: KBank, Bloomberg
KBank Rich – Cheap Model
30.00
20.00
10.00
0.00
-10.00
-20.00
-30.00 3 mth avg
Now
-40.00
LB296A
LB113A
LB116A
LB11NA
LB123A
LB133A
LB137A
LB145B
LB14DA
LB155A
LB15DA
LB167A
LB16NA
LB175A
LB183B
LB191A
LB196A
LB198A
LB19DA
LB213A
LB24DA
LB267A
LB283A
LB396A
Source: Bloomberg, KBank The 3-month average indicates the average differences between observed and derived yields
4
For private circulation only. The foregoing is for informational purposes only and not to be considered as an offer to buy or sell, or a solicitation of an offer to buy or sell any security. Although the information herein was
obtained from sources we believe to be reliable, we do not guarantee its accuracy nor do we assume responsibility for any error or mistake contained herein.
Further information on the securities referred to herein may be obtained upon request.
5. KBank Daily Update Jan 31, 2011
An earlier version of the rules would have required China’s
Economic News Update biggest banks to have capital adequacy ratios of 11
percent to 15 percent by the end of 2012, a person with
China Said to Plan Raising Ratio If Credit knowledge of that proposal said in September. That
Excessive: China may order its biggest lenders, compares with ratios from 11.5 percent to 14 percent
including Industrial & Commercial Bank of China Ltd. and stipulated by the latest proposal.
China Construction Bank Corp., to raise capital ratios to as
high as 14 percent when credit growth is judged excessive, The previous version also called for Tier 1 capital of 8
said a person familiar with the matter. percent. The new proposal’s requirement for Tier 1 capital,
which includes common equity, retained profits and
Newly proposed rules would require increasing capital perpetual preferred stock, is 6 percent, same as the Basel
adequacy buffers by as much as 2.5 percentage points rules, according to the person.
when the banking regulator determines loan growth to be
too fast, said the person, declining to be identified as the (Source: Bloomberg)
plan isn’t public. In normal conditions, lenders deemed
systemically important will need to have a minimum 11.5
percent ratio, unchanged from the current requirement for
China’s biggest banks, said the person.
China is tightening oversight of banks, limiting mortgages
and raising interest rates to prevent a record $2.7 trillion of
credit extended in the past two years from inflating asset
bubbles that may saddle lenders with bad loans. Some
banks may need to raise additional capital to meet the new
requirements, the person said.
“This shows further tightening as the regulator worries
about excessive lending,” Xu Guangfu, an analyst at
Xiangcai Securities Co. in Shanghai, said by telephone.
“The banking sector’s valuation is already depressed and
this may drag it lower. The market will be more concerned
about those banks that were lending aggressively.”
An official with the regulator’s news department, who
declined to be identified because of the agency’s rules,
said a decision hasn’t yet been made on the ratios and that
the process is still ongoing.
Under the China Banking Regulatory Commission’s
proposed rules, systemically important banks will have to
comply with the capital ratio requirements by the end of
2013, three years earlier than other lenders, the person
said. China’s five biggest banks, which also include the
Agricultural Bank of China Ltd., Bank of China Ltd. and
Bank of Communications Co., are currently deemed
systemically important, the person said.
All banks would be required to have a capital adequacy
ratio of at least 8 percent, with an additional 2.5 percentage
points as a buffer during normal credit conditions, the
person said. Systemically important banks would need to
maintain an additional percentage point, the person said.
During periods when loan growth is too fast, the regulator
will require all lenders to increase their ratios by as much
as 2.5 percentage points, the person said. It isn’t
immediately clear what standards would be used for
determining when credit expansion is excessive, the
person said.
Regulators are taking advantage of record bank profits and Market Strategists:
double-digit economic growth to set stricter rules at a faster Nalin Chutchotitham
pace than agreements announced in July by the Basel
Committee on Banking Supervision. China’s economy, set Email: nalin.c@kasikornbank.com
to surpass Japan’s to become the world’s second biggest,
grew 10.3 percent in 2010, the fastest pace in three years, Tel: 02-470-3235
according to government data.
5
For private circulation only. The foregoing is for informational purposes only and not to be considered as an offer to buy or sell, or a solicitation of an offer to buy or sell any security. Although the information herein was
obtained from sources we believe to be reliable, we do not guarantee its accuracy nor do we assume responsibility for any error or mistake contained herein.
Further information on the securities referred to herein may be obtained upon request.
6. KBank Daily Update Jan 31, 2011
Economic Calendar
Date / Time Country Event Period Consensus Actual Prior Revised
01/28/2011 06:30 JN Jobless Rate DEC 5.10% 4.90% 5.10% --
01/28/2011 06:30 JN Job-To-Applicant Ratio DEC 0.58 0.57 0.57 --
01/28/2011 06:30 JN Overall Hhold Spending (YoY) DEC -0.60% -3.30% -0.40% --
01/28/2011 06:30 JN Tokyo CPI YoY JAN -0.20% -0.10% -0.20% -0.10%
01/28/2011 06:30 JN Tokyo CPI Ex-Fresh Food YoY JAN -0.30% -0.20% -0.40% --
01/28/2011 06:30 JN Tokyo CPI Ex Food, Energy YoY JAN -0.50% -0.30% -0.50% --
01/28/2011 06:30 JN Natl CPI YoY DEC -0.10% 0.00% 0.10% --
01/28/2011 06:30 JN Natl CPI Ex-Fresh Food YoY DEC -0.50% -0.40% -0.50% --
01/28/2011 06:30 JN Natl CPI Ex Food, Energy YoY DEC -0.80% -0.70% -0.90% --
01/28/2011 06:50 JN Retail Trade MoM SA DEC -1.40% -4.10% 1.90% 2.10%
01/28/2011 06:50 JN Retail Trade YoY DEC 0.60% -2.00% 1.30% 1.50%
01/28/2011 06:50 JN Large Retailers' Sales DEC -0.50% -1.80% 0.20% 0.10%
01/28/2011 07:01 UK GfK Consumer Confidence Survey JAN -22 -29 -21 --
01/28/2011 08:35 CH MNI Business Condition Survey JAN -- 61.11 62.08 --
01/28/2011 14:00 TH Mfg. Production Index ISIC (YoY) DEC 0.65 -2.48 5.61 5.65
01/28/2011 14:00 TH Mfg. Production Index ISIC (SA) DEC -- 190.83 189.21 189.09
01/28/2011 14:00 TH Total Capacity Utilization ISIC DEC -- 63.4 63.6 --
01/28/2011 14:30 TH Foreign Reserves Jan-21 -- $174.4B $174.1B --
01/28/2011 14:30 TH Forward Contracts Jan-21 -- $18.4B $18.1B --
01/28/2011 15:20 TA Bounced Check Ratio DEC -- 0.17% 0.17% --
01/28/2011 16:00 EC Euro-Zone M3 s.a. 3 mth ave. DEC 1.60% 1.60% 1.30% 1.40%
01/28/2011 16:00 EC Euro-Zone M3 s.a. (YoY) DEC 1.90% 1.70% 1.90% 2.10%
01/28/2011 16:00 IT Hourly Wages (MoM) DEC 0.20% 0.10% 0.20% --
01/28/2011 16:00 IT Hourly Wages (YoY) DEC 1.70% 1.70% 1.70% --
01/28/2011 17:00 IT Consumer Confidence Ind. sa JAN 109 105.9 109.1 --
26-28 JAN VN Industrial Output YTD (YoY) JAN -- -- 14.00% --
26-28 JAN VN Retail Sales YTD (YoY) JAN -- -- 24.50% --
01/28/2011 20:30 US Employment Cost Index 4Q 0.50% 0.40% 0.40% --
01/28/2011 20:30 US GDP QoQ (Annualized) 4Q A 3.50% 3.20% 2.60% --
01/28/2011 20:30 US GDP Price Index 4Q A 1.60% 0.30% 2.10% --
01/28/2011 20:30 US Core PCE QoQ 4Q A 0.40% 0.40% 0.50% --
01/28/2011 20:30 US Personal Consumption 4Q A 4.00% 4.40% 2.40% --
01/28/2011 21:55 US U. of Michigan Confidence JAN F 73.3 74.2 72.7 --
01/31/2011 04:00 SK Business Survey- Manufacturing FEB -- 91 92 --
01/31/2011 04:00 SK Business Survey- Non-Manufacturing FEB -- 84 87 --
01/31/2011 06:00 SK Service Industry Output YoY DEC -- 2.10% 3.60% 3.80%
01/31/2011 06:00 SK Industrial Production Mfg(YoY) DEC -- 9.90% 10.60% 10.90%
01/31/2011 06:00 SK Industrial Production (MoM) DEC 2.60% 2.80% 1.40% 1.50%
01/31/2011 06:00 SK Industrial Production (YoY) DEC 9.90% 9.80% 10.40% 10.70%
01/31/2011 06:00 SK Leading Index (YoY) DEC -- 2.30% 2.60% 2.50%
01/31/2011 06:15 JN Nomura/JMMA Manufacturing PMI JAN -- 51.4 48.3 --
Source: Bloomberg
6
For private circulation only. The foregoing is for informational purposes only and not to be considered as an offer to buy or sell, or a solicitation of an offer to buy or sell any security. Although the information herein was
obtained from sources we believe to be reliable, we do not guarantee its accuracy nor do we assume responsibility for any error or mistake contained herein.
Further information on the securities referred to herein may be obtained upon request.