SlideShare a Scribd company logo
1 of 9
Download to read offline
Fri
Sep 26
2008
ISI INTERNATIONAL STRATEGY & INVESTMENT
Portfolio Strategy Report
François Trahan 212 446 5634 ftrahan@isigrp.com
Kevin Cheng 212 446 5630 kcheng@isigrp.com
Brian J. Herlihy 212 446 9421 bherlihy@isigrp.com
Michael J. Kantrowitz, CFA 212 446 5632 mkantrowitz@isigrp.com
1 of 9
Deconstructing The Deleveraging Cycle
Fear of the “D” word is the one commonality we currently see amongst investors. For some, it is
fear of a Depression, for others it is of Deflation. We have discussed the market implications of
both scenarios in recent months, today we tackle the third “D” word: Deleveraging. Unlike the first
two, we believe this one is legitimate. In fact, we cannot see a scenario by which deleveraging
does not happen. That said, there are a lot of foregone conclusions floating out there about what it
means for the economy and the markets. In this piece, we review the last two periods of
deleveraging (mid-70s and early-90s) to see what we might expect from markets.
Economic Deleveraging Is Likely Ahead, But Should We Fear It?!
Since the 1970s,
we have only seen
two major
episodes of
deleveraging …
0.8
0.9
1.0
1.1
1.2
1.3
1.4
1.5
1.6
1.7
1.8
1970 1973 1976 1979 1982 1985 1988 1991 1994 1997 2000 2003 2006 2009 2012
30
40
50
60
70
80
90
100
110
120
Deleveraging Period U.S. Private Debt % GDP (L) Leading Economic Index (Adv 24m, YoY % Chg, R)
… this typically occurs well
into an economic slowdown.
?
There is little doubt in our
minds that we are entering a
deleveraging cycle ...
… leading
indicators
suggest a third
one is upon us.
Source: ISI Portfolio Strategy.
The first thing that may come as a surprise for investors is that the last two periods of deleveraging
were actually quite good for stocks. We believe this is partly explained by the fact that inflation
decelerated in both episodes. Even more surprising, or counter-intuitive, is that the best
performing sectors were Consumer Discretionary and Technology. In essence, deleveraging is a
late-cycle phenomenon, or worded differently a lagging indicator.
Looking ahead, we expect that this deleveraging period could last for some time given today’s
historically high level of debt-to-GDP. If the authorities can come up with a plan that allows the
banking system to recover then we would expect financial markets to behave more or less as they
have in the past episodes of deleveraging. Hopefully, the following pages will help demystify what
deleveraging means for the markets.
2
9/26 ISI Group
Market and Economic Implications of Deleveraging
Thus far, 2008 has been a year filled with “D” words. The credit crisis has caused fear to loom
over the markets as “D” words ranging from Deleverage to Depression have created investor
anxiety. In recent months, fears of inflation have transitioned into hopes for Disinflation with some
even raising the specter of Deflation. We think the largest-ever policy response from the Fed is
likely to minimize the likelihood of the two most worrisome “D” words – Depression and Deflation.
However we believe that Disinflation and Deleveraging are two trends that lie ahead of us. As the
cover chart illustrates, economic deleveraging in not something new, it is a normal symptom of our
economic cycle. In every decade since the 70s we have seen periods of deleveraging, albeit some
longer than others. In the following pages we deconstruct two of the longer periods of economic
deleveraging in the past 30 years, the mid 1970s and the early 1990s, and discuss the potential
implications for markets and the economy from the likely upcoming deleveraging cycle.
Macroeconomic & Market Trends To Expect During A Deleveraging Cycle
In the past couple of days, investors have been glued to the television watching Bernanke and
Paulson plead their case while they are probed by politicians asking questions regarding the
solution for the current financial and economic disarray. To be sure, the outcome of a future
deleveraging cycle will also depend on the resolution of the bailout in question. Our studies of
financial market history, specifically of past booms and bust cycle, showed that busts met with an
aggressive policy response are more likely to avoid a “Minskey Moment” (a downward spiral of
asset/debt deflation). On the contrary, students of the Austrian school of Economics would argue
that ineffective central bank policies are partly to blame for past boom and bust cycles. Putting the
Keynesian vs. Austrian economics debate aside, we believe that the Fed’s proactive policy
response will help the U.S. economy avoid a debt deflation spiral and more likely allow for a more
‘normal’ deleveraging process in the years to come.
The chart on the cover suggests that debt as a percent of GDP should likely slow for at least the
next two years. Seeing that this deleveraging process is inherently lagging, we would caution
investors from becoming overly bearish going forward for this reason alone. In fact, the last two
major periods of deleveraging were actually very good periods for equities and the economy. In
some respects, this process of economic normalization is a natural part of the economy cycle.
The table above summarizes the 1970s and 1990s periods of deleveraging. On balance, these
were periods where inflation was declining and economic prospects, particularly in the housing
sector, improved. On the policy front, deleveraging periods typically saw an accommodative Fed.
For stocks, market returns were above average and sector leadership came from Discretionary
and Technology. Ironically, the evidence suggests that deleveraging, and in many ways credit, is a
lagging phenomenon, as these periods were actually some of the best for equity investors.
3
9/26 ISI Group
During previous deleveraging cycles, one of the primary beneficiaries was the homebuilding
industry. As the chart below demonstrates, building permits bottomed near the start of both
deleveraging cycles in the early 70’s and mid 90’s and steadily rose thorough out the entire
deleveraging process. Currently, building permits sit at their lowest levels in 18-years. In the third
quarter, homebuilding stocks have performed particularly well on a relative basis. Interestingly,
both periods of deleveraging saw homebuilders outperform the market.
One Of The Primary Beneficiaries During Deleveraging Cycles: Homebuilding
200
700
1200
1700
2200
2700
1973 1975 1977 1979 1981 1983 1985 1987 1989 1991 1993 1995 1997 1999 2001 2003 2005 2007 2009
80
90
100
110
120
130
140
150
160
170
180
Building permits (000s, L) Private Debt (As a % of GDP, R)
near term bottoms in
building permits
?
?
Counter-
intuitively, the
housing sector
has typically
benefitted from
past deleveraging
cycles.
Source: ISI Portfolio Strategy.
Another important economic factor that is typically influenced during deleveraging cycles is inflation.
As the chart below illustrates, inflation typically trends lower during deleveraging cycles. Notably
during both these cycles, core PCE declined by an average of 2.3%, suggesting that disinflation
may be on the short-term horizon. Moreover, headline CPI also fell by an average of 4.7% ppts
during both these deleveraging periods – lending further evidence for Ed and Nancy’s inflation
estimate of 1% by the second half of 2009.
Inflation Transitions Towards Disinflation During Deleveraging Cycles
0.5
1.5
2.5
3.5
4.5
5.5
6.5
7.5
8.5
9.5
10.5
1974 1976 1978 1980 1982 1984 1986 1988 1990 1992 1994 1996 1998 2000 2002 2004 2006 2008 2010
80
90
100
110
120
130
140
150
160
170
180
Core PCE Price Index (YoY % Chg, L) Private Debt (As a % of GDP, R)
Inflation measures typically decline
during deleveraging cycles
?
?
Inflation tends to
ebb in
deleveraging
cycles.
Source: ISI Portfolio Strategy.
4
9/26 ISI Group
From a historical perspective, the beginning of deleveraging cycles has typically signaled shifts in
monetary policy. As the chart below shows, the Fed had previously adopted a more
accommodative monetary policy during past deleveraging cycles. During the ‘74 deleveraging
cycle, the Fed cut the overnight target rate by 450bps, while the early 90’s deleveraging cycle saw
rate cuts of 275bps. Not surprisingly, the end of a deleveraging cycle is typically marked by
monetary policy as well, as the Fed typically hikes rates.
Policy Is Typically Accommodative During These Deleveraging Cycles
The Fed has
typically eased
during prior
deleveraging
cycles …
0.0
5.0
10.0
15.0
20.0
25.0
1974 1976 1978 1980 1982 1984 1986 1988 1990 1992 1994 1996 1998 2000 2002 2004 2006 2008 2010 2012
80
90
100
110
120
130
140
150
160
170
180
Fed Funds Target Rate (%) Private Debt (As a % of GDP, R)
Another rate cut
in the cards?
?
?
… this cycle has
followed the same
path so far.
Source: ISI Portfolio Strategy.
As we’ve previously written, one of the best indicators of future economic performance has been the
yield curve. What typically happens during deleveraging cycles is that the Fed begins to cut rates to
stimulate lending and economic prospects causing the yield curve to steepen notably. As the table
below illustrates, the yield curve has historically steepened during periods of deleveraging and so far
the current deleveraging cycle has traced a similar path. Since March 2008 (the estimated start of
the current cycle), the yield curve has steepened by 65bps. At the margin, should the current
deleveraging cycle play out like prior ones, this would imply that the Fed has more rate cuts in the
pipeline ahead – consequently strengthening Tom Gallagher’s forecast for further rate cuts by the
end of 2008.
The Yield Curve Typically Steepens During Deleveraging Cycles
Yield Curve Shifts During Deleveraging Cycles
Start End
Change in Slope of
the Yield Curve
Deleveraging Cycle: Sept '74 - Mar '76 -1.31 2.91 + 4.22
Deleveraging Cycle: Dec '90 - Jun '94 1.06 3.07 + 2.01
Yield curve
typically steepens
during
deleveraging
cycles.
Source: ISI Portfolio Strategy.
5
9/26 ISI Group
Despite all the bearish sentiment in the market regarding the deleveraging process, stocks have
generally rallied during past cycles. As illustrated in the diagram below, during the 1974
deleveraging cycle, the S&P 500 rose 48% (or 37% CAGR), while during the deleveraging cycle of
the early 90’s, the S&P 500 gained 38% (or 14% CAGR). At the margin, this suggests that equity
markets can, and have rallied in past while the credit markets were still contracting. It was also
interesting to note that each deleveraging cycle had been preceded by a market correction.
The Market Has Proven Resilient In Past Deleveraging Cycles
The past two
deleveraging
periods were
preceded by
market
corrections …
1.5
1.7
1.9
2.1
2.3
2.5
2.7
2.9
3.1
3.3
1974 1976 1978 1980 1982 1984 1986 1988 1990 1992 1994 1996 1998 2000 2002 2004 2006 2008 2010
80
90
100
110
120
130
140
150
160
170
180
S&P 500 (L) Private Debt (As a % of GDP, R)
Past periods of economic
deleveraging have been good for
equity investors.
?
… and both
periods also
coincided with the
beginning of bull
markets.
Source: ISI Portfolio Strategy.
One of the notable implications of the deleveraging cycle on financial markets can be summed up
into the cliché “size matters”. As the diagram below illustrates, small caps have typically
outperformed their large cap counterparts during past deleveraging cycles. For example, during the
1974 deleveraging cycle, small caps outperformed large caps by 24%. In addition, small caps
outperformed by 34% during the relative longer deleveraging cycle of the early 90’s.
Size Matters: Small Caps Tend To Outperform During Deleveraging
0.50
1.50
2.50
3.50
4.50
5.50
6.50
1973 1975 1977 1979 1981 1983 1985 1987 1989 1991 1993 1995 1997 1999 2001 2003 2005 2007 2009 2011
85
95
105
115
125
135
145
155
165
175
185
Small to Large Cap Relative Performance Private Debt (As a % of GDP, R)
Small Caps Typically Surge
During Deleveraging
?
During
deleveraging
cycles, small caps
usually
outperform their
large cap
counterparts.
Source: ISI Portfolio Strategy.
6
9/26 ISI Group
Don’t Be Defensive About Deleveraging
Drilling down further, we analyzed what impact the deleveraging cycle had on various sector
performances. As the table below illustrates, past deleveraging cycles had typically favored early-
cyclicals sectors (i.e. Discretionary, Technology and Industrials). In contrast, we found that
defensive sectors such as Utilities, Health Care and Telecom Services, generally underperformed
during that part of the cycle. In fact, Discretionary and Technology were the only two sectors to
outperform in both periods while Healthcare, Energy, Utilities and Telecom all underperformed in
both episodes. Hence the title of this section, don’t be defensive about deleveraging!
Annualized Sector Performance During Past Deleveraging Periods
In the chart below, we illustrate one of the primary defensive sectors, the Healthcare sector. The
chart demonstrates that Healthcare sector underperforms during the first deleveraging cycle of 74
by 14ppts. Indeed, this underperformance is also present during the 94 cycle, with Healthcare
underperforming on a relative basis by 4ppts. Coincidentally, the Utility sector also demonstrated
considerable underperformance during these two periods, with relative underperformance of 13 ppts
in the ’74 cycle and 10 ppts in the early 90’s.
Healthcare & Defensive Sectors Have Typically Underperformed In These Cycles
90
92
94
96
98
100
102
104
1974 1975 1976 1977 1978 1979 1980 1981 1982 1983 1984
0.16
0.18
0.20
0.22
0.24
0.26
0.28
0.30
0.32
Private Debt (As a % of GDP, L) Health Care Relative Sector Performance (R)
Healthcare stocks
underperformed in both
periods of deleveraging!
Healthcare tends
to underperform
in deleveraging
cycles as leading
indicators grind
higher.
Source: ISI Portfolio Strategy.
7
9/26 ISI Group
In contrast to the defensive sectors, early-cyclical stocks typically performed well during periods of
deleveraging. One of the early cyclical segments that faired the best was Discretionary. As the chart
below demonstrates, the Discretionary sector managed to outperform the index by 4.2 ppts during
the previous deleveraging cycle. Through our lens, we expect this trend in outperformance to be
maintained during this deleveraging cycle as economic prospects rebound.
Discretionary Was Among The Top Performers In The Last Two Cycles
80
90
100
110
120
130
140
150
160
170
180
1985 1987 1989 1991 1993 1995 1997 1999 2001 2003 2005 2007 2009 2011
55
65
75
85
95
105
115
125
135
Private Debt (As a % of GDP, L) Consumer Discretionary Relative Sector Performance (R)
Discretionary stocks were the
strongest performers in past
deleveraging periods.
?
?
The Discretionary
was one of the
top relative
performers during
the last
deleveraging
cycle.
Source: ISI Portfolio Strategy.
As we’ve previously written, the flipside to Discretionary outperformance has been Energy
underperformance and this thematic trade remained largely intact during the prior two deleveraging
cycles. As the chart below illustrates, the Energy sector underperformed by about 13 ppts during the
early 1990 deleveraging cycle and also underperformed by 10 ppts during the cycle of 1974. In our
view, given the current needs of the energy sector (i.e., high capital intensive costs and therefore
high demand for debt) the existing deleveraging cycle should likely have a significant impact on the
sector’s funding needs and ultimately their return on equity / profitability metrics.
Energy Lagged During Both Prior Deleveraging Cycles
Energy
outperformed
ahead of the last
deleveraging
cycle.
90
100
110
120
130
140
150
160
170
180
1985 1987 1989 1991 1993 1995 1997 1999 2001 2003 2005 2007 2009 2011
20
40
60
80
100
120
140
160
180
Private Debt (As a % of GDP, L) Energy Relative Sector Performance (R)
Energy stocks
underperformed in both
deleveraging episodes. ?
Source: ISI Portfolio Strategy.
8
9/26 ISI Group
Portfolio Factor Positioning For a Deleveraging Environment
Now that we have some understanding of how past periods of deleveraging have panned out for
market indices and sectors, we thought we should dive a little deeper into some of the quantitative
factors that outperformed during these periods. As we have shown, periods of deleveraging have
typically coincided with periods of economic normalization and above-average equity market
returns. Accordingly, the factors that have typically outperformed are also those that usually coincide
with improving economic prospects. On balance, stocks that are smaller in size, cheaper in
valuation and more domestically focused were the strongest. Below we list a handful of factors and
the corresponding speculative/defensive end of the spectrum that outperformed.
Factors That Have Outperformed In Past Deleveraging Periods
Interestingly, in the past few months we have seen some of these same factor performance trends
emerge in concert with the ascension of ‘deleveraging’ speak. Ironically, in a lower debt-to-GDP
environment, those firms with greater amounts of leverage were the ones to outperform their
conservative low-levered counterparts. The chart below illustrates the relative performance of
Higher vs. Lower ROE stocks in the S&P 500 during the last deleveraging period. The relative
performance trends tracked the ratio of leverage-to-GDP rather closely. If you believe we are
entering into a deleveraging period, this chart suggests that a portfolio stocked with high ROE firms
would be inconsistent the past performance trends.
S&P 500 Factor Chart: Higher vs. Lower ROE
1.10
1.12
1.14
1.16
1.18
1.20
1.22
1.24
1.26
1.28
1.30
1990 1991 1992 1993 1994 1995 1996 1997 1998
0.70
0.75
0.80
0.85
0.90
0.95
1.00
1.05
Private Debt % GDP (L) S&P 500 Relative Performance of ROE: High vs Low (R)
Lower ROE equities
outperformed during the
1990 deleveraging cycle
The past cycle of
deleveraging
suggest a bias for
lower ROE stocks.
Source: ISI Portfolio Strategy.
9
9/26 ISI Group
Stocks With Factor Profiles Consistent With
Outperformance During Past Deleveraging Periods
The following screen lists the top five stocks in each sector that possess the factor characteristics of
stocks that have historically outperformed during past periods of deleveraging. Although the data
show that a preference for Consumer Discretionary and Technology share is suggested, we
understand that many investors may be unable to take measureable sector positions. Therefore, we
provide the list below to help investors on an intra-sector basis. Email strategy@isigrp.com and your
ISI salesperson for a more complete list, or the entire S&P 500 ranked by these factors.
Company Foreign Market Debt / Earnings Div LT Price
Symbol Company Name Industry Exposure Cap Equity Yield ROE BETA Div Yld Growth 9/24/08
Consumer Discretionary
JNY Jones Apparel Group Inc. Apparel Accessories & Luxury Goods 8.5 1,529 39 6 3 2 3 10 18.33
LEN Lennar Corp. (Cl A) Homebuilding 0.0 2,373 75 -68 2 5 9 14.77
AN AutoNation Inc. Automotive Retail 0.0 2,244 42 11 6 2 0 9 12.70
KBH KB Home Homebuilding 1,575 170 -68 2 5 9 20.32
MDP Meredith Corp. Publishing 0.0 1,272 52 11 17 1 3 27.98
Consumer Staples
SVU SUPERVALU Inc. Food Retail 0.0 4,825 138 13 10 2 3 8 22.76
CCE Coca-Cola Enterprises Inc. Soft Drinks 29.8 8,191 285 8 1 2 6 16.79
SLE Sara Lee Corp. Packaged Foods & Meats 46.2 9,147 83 8 1 3 7 12.95
PBG Pepsi Bottling Group Inc. Soft Drinks 32.3 6,508 141 8 21 1 2 9 30.41
WFMI Whole Foods Market Inc. Food Retail 0.0 2,729 56 6 10 1 0 16 19.45
Energy
TSO Tesoro Corp. Oil & Gas Refining & Marketing 0.0 2,588 60 -4 2 2 10 18.78
VLO Valero Energy Corp. Oil & Gas Refining & Marketing 13.8 17,851 34 12 13 1 2 1 34.00
SUN Sunoco Inc. Oil & Gas Refining & Marketing 4,525 71 5 9 1 3 11 38.72
MRO Marathon Oil Corp. Integrated Oil & Gas 8.8 28,563 35 10 16 1 2 8 40.23
MEE Massey Energy Co. Coal & Consumable Fuels 0.0 3,313 147 2 1 0 50 41.02
Financials
HBAN Huntington Bancshares Inc. Regional Banks 0.0 3,406 130 17 2 1 7 5 9.30
GGP General Growth Properties Inc. Retail REITs 0.0 4,240 2 3 2 8 7 15.84
CMA Comerica Inc. Diversified Banks 5,269 253 11 9 1 9 6 35.02
AIV Apartment Investment & Management Co. Residential REITs 0.0 2,884 854 -4 1 7 6 32.99
DDR Developers Diversified Realty Corp. Retail REITs 0.0 3,744 244 3 5 1 8 6 31.18
Health Care
CVH Coventry Health Care Inc. Managed Health Care 0.0 5,078 44 11 17 1 0 12 33.48
KG King Pharmaceuticals Inc. Pharmaceuticals 0.0 2,369 15 15 5 0 0 9.61
WLP WellPoint Inc. Managed Health Care 0.0 23,370 46 10 13 1 0 12 45.64
THC Tenet Healthcare Corp. Health Care Facilities 2,864 -1 0 0 11 6.01
UNH UnitedHealth Group Inc. Managed Health Care 0.0 30,371 58 11 19 1 0 12 25.10
Industrials
AW Allied Waste Industries Inc. Environmental & Facilities Services 0.0 4,848 150 6 9 2 0 11 11.19
RRD R.R. Donnelley & Sons Co. Commercial Printing 23.3 5,267 78 11 5 1 4 15 24.88
CTAS Cintas Corp. Diversified Support Services 0.0 4,328 41 7 14 1 1 11 28.33
MAS Masco Corp. Building Products 21.2 6,324 100 6 4 1 5 13 17.97
TXT Textron Inc. Industrial Conglomerates 39.2 8,090 176 10 26 2 2 12 32.55
Information Technology
UIS Unisys Corp. IT Consulting & Other Services 57.0 1,111 272 -1 2 0 9 3.09
CIEN Ciena Corp. Communications Equipment 16.1 985 79 6 9 2 0 16 10.91
CVG Convergys Corp. Data Processing & Outsourced Services 13.9 1,813 18 9 11 1 0 13 14.88
FIS Fidelity National Information Services Inc. Data Processing & Outsourced Services 3,693 106 9 12 1 1 13 19.48
JAVA Sun Microsystems Inc. Computer Hardware 59.3 5,881 23 8 7 2 0 8 7.82
Materials
NUE Nucor Corp. Steel 0.0 14,303 38 11 23 2 4 5 45.18
IP International Paper Co. Paper Products 21.9 11,836 94 8 10 1 4 6 27.68
MWV MeadWestvaco Corp. Paper Products 30.9 4,299 62 8 8 1 3 11 25.17
WY Weyerhaeuser Co. Forest Products 19.1 12,867 92 -4 1 4 6 60.90
EMN Eastman Chemical Co. Diversified Chemicals 42.0 4,414 72 9 17 1 3 6 57.84
Telecommunication Services
Q Qwest Communications International Inc. Integrated Telecommunication Services 6,002 2,658 15 534 2 8 3 3.44
EQ Embarq Corp. Integrated Telecommunication Services 0.0 6,065 6,616 11 818 1 6 2 42.06
Utilities
PNW Pinnacle West Capital Corp. Electric Utilities 0.0 3,534 82 8 8 1 6 4 35.09
NI NiSource Inc. Multi-Utilities 0.0 4,108 126 8 6 0 6 4 14.98
AEE Ameren Corp. Multi-Utilities 0.0 8,314 90 8 10 1 6 4 39.57
CMS CMS Energy Corp. Multi-Utilities 0.0 2,841 250 4 5 1 3 3 12.60
DTE DTE Energy Co. Multi-Utilities 0.0 6,659 123 6 8 1 5 5 40.83

More Related Content

What's hot

InvestmentCommitteeResearch_AlchemyCapital_March2008
InvestmentCommitteeResearch_AlchemyCapital_March2008InvestmentCommitteeResearch_AlchemyCapital_March2008
InvestmentCommitteeResearch_AlchemyCapital_March2008Jean-Marc Bloch-Lambert
 
Capital Market Outlook
Capital Market OutlookCapital Market Outlook
Capital Market Outlookeru1659
 
What Is Recession
What Is RecessionWhat Is Recession
What Is Recessionsaurabh119
 
To the Point, October 27 2009
To the Point, October 27 2009To the Point, October 27 2009
To the Point, October 27 2009Swedbank
 
Business, People, and COVID: A Roadmap
Business, People, and COVID: A RoadmapBusiness, People, and COVID: A Roadmap
Business, People, and COVID: A RoadmapBaburaj Nair
 
Fasanara Capital | Investment Outlook | December 1st 2014
Fasanara Capital | Investment Outlook | December 1st 2014Fasanara Capital | Investment Outlook | December 1st 2014
Fasanara Capital | Investment Outlook | December 1st 2014Fasanara Capital ltd
 
Fasanara Capital | Investment Outlook | June 1st 2015
Fasanara Capital | Investment Outlook | June 1st 2015Fasanara Capital | Investment Outlook | June 1st 2015
Fasanara Capital | Investment Outlook | June 1st 2015Fasanara Capital ltd
 
Recession-US & Japan
Recession-US & JapanRecession-US & Japan
Recession-US & JapanGaurav Surana
 
Effective Measures Against the Recession
Effective Measures Against the RecessionEffective Measures Against the Recession
Effective Measures Against the RecessionMadrid Network
 
The Oliver Wyman Risk Journal Volume 5
The Oliver Wyman Risk Journal Volume 5The Oliver Wyman Risk Journal Volume 5
The Oliver Wyman Risk Journal Volume 5Dr. Joachim Krotz
 
Veripath Q4 2021 Investor Letter
Veripath Q4 2021 Investor LetterVeripath Q4 2021 Investor Letter
Veripath Q4 2021 Investor LetterVeripath Partners
 
Economic Review And Outlook
Economic Review And OutlookEconomic Review And Outlook
Economic Review And Outlookguestfd180e4
 
To the Point, No.8 - August 31, 2012
To the Point, No.8 - August 31, 2012To the Point, No.8 - August 31, 2012
To the Point, No.8 - August 31, 2012Swedbank
 
Monthly Forex Update by Saxo Bank
Monthly Forex Update by Saxo BankMonthly Forex Update by Saxo Bank
Monthly Forex Update by Saxo BankTrading Floor
 
Fasanara Capital | Investment Outlook | October 26th 2015
Fasanara Capital | Investment Outlook | October 26th 2015Fasanara Capital | Investment Outlook | October 26th 2015
Fasanara Capital | Investment Outlook | October 26th 2015Fasanara Capital ltd
 

What's hot (18)

The Great Leveraging-Comments
The Great Leveraging-CommentsThe Great Leveraging-Comments
The Great Leveraging-Comments
 
InvestmentCommitteeResearch_AlchemyCapital_March2008
InvestmentCommitteeResearch_AlchemyCapital_March2008InvestmentCommitteeResearch_AlchemyCapital_March2008
InvestmentCommitteeResearch_AlchemyCapital_March2008
 
Capital Market Outlook
Capital Market OutlookCapital Market Outlook
Capital Market Outlook
 
MTBiz September 2014
MTBiz September 2014MTBiz September 2014
MTBiz September 2014
 
What Is Recession
What Is RecessionWhat Is Recession
What Is Recession
 
To the Point, October 27 2009
To the Point, October 27 2009To the Point, October 27 2009
To the Point, October 27 2009
 
Business, People, and COVID: A Roadmap
Business, People, and COVID: A RoadmapBusiness, People, and COVID: A Roadmap
Business, People, and COVID: A Roadmap
 
Fasanara Capital | Investment Outlook | December 1st 2014
Fasanara Capital | Investment Outlook | December 1st 2014Fasanara Capital | Investment Outlook | December 1st 2014
Fasanara Capital | Investment Outlook | December 1st 2014
 
Fasanara Capital | Investment Outlook | June 1st 2015
Fasanara Capital | Investment Outlook | June 1st 2015Fasanara Capital | Investment Outlook | June 1st 2015
Fasanara Capital | Investment Outlook | June 1st 2015
 
Recession-US & Japan
Recession-US & JapanRecession-US & Japan
Recession-US & Japan
 
Effective Measures Against the Recession
Effective Measures Against the RecessionEffective Measures Against the Recession
Effective Measures Against the Recession
 
The Oliver Wyman Risk Journal Volume 5
The Oliver Wyman Risk Journal Volume 5The Oliver Wyman Risk Journal Volume 5
The Oliver Wyman Risk Journal Volume 5
 
Veripath Q4 2021 Investor Letter
Veripath Q4 2021 Investor LetterVeripath Q4 2021 Investor Letter
Veripath Q4 2021 Investor Letter
 
Economic Review And Outlook
Economic Review And OutlookEconomic Review And Outlook
Economic Review And Outlook
 
To the Point, No.8 - August 31, 2012
To the Point, No.8 - August 31, 2012To the Point, No.8 - August 31, 2012
To the Point, No.8 - August 31, 2012
 
George perendia
George perendiaGeorge perendia
George perendia
 
Monthly Forex Update by Saxo Bank
Monthly Forex Update by Saxo BankMonthly Forex Update by Saxo Bank
Monthly Forex Update by Saxo Bank
 
Fasanara Capital | Investment Outlook | October 26th 2015
Fasanara Capital | Investment Outlook | October 26th 2015Fasanara Capital | Investment Outlook | October 26th 2015
Fasanara Capital | Investment Outlook | October 26th 2015
 

Similar to The deleveraging cycle

Michael Durante Western Reserve Blackwall Partners 2011 outlook primer- final
Michael Durante Western Reserve Blackwall Partners   2011 outlook primer- finalMichael Durante Western Reserve Blackwall Partners   2011 outlook primer- final
Michael Durante Western Reserve Blackwall Partners 2011 outlook primer- finalMichael Durante
 
BNP PARIBAS - Investment Outlook 2023
BNP PARIBAS - Investment Outlook 2023BNP PARIBAS - Investment Outlook 2023
BNP PARIBAS - Investment Outlook 2023Investoida
 
SJP Special Investment Bulletin Feb 2016
SJP Special Investment Bulletin Feb 2016SJP Special Investment Bulletin Feb 2016
SJP Special Investment Bulletin Feb 2016Tyler Stuart
 
The global financial crisis
The global financial crisisThe global financial crisis
The global financial crisisSpringer
 
State of the Construction and Surety Industry Report (2009)
State of the Construction and Surety Industry Report (2009)State of the Construction and Surety Industry Report (2009)
State of the Construction and Surety Industry Report (2009)Lisa Dehner
 
State of the Construction and Surety Industry Report (2009)
State of the Construction and Surety Industry Report (2009)State of the Construction and Surety Industry Report (2009)
State of the Construction and Surety Industry Report (2009)The Vertex Companies, LLC
 
Fasanara Capital | Investment Outlook May 2012
Fasanara Capital | Investment Outlook May 2012Fasanara Capital | Investment Outlook May 2012
Fasanara Capital | Investment Outlook May 2012Fasanara Capital ltd
 
US Business Cycle Timing
US Business Cycle TimingUS Business Cycle Timing
US Business Cycle TimingPhilipSuttle
 
Watch newsletter nov2014
Watch newsletter nov2014Watch newsletter nov2014
Watch newsletter nov2014Alan Milligan
 
1 St Qtr. 2008 Pri Retail Analytics
1 St Qtr. 2008 Pri Retail Analytics1 St Qtr. 2008 Pri Retail Analytics
1 St Qtr. 2008 Pri Retail Analyticsdigital.signage
 
Point break A LT Technical Analysis Approach by investlogic
Point break A LT Technical Analysis Approach by investlogicPoint break A LT Technical Analysis Approach by investlogic
Point break A LT Technical Analysis Approach by investlogicClaude Gaudin
 
Hyre Weekly Commentary
Hyre Weekly CommentaryHyre Weekly Commentary
Hyre Weekly Commentaryhyrejam
 
A strategy for adjustment
A strategy for adjustmentA strategy for adjustment
A strategy for adjustmentWesley Fogel
 
RESEARCH - The Fairfax Monitor - Edition 2
RESEARCH - The Fairfax Monitor - Edition 2RESEARCH - The Fairfax Monitor - Edition 2
RESEARCH - The Fairfax Monitor - Edition 2Stephen Martin
 
A strategy for the upturn
A strategy for the upturnA strategy for the upturn
A strategy for the upturnWesley Fogel
 
Occam\'s Razor on Inflation
Occam\'s Razor on InflationOccam\'s Razor on Inflation
Occam\'s Razor on InflationMAMC84
 

Similar to The deleveraging cycle (20)

Michael Durante Western Reserve Blackwall Partners 2011 outlook primer- final
Michael Durante Western Reserve Blackwall Partners   2011 outlook primer- finalMichael Durante Western Reserve Blackwall Partners   2011 outlook primer- final
Michael Durante Western Reserve Blackwall Partners 2011 outlook primer- final
 
marketview-_7-12
marketview-_7-12marketview-_7-12
marketview-_7-12
 
BNP PARIBAS - Investment Outlook 2023
BNP PARIBAS - Investment Outlook 2023BNP PARIBAS - Investment Outlook 2023
BNP PARIBAS - Investment Outlook 2023
 
SJP Special Investment Bulletin Feb 2016
SJP Special Investment Bulletin Feb 2016SJP Special Investment Bulletin Feb 2016
SJP Special Investment Bulletin Feb 2016
 
The global financial crisis
The global financial crisisThe global financial crisis
The global financial crisis
 
State of the Construction and Surety Industry Report (2009)
State of the Construction and Surety Industry Report (2009)State of the Construction and Surety Industry Report (2009)
State of the Construction and Surety Industry Report (2009)
 
State of the Construction and Surety Industry Report (2009)
State of the Construction and Surety Industry Report (2009)State of the Construction and Surety Industry Report (2009)
State of the Construction and Surety Industry Report (2009)
 
U.S. Real Rates
U.S. Real RatesU.S. Real Rates
U.S. Real Rates
 
The Day After
The Day AfterThe Day After
The Day After
 
Fasanara Capital | Investment Outlook May 2012
Fasanara Capital | Investment Outlook May 2012Fasanara Capital | Investment Outlook May 2012
Fasanara Capital | Investment Outlook May 2012
 
US Business Cycle Timing
US Business Cycle TimingUS Business Cycle Timing
US Business Cycle Timing
 
Watch newsletter nov2014
Watch newsletter nov2014Watch newsletter nov2014
Watch newsletter nov2014
 
1 St Qtr. 2008 Pri Retail Analytics
1 St Qtr. 2008 Pri Retail Analytics1 St Qtr. 2008 Pri Retail Analytics
1 St Qtr. 2008 Pri Retail Analytics
 
Aftershock
AftershockAftershock
Aftershock
 
Point break A LT Technical Analysis Approach by investlogic
Point break A LT Technical Analysis Approach by investlogicPoint break A LT Technical Analysis Approach by investlogic
Point break A LT Technical Analysis Approach by investlogic
 
Hyre Weekly Commentary
Hyre Weekly CommentaryHyre Weekly Commentary
Hyre Weekly Commentary
 
A strategy for adjustment
A strategy for adjustmentA strategy for adjustment
A strategy for adjustment
 
RESEARCH - The Fairfax Monitor - Edition 2
RESEARCH - The Fairfax Monitor - Edition 2RESEARCH - The Fairfax Monitor - Edition 2
RESEARCH - The Fairfax Monitor - Edition 2
 
A strategy for the upturn
A strategy for the upturnA strategy for the upturn
A strategy for the upturn
 
Occam\'s Razor on Inflation
Occam\'s Razor on InflationOccam\'s Razor on Inflation
Occam\'s Razor on Inflation
 

More from Kevin Cheng, CFA

Equity Strategy - Consumer Staples
Equity Strategy - Consumer StaplesEquity Strategy - Consumer Staples
Equity Strategy - Consumer StaplesKevin Cheng, CFA
 
Brookfield Office Properties - BPO - Quarterly Earnings
Brookfield Office Properties - BPO - Quarterly EarningsBrookfield Office Properties - BPO - Quarterly Earnings
Brookfield Office Properties - BPO - Quarterly EarningsKevin Cheng, CFA
 
First Capital Realty - FCR
First Capital Realty - FCRFirst Capital Realty - FCR
First Capital Realty - FCRKevin Cheng, CFA
 
CXP initiation - Office REIT
CXP initiation - Office REITCXP initiation - Office REIT
CXP initiation - Office REITKevin Cheng, CFA
 
Canadian Asset Managers - Initiation Report
Canadian Asset Managers - Initiation ReportCanadian Asset Managers - Initiation Report
Canadian Asset Managers - Initiation ReportKevin Cheng, CFA
 
Equity Strategy - Staying Defensive
Equity Strategy - Staying DefensiveEquity Strategy - Staying Defensive
Equity Strategy - Staying DefensiveKevin Cheng, CFA
 
Asset Managers - Recession risks, Trust Banks & Asset Mgrs
Asset Managers - Recession risks, Trust Banks & Asset MgrsAsset Managers - Recession risks, Trust Banks & Asset Mgrs
Asset Managers - Recession risks, Trust Banks & Asset MgrsKevin Cheng, CFA
 
Asset Managers - Defensive But Not Immune
Asset Managers - Defensive But Not ImmuneAsset Managers - Defensive But Not Immune
Asset Managers - Defensive But Not ImmuneKevin Cheng, CFA
 

More from Kevin Cheng, CFA (13)

Equity Strategy - Consumer Staples
Equity Strategy - Consumer StaplesEquity Strategy - Consumer Staples
Equity Strategy - Consumer Staples
 
Brookfield Office Properties - BPO - Quarterly Earnings
Brookfield Office Properties - BPO - Quarterly EarningsBrookfield Office Properties - BPO - Quarterly Earnings
Brookfield Office Properties - BPO - Quarterly Earnings
 
First Capital Realty - FCR
First Capital Realty - FCRFirst Capital Realty - FCR
First Capital Realty - FCR
 
Equity Strategy - TSX
Equity Strategy - TSXEquity Strategy - TSX
Equity Strategy - TSX
 
Focus - Economic Research
Focus - Economic ResearchFocus - Economic Research
Focus - Economic Research
 
DEA Initiation Report
DEA Initiation ReportDEA Initiation Report
DEA Initiation Report
 
CXP initiation - Office REIT
CXP initiation - Office REITCXP initiation - Office REIT
CXP initiation - Office REIT
 
Canadian Asset Managers - Initiation Report
Canadian Asset Managers - Initiation ReportCanadian Asset Managers - Initiation Report
Canadian Asset Managers - Initiation Report
 
Agf market outlook
Agf market outlookAgf market outlook
Agf market outlook
 
Equity Strategy - Staying Defensive
Equity Strategy - Staying DefensiveEquity Strategy - Staying Defensive
Equity Strategy - Staying Defensive
 
Asset Managers - Recession risks, Trust Banks & Asset Mgrs
Asset Managers - Recession risks, Trust Banks & Asset MgrsAsset Managers - Recession risks, Trust Banks & Asset Mgrs
Asset Managers - Recession risks, Trust Banks & Asset Mgrs
 
Asset Managers - Defensive But Not Immune
Asset Managers - Defensive But Not ImmuneAsset Managers - Defensive But Not Immune
Asset Managers - Defensive But Not Immune
 
Market Strategy
Market StrategyMarket Strategy
Market Strategy
 

Recently uploaded

The Economic History of the U.S. Lecture 20.pdf
The Economic History of the U.S. Lecture 20.pdfThe Economic History of the U.S. Lecture 20.pdf
The Economic History of the U.S. Lecture 20.pdfGale Pooley
 
Stock Market Brief Deck (Under Pressure).pdf
Stock Market Brief Deck (Under Pressure).pdfStock Market Brief Deck (Under Pressure).pdf
Stock Market Brief Deck (Under Pressure).pdfMichael Silva
 
Vip Call US 📞 7738631006 ✅Call Girls In Sakinaka ( Mumbai )
Vip Call US 📞 7738631006 ✅Call Girls In Sakinaka ( Mumbai )Vip Call US 📞 7738631006 ✅Call Girls In Sakinaka ( Mumbai )
Vip Call US 📞 7738631006 ✅Call Girls In Sakinaka ( Mumbai )Pooja Nehwal
 
00_Main ppt_MeetupDORA&CyberSecurity.pptx
00_Main ppt_MeetupDORA&CyberSecurity.pptx00_Main ppt_MeetupDORA&CyberSecurity.pptx
00_Main ppt_MeetupDORA&CyberSecurity.pptxFinTech Belgium
 
03_Emmanuel Ndiaye_Degroof Petercam.pptx
03_Emmanuel Ndiaye_Degroof Petercam.pptx03_Emmanuel Ndiaye_Degroof Petercam.pptx
03_Emmanuel Ndiaye_Degroof Petercam.pptxFinTech Belgium
 
(DIYA) Bhumkar Chowk Call Girls Just Call 7001035870 [ Cash on Delivery ] Pun...
(DIYA) Bhumkar Chowk Call Girls Just Call 7001035870 [ Cash on Delivery ] Pun...(DIYA) Bhumkar Chowk Call Girls Just Call 7001035870 [ Cash on Delivery ] Pun...
(DIYA) Bhumkar Chowk Call Girls Just Call 7001035870 [ Cash on Delivery ] Pun...ranjana rawat
 
Solution Manual for Financial Accounting, 11th Edition by Robert Libby, Patri...
Solution Manual for Financial Accounting, 11th Edition by Robert Libby, Patri...Solution Manual for Financial Accounting, 11th Edition by Robert Libby, Patri...
Solution Manual for Financial Accounting, 11th Edition by Robert Libby, Patri...ssifa0344
 
Independent Call Girl Number in Kurla Mumbai📲 Pooja Nehwal 9892124323 💞 Full ...
Independent Call Girl Number in Kurla Mumbai📲 Pooja Nehwal 9892124323 💞 Full ...Independent Call Girl Number in Kurla Mumbai📲 Pooja Nehwal 9892124323 💞 Full ...
Independent Call Girl Number in Kurla Mumbai📲 Pooja Nehwal 9892124323 💞 Full ...Pooja Nehwal
 
Booking open Available Pune Call Girls Talegaon Dabhade 6297143586 Call Hot ...
Booking open Available Pune Call Girls Talegaon Dabhade  6297143586 Call Hot ...Booking open Available Pune Call Girls Talegaon Dabhade  6297143586 Call Hot ...
Booking open Available Pune Call Girls Talegaon Dabhade 6297143586 Call Hot ...Call Girls in Nagpur High Profile
 
VVIP Pune Call Girls Katraj (7001035870) Pune Escorts Nearby with Complete Sa...
VVIP Pune Call Girls Katraj (7001035870) Pune Escorts Nearby with Complete Sa...VVIP Pune Call Girls Katraj (7001035870) Pune Escorts Nearby with Complete Sa...
VVIP Pune Call Girls Katraj (7001035870) Pune Escorts Nearby with Complete Sa...Call Girls in Nagpur High Profile
 
The Economic History of the U.S. Lecture 22.pdf
The Economic History of the U.S. Lecture 22.pdfThe Economic History of the U.S. Lecture 22.pdf
The Economic History of the U.S. Lecture 22.pdfGale Pooley
 
CALL ON ➥8923113531 🔝Call Girls Gomti Nagar Lucknow best sexual service
CALL ON ➥8923113531 🔝Call Girls Gomti Nagar Lucknow best sexual serviceCALL ON ➥8923113531 🔝Call Girls Gomti Nagar Lucknow best sexual service
CALL ON ➥8923113531 🔝Call Girls Gomti Nagar Lucknow best sexual serviceanilsa9823
 
Booking open Available Pune Call Girls Shivane 6297143586 Call Hot Indian Gi...
Booking open Available Pune Call Girls Shivane  6297143586 Call Hot Indian Gi...Booking open Available Pune Call Girls Shivane  6297143586 Call Hot Indian Gi...
Booking open Available Pune Call Girls Shivane 6297143586 Call Hot Indian Gi...Call Girls in Nagpur High Profile
 
Booking open Available Pune Call Girls Wadgaon Sheri 6297143586 Call Hot Ind...
Booking open Available Pune Call Girls Wadgaon Sheri  6297143586 Call Hot Ind...Booking open Available Pune Call Girls Wadgaon Sheri  6297143586 Call Hot Ind...
Booking open Available Pune Call Girls Wadgaon Sheri 6297143586 Call Hot Ind...Call Girls in Nagpur High Profile
 
The Economic History of the U.S. Lecture 26.pdf
The Economic History of the U.S. Lecture 26.pdfThe Economic History of the U.S. Lecture 26.pdf
The Economic History of the U.S. Lecture 26.pdfGale Pooley
 
Call Girls Service Nagpur Maya Call 7001035870 Meet With Nagpur Escorts
Call Girls Service Nagpur Maya Call 7001035870 Meet With Nagpur EscortsCall Girls Service Nagpur Maya Call 7001035870 Meet With Nagpur Escorts
Call Girls Service Nagpur Maya Call 7001035870 Meet With Nagpur Escortsranjana rawat
 
The Economic History of the U.S. Lecture 17.pdf
The Economic History of the U.S. Lecture 17.pdfThe Economic History of the U.S. Lecture 17.pdf
The Economic History of the U.S. Lecture 17.pdfGale Pooley
 

Recently uploaded (20)

The Economic History of the U.S. Lecture 20.pdf
The Economic History of the U.S. Lecture 20.pdfThe Economic History of the U.S. Lecture 20.pdf
The Economic History of the U.S. Lecture 20.pdf
 
VIP Call Girl in Mira Road 💧 9920725232 ( Call Me ) Get A New Crush Everyday ...
VIP Call Girl in Mira Road 💧 9920725232 ( Call Me ) Get A New Crush Everyday ...VIP Call Girl in Mira Road 💧 9920725232 ( Call Me ) Get A New Crush Everyday ...
VIP Call Girl in Mira Road 💧 9920725232 ( Call Me ) Get A New Crush Everyday ...
 
Stock Market Brief Deck (Under Pressure).pdf
Stock Market Brief Deck (Under Pressure).pdfStock Market Brief Deck (Under Pressure).pdf
Stock Market Brief Deck (Under Pressure).pdf
 
Vip Call US 📞 7738631006 ✅Call Girls In Sakinaka ( Mumbai )
Vip Call US 📞 7738631006 ✅Call Girls In Sakinaka ( Mumbai )Vip Call US 📞 7738631006 ✅Call Girls In Sakinaka ( Mumbai )
Vip Call US 📞 7738631006 ✅Call Girls In Sakinaka ( Mumbai )
 
00_Main ppt_MeetupDORA&CyberSecurity.pptx
00_Main ppt_MeetupDORA&CyberSecurity.pptx00_Main ppt_MeetupDORA&CyberSecurity.pptx
00_Main ppt_MeetupDORA&CyberSecurity.pptx
 
VIP Independent Call Girls in Andheri 🌹 9920725232 ( Call Me ) Mumbai Escorts...
VIP Independent Call Girls in Andheri 🌹 9920725232 ( Call Me ) Mumbai Escorts...VIP Independent Call Girls in Andheri 🌹 9920725232 ( Call Me ) Mumbai Escorts...
VIP Independent Call Girls in Andheri 🌹 9920725232 ( Call Me ) Mumbai Escorts...
 
03_Emmanuel Ndiaye_Degroof Petercam.pptx
03_Emmanuel Ndiaye_Degroof Petercam.pptx03_Emmanuel Ndiaye_Degroof Petercam.pptx
03_Emmanuel Ndiaye_Degroof Petercam.pptx
 
(DIYA) Bhumkar Chowk Call Girls Just Call 7001035870 [ Cash on Delivery ] Pun...
(DIYA) Bhumkar Chowk Call Girls Just Call 7001035870 [ Cash on Delivery ] Pun...(DIYA) Bhumkar Chowk Call Girls Just Call 7001035870 [ Cash on Delivery ] Pun...
(DIYA) Bhumkar Chowk Call Girls Just Call 7001035870 [ Cash on Delivery ] Pun...
 
Solution Manual for Financial Accounting, 11th Edition by Robert Libby, Patri...
Solution Manual for Financial Accounting, 11th Edition by Robert Libby, Patri...Solution Manual for Financial Accounting, 11th Edition by Robert Libby, Patri...
Solution Manual for Financial Accounting, 11th Edition by Robert Libby, Patri...
 
Independent Call Girl Number in Kurla Mumbai📲 Pooja Nehwal 9892124323 💞 Full ...
Independent Call Girl Number in Kurla Mumbai📲 Pooja Nehwal 9892124323 💞 Full ...Independent Call Girl Number in Kurla Mumbai📲 Pooja Nehwal 9892124323 💞 Full ...
Independent Call Girl Number in Kurla Mumbai📲 Pooja Nehwal 9892124323 💞 Full ...
 
Booking open Available Pune Call Girls Talegaon Dabhade 6297143586 Call Hot ...
Booking open Available Pune Call Girls Talegaon Dabhade  6297143586 Call Hot ...Booking open Available Pune Call Girls Talegaon Dabhade  6297143586 Call Hot ...
Booking open Available Pune Call Girls Talegaon Dabhade 6297143586 Call Hot ...
 
VVIP Pune Call Girls Katraj (7001035870) Pune Escorts Nearby with Complete Sa...
VVIP Pune Call Girls Katraj (7001035870) Pune Escorts Nearby with Complete Sa...VVIP Pune Call Girls Katraj (7001035870) Pune Escorts Nearby with Complete Sa...
VVIP Pune Call Girls Katraj (7001035870) Pune Escorts Nearby with Complete Sa...
 
The Economic History of the U.S. Lecture 22.pdf
The Economic History of the U.S. Lecture 22.pdfThe Economic History of the U.S. Lecture 22.pdf
The Economic History of the U.S. Lecture 22.pdf
 
VIP Call Girl Service Andheri West ⚡ 9920725232 What It Takes To Be The Best ...
VIP Call Girl Service Andheri West ⚡ 9920725232 What It Takes To Be The Best ...VIP Call Girl Service Andheri West ⚡ 9920725232 What It Takes To Be The Best ...
VIP Call Girl Service Andheri West ⚡ 9920725232 What It Takes To Be The Best ...
 
CALL ON ➥8923113531 🔝Call Girls Gomti Nagar Lucknow best sexual service
CALL ON ➥8923113531 🔝Call Girls Gomti Nagar Lucknow best sexual serviceCALL ON ➥8923113531 🔝Call Girls Gomti Nagar Lucknow best sexual service
CALL ON ➥8923113531 🔝Call Girls Gomti Nagar Lucknow best sexual service
 
Booking open Available Pune Call Girls Shivane 6297143586 Call Hot Indian Gi...
Booking open Available Pune Call Girls Shivane  6297143586 Call Hot Indian Gi...Booking open Available Pune Call Girls Shivane  6297143586 Call Hot Indian Gi...
Booking open Available Pune Call Girls Shivane 6297143586 Call Hot Indian Gi...
 
Booking open Available Pune Call Girls Wadgaon Sheri 6297143586 Call Hot Ind...
Booking open Available Pune Call Girls Wadgaon Sheri  6297143586 Call Hot Ind...Booking open Available Pune Call Girls Wadgaon Sheri  6297143586 Call Hot Ind...
Booking open Available Pune Call Girls Wadgaon Sheri 6297143586 Call Hot Ind...
 
The Economic History of the U.S. Lecture 26.pdf
The Economic History of the U.S. Lecture 26.pdfThe Economic History of the U.S. Lecture 26.pdf
The Economic History of the U.S. Lecture 26.pdf
 
Call Girls Service Nagpur Maya Call 7001035870 Meet With Nagpur Escorts
Call Girls Service Nagpur Maya Call 7001035870 Meet With Nagpur EscortsCall Girls Service Nagpur Maya Call 7001035870 Meet With Nagpur Escorts
Call Girls Service Nagpur Maya Call 7001035870 Meet With Nagpur Escorts
 
The Economic History of the U.S. Lecture 17.pdf
The Economic History of the U.S. Lecture 17.pdfThe Economic History of the U.S. Lecture 17.pdf
The Economic History of the U.S. Lecture 17.pdf
 

The deleveraging cycle

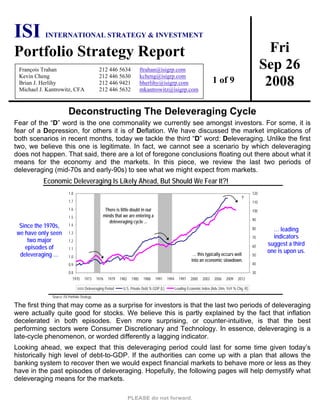
  • 1. Fri Sep 26 2008 ISI INTERNATIONAL STRATEGY & INVESTMENT Portfolio Strategy Report François Trahan 212 446 5634 ftrahan@isigrp.com Kevin Cheng 212 446 5630 kcheng@isigrp.com Brian J. Herlihy 212 446 9421 bherlihy@isigrp.com Michael J. Kantrowitz, CFA 212 446 5632 mkantrowitz@isigrp.com 1 of 9 Deconstructing The Deleveraging Cycle Fear of the “D” word is the one commonality we currently see amongst investors. For some, it is fear of a Depression, for others it is of Deflation. We have discussed the market implications of both scenarios in recent months, today we tackle the third “D” word: Deleveraging. Unlike the first two, we believe this one is legitimate. In fact, we cannot see a scenario by which deleveraging does not happen. That said, there are a lot of foregone conclusions floating out there about what it means for the economy and the markets. In this piece, we review the last two periods of deleveraging (mid-70s and early-90s) to see what we might expect from markets. Economic Deleveraging Is Likely Ahead, But Should We Fear It?! Since the 1970s, we have only seen two major episodes of deleveraging … 0.8 0.9 1.0 1.1 1.2 1.3 1.4 1.5 1.6 1.7 1.8 1970 1973 1976 1979 1982 1985 1988 1991 1994 1997 2000 2003 2006 2009 2012 30 40 50 60 70 80 90 100 110 120 Deleveraging Period U.S. Private Debt % GDP (L) Leading Economic Index (Adv 24m, YoY % Chg, R) … this typically occurs well into an economic slowdown. ? There is little doubt in our minds that we are entering a deleveraging cycle ... … leading indicators suggest a third one is upon us. Source: ISI Portfolio Strategy. The first thing that may come as a surprise for investors is that the last two periods of deleveraging were actually quite good for stocks. We believe this is partly explained by the fact that inflation decelerated in both episodes. Even more surprising, or counter-intuitive, is that the best performing sectors were Consumer Discretionary and Technology. In essence, deleveraging is a late-cycle phenomenon, or worded differently a lagging indicator. Looking ahead, we expect that this deleveraging period could last for some time given today’s historically high level of debt-to-GDP. If the authorities can come up with a plan that allows the banking system to recover then we would expect financial markets to behave more or less as they have in the past episodes of deleveraging. Hopefully, the following pages will help demystify what deleveraging means for the markets.
  • 2. 2 9/26 ISI Group Market and Economic Implications of Deleveraging Thus far, 2008 has been a year filled with “D” words. The credit crisis has caused fear to loom over the markets as “D” words ranging from Deleverage to Depression have created investor anxiety. In recent months, fears of inflation have transitioned into hopes for Disinflation with some even raising the specter of Deflation. We think the largest-ever policy response from the Fed is likely to minimize the likelihood of the two most worrisome “D” words – Depression and Deflation. However we believe that Disinflation and Deleveraging are two trends that lie ahead of us. As the cover chart illustrates, economic deleveraging in not something new, it is a normal symptom of our economic cycle. In every decade since the 70s we have seen periods of deleveraging, albeit some longer than others. In the following pages we deconstruct two of the longer periods of economic deleveraging in the past 30 years, the mid 1970s and the early 1990s, and discuss the potential implications for markets and the economy from the likely upcoming deleveraging cycle. Macroeconomic & Market Trends To Expect During A Deleveraging Cycle In the past couple of days, investors have been glued to the television watching Bernanke and Paulson plead their case while they are probed by politicians asking questions regarding the solution for the current financial and economic disarray. To be sure, the outcome of a future deleveraging cycle will also depend on the resolution of the bailout in question. Our studies of financial market history, specifically of past booms and bust cycle, showed that busts met with an aggressive policy response are more likely to avoid a “Minskey Moment” (a downward spiral of asset/debt deflation). On the contrary, students of the Austrian school of Economics would argue that ineffective central bank policies are partly to blame for past boom and bust cycles. Putting the Keynesian vs. Austrian economics debate aside, we believe that the Fed’s proactive policy response will help the U.S. economy avoid a debt deflation spiral and more likely allow for a more ‘normal’ deleveraging process in the years to come. The chart on the cover suggests that debt as a percent of GDP should likely slow for at least the next two years. Seeing that this deleveraging process is inherently lagging, we would caution investors from becoming overly bearish going forward for this reason alone. In fact, the last two major periods of deleveraging were actually very good periods for equities and the economy. In some respects, this process of economic normalization is a natural part of the economy cycle. The table above summarizes the 1970s and 1990s periods of deleveraging. On balance, these were periods where inflation was declining and economic prospects, particularly in the housing sector, improved. On the policy front, deleveraging periods typically saw an accommodative Fed. For stocks, market returns were above average and sector leadership came from Discretionary and Technology. Ironically, the evidence suggests that deleveraging, and in many ways credit, is a lagging phenomenon, as these periods were actually some of the best for equity investors.
  • 3. 3 9/26 ISI Group During previous deleveraging cycles, one of the primary beneficiaries was the homebuilding industry. As the chart below demonstrates, building permits bottomed near the start of both deleveraging cycles in the early 70’s and mid 90’s and steadily rose thorough out the entire deleveraging process. Currently, building permits sit at their lowest levels in 18-years. In the third quarter, homebuilding stocks have performed particularly well on a relative basis. Interestingly, both periods of deleveraging saw homebuilders outperform the market. One Of The Primary Beneficiaries During Deleveraging Cycles: Homebuilding 200 700 1200 1700 2200 2700 1973 1975 1977 1979 1981 1983 1985 1987 1989 1991 1993 1995 1997 1999 2001 2003 2005 2007 2009 80 90 100 110 120 130 140 150 160 170 180 Building permits (000s, L) Private Debt (As a % of GDP, R) near term bottoms in building permits ? ? Counter- intuitively, the housing sector has typically benefitted from past deleveraging cycles. Source: ISI Portfolio Strategy. Another important economic factor that is typically influenced during deleveraging cycles is inflation. As the chart below illustrates, inflation typically trends lower during deleveraging cycles. Notably during both these cycles, core PCE declined by an average of 2.3%, suggesting that disinflation may be on the short-term horizon. Moreover, headline CPI also fell by an average of 4.7% ppts during both these deleveraging periods – lending further evidence for Ed and Nancy’s inflation estimate of 1% by the second half of 2009. Inflation Transitions Towards Disinflation During Deleveraging Cycles 0.5 1.5 2.5 3.5 4.5 5.5 6.5 7.5 8.5 9.5 10.5 1974 1976 1978 1980 1982 1984 1986 1988 1990 1992 1994 1996 1998 2000 2002 2004 2006 2008 2010 80 90 100 110 120 130 140 150 160 170 180 Core PCE Price Index (YoY % Chg, L) Private Debt (As a % of GDP, R) Inflation measures typically decline during deleveraging cycles ? ? Inflation tends to ebb in deleveraging cycles. Source: ISI Portfolio Strategy.
  • 4. 4 9/26 ISI Group From a historical perspective, the beginning of deleveraging cycles has typically signaled shifts in monetary policy. As the chart below shows, the Fed had previously adopted a more accommodative monetary policy during past deleveraging cycles. During the ‘74 deleveraging cycle, the Fed cut the overnight target rate by 450bps, while the early 90’s deleveraging cycle saw rate cuts of 275bps. Not surprisingly, the end of a deleveraging cycle is typically marked by monetary policy as well, as the Fed typically hikes rates. Policy Is Typically Accommodative During These Deleveraging Cycles The Fed has typically eased during prior deleveraging cycles … 0.0 5.0 10.0 15.0 20.0 25.0 1974 1976 1978 1980 1982 1984 1986 1988 1990 1992 1994 1996 1998 2000 2002 2004 2006 2008 2010 2012 80 90 100 110 120 130 140 150 160 170 180 Fed Funds Target Rate (%) Private Debt (As a % of GDP, R) Another rate cut in the cards? ? ? … this cycle has followed the same path so far. Source: ISI Portfolio Strategy. As we’ve previously written, one of the best indicators of future economic performance has been the yield curve. What typically happens during deleveraging cycles is that the Fed begins to cut rates to stimulate lending and economic prospects causing the yield curve to steepen notably. As the table below illustrates, the yield curve has historically steepened during periods of deleveraging and so far the current deleveraging cycle has traced a similar path. Since March 2008 (the estimated start of the current cycle), the yield curve has steepened by 65bps. At the margin, should the current deleveraging cycle play out like prior ones, this would imply that the Fed has more rate cuts in the pipeline ahead – consequently strengthening Tom Gallagher’s forecast for further rate cuts by the end of 2008. The Yield Curve Typically Steepens During Deleveraging Cycles Yield Curve Shifts During Deleveraging Cycles Start End Change in Slope of the Yield Curve Deleveraging Cycle: Sept '74 - Mar '76 -1.31 2.91 + 4.22 Deleveraging Cycle: Dec '90 - Jun '94 1.06 3.07 + 2.01 Yield curve typically steepens during deleveraging cycles. Source: ISI Portfolio Strategy.
  • 5. 5 9/26 ISI Group Despite all the bearish sentiment in the market regarding the deleveraging process, stocks have generally rallied during past cycles. As illustrated in the diagram below, during the 1974 deleveraging cycle, the S&P 500 rose 48% (or 37% CAGR), while during the deleveraging cycle of the early 90’s, the S&P 500 gained 38% (or 14% CAGR). At the margin, this suggests that equity markets can, and have rallied in past while the credit markets were still contracting. It was also interesting to note that each deleveraging cycle had been preceded by a market correction. The Market Has Proven Resilient In Past Deleveraging Cycles The past two deleveraging periods were preceded by market corrections … 1.5 1.7 1.9 2.1 2.3 2.5 2.7 2.9 3.1 3.3 1974 1976 1978 1980 1982 1984 1986 1988 1990 1992 1994 1996 1998 2000 2002 2004 2006 2008 2010 80 90 100 110 120 130 140 150 160 170 180 S&P 500 (L) Private Debt (As a % of GDP, R) Past periods of economic deleveraging have been good for equity investors. ? … and both periods also coincided with the beginning of bull markets. Source: ISI Portfolio Strategy. One of the notable implications of the deleveraging cycle on financial markets can be summed up into the cliché “size matters”. As the diagram below illustrates, small caps have typically outperformed their large cap counterparts during past deleveraging cycles. For example, during the 1974 deleveraging cycle, small caps outperformed large caps by 24%. In addition, small caps outperformed by 34% during the relative longer deleveraging cycle of the early 90’s. Size Matters: Small Caps Tend To Outperform During Deleveraging 0.50 1.50 2.50 3.50 4.50 5.50 6.50 1973 1975 1977 1979 1981 1983 1985 1987 1989 1991 1993 1995 1997 1999 2001 2003 2005 2007 2009 2011 85 95 105 115 125 135 145 155 165 175 185 Small to Large Cap Relative Performance Private Debt (As a % of GDP, R) Small Caps Typically Surge During Deleveraging ? During deleveraging cycles, small caps usually outperform their large cap counterparts. Source: ISI Portfolio Strategy.
  • 6. 6 9/26 ISI Group Don’t Be Defensive About Deleveraging Drilling down further, we analyzed what impact the deleveraging cycle had on various sector performances. As the table below illustrates, past deleveraging cycles had typically favored early- cyclicals sectors (i.e. Discretionary, Technology and Industrials). In contrast, we found that defensive sectors such as Utilities, Health Care and Telecom Services, generally underperformed during that part of the cycle. In fact, Discretionary and Technology were the only two sectors to outperform in both periods while Healthcare, Energy, Utilities and Telecom all underperformed in both episodes. Hence the title of this section, don’t be defensive about deleveraging! Annualized Sector Performance During Past Deleveraging Periods In the chart below, we illustrate one of the primary defensive sectors, the Healthcare sector. The chart demonstrates that Healthcare sector underperforms during the first deleveraging cycle of 74 by 14ppts. Indeed, this underperformance is also present during the 94 cycle, with Healthcare underperforming on a relative basis by 4ppts. Coincidentally, the Utility sector also demonstrated considerable underperformance during these two periods, with relative underperformance of 13 ppts in the ’74 cycle and 10 ppts in the early 90’s. Healthcare & Defensive Sectors Have Typically Underperformed In These Cycles 90 92 94 96 98 100 102 104 1974 1975 1976 1977 1978 1979 1980 1981 1982 1983 1984 0.16 0.18 0.20 0.22 0.24 0.26 0.28 0.30 0.32 Private Debt (As a % of GDP, L) Health Care Relative Sector Performance (R) Healthcare stocks underperformed in both periods of deleveraging! Healthcare tends to underperform in deleveraging cycles as leading indicators grind higher. Source: ISI Portfolio Strategy.
  • 7. 7 9/26 ISI Group In contrast to the defensive sectors, early-cyclical stocks typically performed well during periods of deleveraging. One of the early cyclical segments that faired the best was Discretionary. As the chart below demonstrates, the Discretionary sector managed to outperform the index by 4.2 ppts during the previous deleveraging cycle. Through our lens, we expect this trend in outperformance to be maintained during this deleveraging cycle as economic prospects rebound. Discretionary Was Among The Top Performers In The Last Two Cycles 80 90 100 110 120 130 140 150 160 170 180 1985 1987 1989 1991 1993 1995 1997 1999 2001 2003 2005 2007 2009 2011 55 65 75 85 95 105 115 125 135 Private Debt (As a % of GDP, L) Consumer Discretionary Relative Sector Performance (R) Discretionary stocks were the strongest performers in past deleveraging periods. ? ? The Discretionary was one of the top relative performers during the last deleveraging cycle. Source: ISI Portfolio Strategy. As we’ve previously written, the flipside to Discretionary outperformance has been Energy underperformance and this thematic trade remained largely intact during the prior two deleveraging cycles. As the chart below illustrates, the Energy sector underperformed by about 13 ppts during the early 1990 deleveraging cycle and also underperformed by 10 ppts during the cycle of 1974. In our view, given the current needs of the energy sector (i.e., high capital intensive costs and therefore high demand for debt) the existing deleveraging cycle should likely have a significant impact on the sector’s funding needs and ultimately their return on equity / profitability metrics. Energy Lagged During Both Prior Deleveraging Cycles Energy outperformed ahead of the last deleveraging cycle. 90 100 110 120 130 140 150 160 170 180 1985 1987 1989 1991 1993 1995 1997 1999 2001 2003 2005 2007 2009 2011 20 40 60 80 100 120 140 160 180 Private Debt (As a % of GDP, L) Energy Relative Sector Performance (R) Energy stocks underperformed in both deleveraging episodes. ? Source: ISI Portfolio Strategy.
  • 8. 8 9/26 ISI Group Portfolio Factor Positioning For a Deleveraging Environment Now that we have some understanding of how past periods of deleveraging have panned out for market indices and sectors, we thought we should dive a little deeper into some of the quantitative factors that outperformed during these periods. As we have shown, periods of deleveraging have typically coincided with periods of economic normalization and above-average equity market returns. Accordingly, the factors that have typically outperformed are also those that usually coincide with improving economic prospects. On balance, stocks that are smaller in size, cheaper in valuation and more domestically focused were the strongest. Below we list a handful of factors and the corresponding speculative/defensive end of the spectrum that outperformed. Factors That Have Outperformed In Past Deleveraging Periods Interestingly, in the past few months we have seen some of these same factor performance trends emerge in concert with the ascension of ‘deleveraging’ speak. Ironically, in a lower debt-to-GDP environment, those firms with greater amounts of leverage were the ones to outperform their conservative low-levered counterparts. The chart below illustrates the relative performance of Higher vs. Lower ROE stocks in the S&P 500 during the last deleveraging period. The relative performance trends tracked the ratio of leverage-to-GDP rather closely. If you believe we are entering into a deleveraging period, this chart suggests that a portfolio stocked with high ROE firms would be inconsistent the past performance trends. S&P 500 Factor Chart: Higher vs. Lower ROE 1.10 1.12 1.14 1.16 1.18 1.20 1.22 1.24 1.26 1.28 1.30 1990 1991 1992 1993 1994 1995 1996 1997 1998 0.70 0.75 0.80 0.85 0.90 0.95 1.00 1.05 Private Debt % GDP (L) S&P 500 Relative Performance of ROE: High vs Low (R) Lower ROE equities outperformed during the 1990 deleveraging cycle The past cycle of deleveraging suggest a bias for lower ROE stocks. Source: ISI Portfolio Strategy.
  • 9. 9 9/26 ISI Group Stocks With Factor Profiles Consistent With Outperformance During Past Deleveraging Periods The following screen lists the top five stocks in each sector that possess the factor characteristics of stocks that have historically outperformed during past periods of deleveraging. Although the data show that a preference for Consumer Discretionary and Technology share is suggested, we understand that many investors may be unable to take measureable sector positions. Therefore, we provide the list below to help investors on an intra-sector basis. Email strategy@isigrp.com and your ISI salesperson for a more complete list, or the entire S&P 500 ranked by these factors. Company Foreign Market Debt / Earnings Div LT Price Symbol Company Name Industry Exposure Cap Equity Yield ROE BETA Div Yld Growth 9/24/08 Consumer Discretionary JNY Jones Apparel Group Inc. Apparel Accessories & Luxury Goods 8.5 1,529 39 6 3 2 3 10 18.33 LEN Lennar Corp. (Cl A) Homebuilding 0.0 2,373 75 -68 2 5 9 14.77 AN AutoNation Inc. Automotive Retail 0.0 2,244 42 11 6 2 0 9 12.70 KBH KB Home Homebuilding 1,575 170 -68 2 5 9 20.32 MDP Meredith Corp. Publishing 0.0 1,272 52 11 17 1 3 27.98 Consumer Staples SVU SUPERVALU Inc. Food Retail 0.0 4,825 138 13 10 2 3 8 22.76 CCE Coca-Cola Enterprises Inc. Soft Drinks 29.8 8,191 285 8 1 2 6 16.79 SLE Sara Lee Corp. Packaged Foods & Meats 46.2 9,147 83 8 1 3 7 12.95 PBG Pepsi Bottling Group Inc. Soft Drinks 32.3 6,508 141 8 21 1 2 9 30.41 WFMI Whole Foods Market Inc. Food Retail 0.0 2,729 56 6 10 1 0 16 19.45 Energy TSO Tesoro Corp. Oil & Gas Refining & Marketing 0.0 2,588 60 -4 2 2 10 18.78 VLO Valero Energy Corp. Oil & Gas Refining & Marketing 13.8 17,851 34 12 13 1 2 1 34.00 SUN Sunoco Inc. Oil & Gas Refining & Marketing 4,525 71 5 9 1 3 11 38.72 MRO Marathon Oil Corp. Integrated Oil & Gas 8.8 28,563 35 10 16 1 2 8 40.23 MEE Massey Energy Co. Coal & Consumable Fuels 0.0 3,313 147 2 1 0 50 41.02 Financials HBAN Huntington Bancshares Inc. Regional Banks 0.0 3,406 130 17 2 1 7 5 9.30 GGP General Growth Properties Inc. Retail REITs 0.0 4,240 2 3 2 8 7 15.84 CMA Comerica Inc. Diversified Banks 5,269 253 11 9 1 9 6 35.02 AIV Apartment Investment & Management Co. Residential REITs 0.0 2,884 854 -4 1 7 6 32.99 DDR Developers Diversified Realty Corp. Retail REITs 0.0 3,744 244 3 5 1 8 6 31.18 Health Care CVH Coventry Health Care Inc. Managed Health Care 0.0 5,078 44 11 17 1 0 12 33.48 KG King Pharmaceuticals Inc. Pharmaceuticals 0.0 2,369 15 15 5 0 0 9.61 WLP WellPoint Inc. Managed Health Care 0.0 23,370 46 10 13 1 0 12 45.64 THC Tenet Healthcare Corp. Health Care Facilities 2,864 -1 0 0 11 6.01 UNH UnitedHealth Group Inc. Managed Health Care 0.0 30,371 58 11 19 1 0 12 25.10 Industrials AW Allied Waste Industries Inc. Environmental & Facilities Services 0.0 4,848 150 6 9 2 0 11 11.19 RRD R.R. Donnelley & Sons Co. Commercial Printing 23.3 5,267 78 11 5 1 4 15 24.88 CTAS Cintas Corp. Diversified Support Services 0.0 4,328 41 7 14 1 1 11 28.33 MAS Masco Corp. Building Products 21.2 6,324 100 6 4 1 5 13 17.97 TXT Textron Inc. Industrial Conglomerates 39.2 8,090 176 10 26 2 2 12 32.55 Information Technology UIS Unisys Corp. IT Consulting & Other Services 57.0 1,111 272 -1 2 0 9 3.09 CIEN Ciena Corp. Communications Equipment 16.1 985 79 6 9 2 0 16 10.91 CVG Convergys Corp. Data Processing & Outsourced Services 13.9 1,813 18 9 11 1 0 13 14.88 FIS Fidelity National Information Services Inc. Data Processing & Outsourced Services 3,693 106 9 12 1 1 13 19.48 JAVA Sun Microsystems Inc. Computer Hardware 59.3 5,881 23 8 7 2 0 8 7.82 Materials NUE Nucor Corp. Steel 0.0 14,303 38 11 23 2 4 5 45.18 IP International Paper Co. Paper Products 21.9 11,836 94 8 10 1 4 6 27.68 MWV MeadWestvaco Corp. Paper Products 30.9 4,299 62 8 8 1 3 11 25.17 WY Weyerhaeuser Co. Forest Products 19.1 12,867 92 -4 1 4 6 60.90 EMN Eastman Chemical Co. Diversified Chemicals 42.0 4,414 72 9 17 1 3 6 57.84 Telecommunication Services Q Qwest Communications International Inc. Integrated Telecommunication Services 6,002 2,658 15 534 2 8 3 3.44 EQ Embarq Corp. Integrated Telecommunication Services 0.0 6,065 6,616 11 818 1 6 2 42.06 Utilities PNW Pinnacle West Capital Corp. Electric Utilities 0.0 3,534 82 8 8 1 6 4 35.09 NI NiSource Inc. Multi-Utilities 0.0 4,108 126 8 6 0 6 4 14.98 AEE Ameren Corp. Multi-Utilities 0.0 8,314 90 8 10 1 6 4 39.57 CMS CMS Energy Corp. Multi-Utilities 0.0 2,841 250 4 5 1 3 3 12.60 DTE DTE Energy Co. Multi-Utilities 0.0 6,659 123 6 8 1 5 5 40.83