1. Neutral: National Presto Industries (NPK) – Kevin Sami
Company Description:
Company: National Presto Key Financials 2006 2007 2008 2009
Ticker: NPK Revenue $305 $421 $448 $478
Price: $105.08 Revenue Growth 65.1% 38.3% 6.4% 6.7%
Market Cap: $721M EBITDA $ 43.9 $ 62.4 $ 72.1 $ 100.1
EV: $580M EV/EBITDA 13.2x 9.3x 8.1x 5.8x
Net Debt: ($141)M UFCF $ (20.4) $ 21.2 $ 27.1 $ 56.1
Dividend Yield: 7.8% UFCF Yield nm 3.6% 4.7% 9.7%
Shares OS: 6.9M GAAP EPS $ 4.09 $ 5.65 $ 6.45 $ 9.13
Insider Own: 30.1% P/E 25.7x 18.6x 16.3x 11.5x
National Presto Industries, Inc. (“Presto”) consists of three diverse business segments: (1) the Housewares segment (~ 31% sales) designs, markets
and distributes small electrical appliances; (2) the Defense Products segment (~53% sales) manufactures ammunition systems, fuzes and firing
devices; and (3) the Absorbent Products segment (~ 16% sales) manufactures and sells private label adult incontinent products and diapers.
Thesis Summary: Presto is undergoing a substantial operational restructuring that will lead to higher long-term ROIC and earnings growth. The
market is under appreciating this transformation due to:
a long history as a slow growing, cyclical, housewares company
the uncertainty surrounding the sustainability of its defense segment given the bulk of revenues are derived from a 5-year government
contract
the drag on earnings previously caused by operational inefficiencies within its absorbent products segment
the company is a small-cap conglomerate
no analyst coverage, no investor relations department, and no investor conference calls
Also, without adjusting for excess cash and securities (5-yr avg. % of total assets = 44%), the company’s profitability metrics appear much worse
than they really are. For example, stripping out interest income, the 4-year average GAAP ROE is 12.8% versus 23.8% when adjusted.
Valuation Briefing: At $105/share you are paying 10x trailing UFCF, and 5.3x trailing EBITDA on a consolidated basis. Using a sum-of-parts
methodology, I value NPK at $112/share, based on conservative estimates of each segment plus $20.50/share in net cash. My valuation is based on
a normalized UFCF multiple of 17x for the housewares segment, 10x the absorbent sector, and a partial run-off DCF for the defense segment.
Keeping the applied conservatism in mind, I would be willing to pay $90/share, a 20% discount to intrinsic value. That entry price is in part a bet
that in addition to the underlying value of operations, management continues to patiently and intelligently deploy excess capital. Presto’s intrinsic
value should become clearer in the short-term, during which time I am comfortable earning a 7.8% dividend yield with limited downside.
Housewares: Admittedly, the commodity-like nature of the housewares industry makes this a bad business – companies are likely to suffer from
lower future returns as rising wages in low-cost countries squeeze margins while frugal consumers keep a cap on prices. However, Presto has been
in this business since 1905, with decades of successful product introductions, from pressure cookers, to corn poppers, deep fryers, and pizza ovens.
This segment is clearly the most sensitive to economic conditions, but has held up well in the downturn due to an eating-at-home consumer trend,
a low price point, and low commodity prices.
Industry: Competition in this segment is highly fragmented amongst small private and public companies. The small appliance industry is fiercely
competitive, with few barriers to entry. Firms compete mostly on product features, pricing, advertising, and warranty/service policies. While this
segment has been the namesake of Presto, management has no delusions regarding the quality of this industry, and has intentionally diversified
away from it.
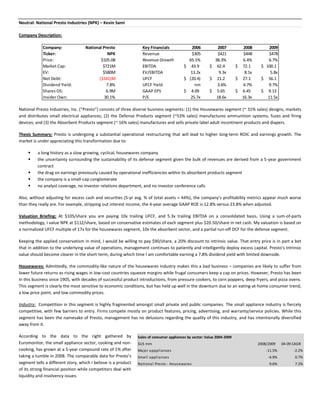
According to the data to the right gathered by Sales of consumer appliances by sector: Value 2004-2009
Euromonitor, the small appliance sector, cooking and non- $US mm 2008/2009 04-09 CAGR
cooking, has grown at a 5-year compound rate of 1% after Major apppliances -11.5% -2.2%
taking a tumble in 2008. The comparable data for Presto’s Small appliances -4.9% 0.7%
segment tells a different story, which I believe is a product National Pres to - Hous ewares 9.6% 7.2%
of its strong financial position while competitors deal with
liquidity and insolvency issues.
2. Jarden (brands Rival and Sunbeam are represented below) and Hamilton Beach are Presto’s most relevant competitors based on product
similarities and price points:
Presto appears to be a stronger brand in the eyes of consumers when compared to these two close comparables. This should explain, in part,
Presto’s ability to raise prices during the recent recession – segment prices increased approximately 4% in 2008 (against -2.8% for the small
appliance sector) and 2.2% in 2009.
Results: Presto has been able to increase operating margins significantly over the
past decade by outsourcing manufacturing to China, while also closing inefficient
domestic operations. The graph to the right illustrates the improvement in margins
resultant of outsourcing and cost cutting measures. The graphs are adjusted for one
time charges associated with plant closings and pension termination charges – they
have not been adjusted for LIFO except for erasing the benefits of LIFO liquidations.
For comparison, I looked at the operating margins of Presto against
Adjusted Pretax Operating Margins
Hamilton Beach (a segment of Nacco Inc.), and Jarden’s Consumer
Solutions segment. The margins to the right have been adjusted for one- 2007 2008 2009
time charges, such as goodwill impairment and restructuring charges Jarden 13.1% 12.5% 13.7%
(both Jarden and HBB had significant impairment charges in recent
years), and to FIFO COGS for comparative purposes:
Hamilton Beach 7.9% 3.8% 10.1%
Presto 16.2% 16.7% 18.8%
Since 2001, total assets for this segment look flat because Presto includes cash Adjusted Pretax Operating ROA
40.0%
and marketable securities in houseware’s assets. Adjusting for excess
35.0%
cash/securities by assuming required cash of 2% of segment sales, and applying
30.0%
the adjusted operating margins previously discussed, the previous 5-year adjusted
25.0%
operating return on assets for this segment is shown to the right:
20.0%
15.0%
10.0%
5.0%
0.0%
2005 2006 2007 2008 2009
These are returns in excess of what you would expect a commodity-like business to earn. The housewares industry has been beleaguered for many
years, justifying Presto’s attempt to diversify into non-cyclical industries. However, this segment has increased sales through the recession and is
posting decent margins with a reasonable return on assets.
3. (millions)
Valuation: To arrive at normalized EBIT, I look at margins over the past five Low Base High
years that reflect both high and low input costs as well as a deep recession. Gross Margin 22.2% 24.9% 27.7%
I’ve adjusted these margins downward for any benefit of LIFO accounting GP-OP % of sales 8.8% 7.7% 6.7%
(essentially erasing significant benefits from decreased input prices) – for Implied EBIT $ 20.1 $ 25.8 $ 31.4
these reasons I believe using the midpoints of these ranges is very
conservative. Based on 2009 segment sales, I assume the normalized EBIT EBIT Margin 15.1% 17.0% 18.8%
to the right: Implied EBIT $ 22.7 $ 25.4 $ 28.2
I perform an earnings power valuation with the following assumptions: (millions)
Low Base High
FY2009 Normalized UFCF $ 13.0 $ 16.6 $ 18.4
17% normalized EBIT margin derived above Normalized EBIT $ 25.4 Multiple 17.0x 17.0x 17.0x
2009 D&A/Capex, slightly more conservative than 5-year Tax rate 34% Housewares Value $ 220.8 $ 281.4 $ 312.5
average NOPAT 16.9 Value/Share $ 32.24 $ 41.08 $ 45.63
D&A 0.9
2009 effective tax rate of 34%
Capex (1.2)
17x UFCF multiple, given consistently high returns on assets Normalized UFCF $ 16.6
and strong niche position
Looking at comparable public companies, I’ve assumed the segment’s four-year EBITDA and earnings growth rates and applied average forward
multiples. This gives a valuation range of about $30 - $42; it should be noted that Presto has performed materially better than all three comps
below on both margins and returns on assets. Presto has also grown steadily, and should be able to capitalize from its strong financial position.
Comparable Valuation Table
MC TEV EV/EBITDA Price/Earnings
TTM 2010E 2011E TTM 2010E 2011E
JAH $ 2,680 $ 4,710 9.3x 6.8x 6.3x 13.3x 10.6x 9.1x
LCUT $ 176 $ 273 7.7x 7.1x 6.4x 17.3x 11.5x 11.6x
HELE $ 727 $ 837 7.5x 7.0x 6.4x 9.7x 9.0x 8.2x
Peer Avg 8.2x 7.0x 6.4x 13.5x 10.4x 9.6x
Implied Housewares $ 277 $ 237 $ 216 $ 293 $ 226 $ 210
Implied Value/Share $ 40.40 $ 34.61 $ 31.56 $ 42.72 $ 32.93 $ 30.61
Finally, as a check, Spectrum Brands closed its acquisition of Russell Hobbs, a good comparable to this segment, on 6/16/2010 at just over 7.0x TTM
EBITDA. Applying this multiple to segment TTM EBITDA of $33.3M implies a valuation of approximately $233M (~$34 p/s) for this segment.
Defense: This segment consists of three sub-segments: Amtec Corp., Amron, and Spectra Technologies. As a whole, I believe there are benefits to
this degree of vertical integration; having more control of the supply chain can be very attractive as a government supplier. Each sub-segment
participates in a different area along the ammunition production value chain:
Amtec: supplies tactical and training ammunition, fuzes, firing devices, and initiators
Amron: world’s leader in producing medium caliber cartridge cases (brass, aluminum, steel)
Spectra Technologies: provides full load, assemble, pack services
Industry: The ammunitions industry has gone through a major change since the cold war, shuttering most facilities in response to the fall-off in
th
demand. However, since the September 11 attacks, the U.S. has had to adapt its warfighting capabilities to respond more effectively to the
growing number of peacekeeping operations and nontraditional threats. This shift has created a more constant demand for incumbent producers.
Conversely, new entrants face the following barriers to entry:
significant layout of capital with no guarantee the government will entertain a competitive bid
o both 40mm contracts discussed below were granted based on limited competitive bids
highly uncertain demand with the impending drawdown of troops
deterrents to relying on the government as the sole customer
o customer concentration risk
o fixed price contracting
o major investments in working capital to ensure timely delivery
o potential for scrap inventory loss following rigorous testing
4. Results: The future for this segment isn’t entirely clear, with 60% of segment revenue coming from a 5-year government contract as one of two
suppliers of all of the requirements for the 40mm family of practice and tactical ammunition rounds. The first 5-year contract was awarded on April
29, 2005, split between Amtec and DSE Inc. Presto estimates that total deliveries under this contract will exceed $664M. The contract was renewed
on February 18, 2010, with an initial reward plus add-ons thus far totaling $133M, scheduled for delivery primarily in 2012.
2005 2006 2007 2008 2009
40mm Contra ct Revenue $ - $ 57,000 $ 122,000 $ 144,000 $ 149,000
Other Revenue 36,954 69,849 102,384 94,752 104,789
Tota l Revenue 36,954 126,849 224,384 238,752 253,789
40mm Growth % - - 114% 18% 3%
Other Growth % - 89% 47% -7% 11%
Total Growth % - 243% 77% 6% 6%
Gros s Profi t 9,564 28,762 48,294 50,232 61,866
Gross Profit % 26% 23% 22% 21% 24%
EBIT 5,797 20,262 36,700 43,550 54,823
EBIT % 16% 16% 16% 18% 22%
Valuation: To value this segment, I forecast 40mm contract revenue will match 50% of the budget estimates (since the contract is split between
Presto and DSE). This budget was released in February 2010, and reflects views formed sometime in summer 2009. I believe the reality of the lack
of progress in Afghanistan has become apparent since then, and there will be material additions to these estimates in subsequent budgets. Since
these current estimates are assuming a withdrawal of troops in both Iraq and Afghanistan, I will assume they continue going forward as the
minimum to support training and inventory reserves. I assume there is no growth in other revenue for this segment. Operating margins are fairly
stable for this segment – I apply an 18% EBIT margin to forecasted revenues. Previous EBIT margins as low as 16% were largely due to earnouts
paid to Spectra Technologies (40% of NI up to $6.4M, 20% of NI in excess of $6.4M), through Dec. 31, 2007. I assume working capital remains at
28% of sales, a 3-year average of various defense comps.
k 10% Year
### 2009A 2010E 2011E 2012E 2013E 2014E 2015E 2016E 2017E 2018E 2019E
40mm Contract Revenue $ 149,000 $ 159,104 $ 89,590 $ 134,618 $ 81,100 $ 82,600 $ 83,500 $ 85,000 $ 85,000 $ 85,000 $ 85,000
Other Revenue 104,789 104,789 104,789 104,789 104,789 104,789 104,789 104,789 104,789 104,789 104,789
Total Revenue 253,789 263,893 194,379 239,407 185,889 187,389 188,289 189,789 189,789 189,789 189,789
EBIT Margin 22% 18% 18% 18% 18% 18% 18% 18% 18% 18% 18%
EBIT 54,823 47,501 34,988 43,093 33,460 33,730 33,892 34,162 34,162 34,162 34,162
Tax Rate 34% 34% 34% 34% 34% 34% 34% 34% 34% 34% 34%
After Tax EBIT 36,183 31,350 23,092 28,442 22,084 22,262 22,369 22,547 22,547 22,547 22,547
Depreciation 3,570 - - - - - - - - - -
Capital Expenditures (1,275) - - - - - - - - - -
Investment in WC - (2,829.12) 19,464.06 (12,607.98) 14,985.04 (420.00) (252.00) (420.00) - - -
UFCF $ 38,478 $ 28,521 $ 42,556 $ 15,834 $ 37,069 $ 21,842 $ 22,117 $ 22,127 $ 22,547 $ 22,547 $ 22,547
Discount factor 0.9091 0.8264 0.7513 0.6830 0.6209 0.5645 0.5132 0.4665 0.4241 0.3855
Discounted value per annum $ 25,929 $ 35,170 $ 11,896 $ 25,318 $ 13,562 $ 12,484 $ 11,355 $ 10,518 $ 9,562 $ 8,693
1 2 3 4 5 6 7 8 9 10
Sum of present value of cash flows $ 164,488
Residual Value
Cash flow in year 2019 $ 22,547
Growth rate (g) 0%
Cash flow in year 2020 $ 22,547
Capitalization (k-g) 10%
Value at end of year 2019 $ 225,469
Discount factor at year 2019 0.3855
Present value residual $ 86,928
TEV $ 36.68 $ 251,416
Risks: I believe there will be no reduction in demand for medium caliber ammunition for the foreseeable future. As explained earlier, even in
peacetime, the U.S. standing army is significant, and the transition to a more mobile, lethal force will require continuous training with ammunitions
of this caliber. Below is a breakdown of orders of 40mm ammunitions by the DOD; the large majority is maintained for training purposes:
40mm Procurement breakdown by Value
FY2009A FY2010E FY2011E
% Tra ining 72% 94% 74%
%Comba t 2% 2% 7%
%Both 26% 4% 19%
5. In absolute terms, the value of training ammunitions procured will be reduced in
conflict free times, but I’ve used the DODs procurement estimates, which bake in a
conflict free environment, while it is widely said Afghanistan will be patrolled by U.S.
troops for some time past the July 2011 drawdown deadline. Even in Iraq, where the
planned drawdown to 50,000 “non-combat” troops has been completed, people on the
ground report continuing combat activity.
Relating to general budget tensions, the U.S. government is under tremendous fiscal
pressures. The Secretary of Defense, Robert Gates, is calling for an overhaul of defense
spending. To the right is a graph showing previous budget forecasts against actual costs
specifically for 40mm ammunitions:
You will notice that while the budget for 2010 is projected to significantly drop for this family of ammunitions, previous year forecasts have been
wildly off the mark. There is no doubt that downward pressure on the budget will affect the revenues of this segment, however, escalating conflicts
around the globe seem to be continuous, and critical procurements such as ammunition will not be spared. The government has made it clear that
it is working to reform its acquisition process and reduce government excess, with an eye towards reducing costly major weapons programs that go
over budget and past deadline (hints have been dropped about the Marine Corps Expeditionary Fighting Vehicle, as well as the F-13 Joint Strike
Fighter program, among others). The government is looking to cut out bits of the bureaucracy and inefficiencies, not conventional ammunitions.
Diapers: This segment, Presto Absorbent Products, manufactures private label incontinence products. This includes absorbent briefs, underwear
and underpads. Presto entered the absorbent products industry with the purchase of two diaper machines in 2001, and expanded in 2003 with the
purchase of NCN Hygiene assets. The board has recently approved a $30M expansion for this segment, with approximately $4.5M spent in the
1H2010, as well as an $11M equipment purchase commitment.
Industry: The market for incontinence products is heating up. Incontinence has long been a stigmatized disorder, but it is estimated to affect 5% of
the population globally. With baby boomers aging, thus creating a demographic tailwind, this industry is becoming more competitive. Euromonitor
estimates that Americans over 60 will grow from approximately $57M in 2010 to $88M in 2030 – that’s a compound rate of 2.2% vs. 0.6% for the
entire population. Large consumer products companies are ramping up advertising campaigns directed at adult incontinence. New products are
being developed to appeal to those with light incontinence and an active lifestyle.
According to SCA’s 2009 annual report, the global market share for incontinence care is dominated by the top four in the chart below. They
estimate the U.S. accounts for roughly 30% of the global market. Only Kimberly-Clark and First Quality have significant U.S. operations, while the
other two are beginning to enter the U.S. market.
With the growing U.S. market attracting foreign investment, it will be difficult for Presto to compete. However, there is an important distinction to
be made – Presto sells private label products while the four leaders are all branded. Furthermore, new advertising dollars are focused on capturing
the retail consumer. Presto’s main customer is Medline industries, accounting for approximately 80% of segment sales. Medline is a manufacturer
and distributor of thousands of medical products, focused on offering supply management to hospitals and extended care facilities. This means
that the end-user is different, as well as the purchase decision maker. While the mentioned competitors also own institutional/home care market
share, they all have retail products that require more spend and different design.
Results: Since entering the industry, Presto’s results have been shaky. They were able to turn a small profit in the beginning years, but had trouble
with production efficiencies in years following large expansions. The below segment results include goodwill charges in 2005 and 2006 of $4.1m
and $500k, respectively.
6. Absorbent - Operating
2002 2003 2004 2005 2006 2007 2008 2009
Externa l Sa l es $ 8,407 $ 11,502 $ 28,261 $ 35,624 $ 53,377 $ 65,065 $ 72,661 $ 74,663
Growth % - 37% 146% 26% 50% 22% 12% 3%
Gros s Profi t 431 716 1,550 (2,258) (5,228) (1,597) (315) 7,890
GP % 5% 6% 5% -6% -10% -2% 0% 11%
EBIT (131) 700 1,230 (7,255) (6,673) (2,671) (1,165) 6,234
EBIT % -2% 6% 4% -20% -13% -4% -2% 8%
EBITDA 696 1,747 3,091 (4,242) (1,601) 2,295 3,626 10,477
EBITDA % 8% 15% 11% -12% -3% 4% 5% 14%
Total As s ets 8,053 12,561 44,035 46,486 51,901 47,908 40,263 33,644
Growth % - 56% 251% 6% 12% -8% -16% -16%
D&A 827 1,047 1,861 3,013 5,072 4,966 4,791 4,243
% sales 10% 9% 7% 8% 10% 8% 7% 6%
Ca pex 212 580 22,365 10,893 1,078 487 979 822
% sales 3% 5% 79% 31% 2% 1% 1% 1%
This segment requires intensive capital spending, although capital outlays can be lumpy with the bulk spent on additional machines. As mentioned
in previous annual reports, there are long lead times in procuring and installing these complex machines. Following installation, even more time is
needed to develop the requisite employee skills in operating the machinery efficiently. Given lessons learned in previous expansions, I don’t expect
the newly planned $30M expenditure to impact operating earnings as much as it did in 2005 and 2006.
Valuation: Since this segment has just reached scale and profitability, I looked at margins and returns of competitors to get a reasonable idea of
where Presto will stabilize. With the exception of Hartmann, the below table displays segment results that include baby diapers and feminine care.
For this reason, Hartmann is likely the most comparable:
Pretax Operating Margins Pretax Operating Return on Assets
2007 2008 2009 2007 2008 2009
Hartmann - Incontinence Mgmt 7.8% 4.2% 8.0% Hartmann - Incontinence Mgmt 14.1% 6.9% 14.9%
SCA - Personal Care 13.5% 12.6% 12.7% SCA - Personal Care 21.3% 17.2% 19.2%
Kimberly Clark - Personal Care 20.3% 19.9% 20.8% Kimberly Clark - Personal Care 26.5% 30.1% 29.5%
Unicharm - Personal Care 9.7% 9.4% 11.8% Unicharm - Personal Care 16.4% 14.1% 17.3%
It’s important to keep in mind that the bottom three are branded with a large portion of sales flowing to retail consumers. For this reason, I find it
reasonable to take Hartmann’s metrics and apply them to Presto. It’s worth noting that Presto achieved an 8% operating margin in 2009, and a 13%
margin in the first six months of 2010, so these are realistic assumptions.
Management has offered no guidance on incremental sales/earnings attributable to the
announced $30M expansion of the segment. As a guide, I looked at a similar expansion made in
2004/2005 where the segment allocated approximately $33M in capital expenditures. During this
time period, management repeatedly noted difficulties of a start-up/learning curve nature in
annual reports. The chart to the right illustrates the degree of difficulty:
For each dollar of capex spent in the expansion, $1.22 in sales was added, however it took four years to reach that efficiency. If we assume the new
expansion is completed over two years, then by 2014 this segment should add $36.5M in revenue to the current run rate of roughly $82M.
Assuming a 16% EBITDA margin, I estimate 2014 UFCF of $14.6M:
2005A 2006A 2007A 2008A 2009A 2010E 2011E 2012E 2013E 2014E
Sal es $ 35,624 $ 53,377 $ 65,065 $ 72,661 $ 74,663 $ 82,336 $ 87,286 $ 111,736 $ 113,557 $ 118,836
EBITDA (4,242) (1,601) 2,295 3,626 10,477 13,174 13,966 17,878 18,169 19,014
Capex (22,365) (10,893) (1,078) (487) (979) (15,000) (15,000) (1,117) (1,136) (1,188)
EBITDA - Capex (26,607) (12,494) 1,217 3,139 9,498 (1,826) (1,034) 16,760 17,034 17,825
Taxes - - - - (2,120) (2,240) (2,374) (3,039) (3,089) (3,232)
UFCF (26,607) (12,494) 1,217 3,139 7,378 (4,066) (3,408) 13,721 13,945 14,593
Applying an EPV to 2014 UFCF assuming no growth and 10% cost of capital, and discounting it back 4.5 years results in an approximate value of $14
per share. I believe this is conservative, as it assumes zero growth following the expansion and no flattening of the learning curve.
7. Cost of capital EPV P/S
10% 95,034 $ 13.87
Management: Maryjo Cohen, President, Chairwoman, and CEO, controls 30.1% of the company, equating to approximately $217M in value.
Interestingly, according to a Forbes article released in October 2009, she is notoriously thrifty, still living at home with her mother and yet to
upgrade beyond dial-up internet. Furniture and fixtures at the Presto head-quarters date back to the Eisenhower administration. Her and her
father, Melvin Cohen (former Chairman and CEO), have steadfastly resisted the “institutional imperative,” even after being called out by the NYSSA
in a scathing report published in 1999, in which their rebuttal was equally biting but far more accurate. Below is a summary of the total
compensation of the top five executives – these are the type of managers one should like to invest alongside.
Total Compensation % of Consolidated Sales
Name 2007 2008 2009 2007 2008 2009
Top 5 $ 1,117,597 $ 1,008,911 $ 1,419,555 0.27% 0.23% 0.30%
Valuation Summary:
Cos t of
Ca pi ta l /Mul ti pl e TEV TEV P/S
Hous ewa res EPV(ba s e) 17x $ 281.4 $ 41.08
Defens e DCF 10% $ 251.4 $ 36.68
Abs orbent EPV 10% $ 95.0 $ 13.87
Tota l TEV $ 627.8 $ 91.63
Pl us ca s h, l es s debt $ 140.7 $ 20.51
Equi ty Va l ue $ 768.55 $ 112.14
A conservative sum-of-parts methodology values Presto at approximately $112/share, however, I believe my estimates of intrinsic value for each
segment are reasonably conservative. Any upside to any segment will add incremental intrinsic value. Furthermore, the values above are from a
strict going concern perspective. With 38% of total assets in cash and liquid securities, any value-add asset conversion activities could create
tremendous shareholder value. Presto is paying a large special dividend (currently yielding 7.8%) with the wherewithal to continue its distribution.
This should act as a downside cushion to any unfavorable developments.
8. Consolidated Operating Statement:
2005 2006 2007 2008 2009
Revenue $ 184,565 $ 304,681 $ 421,287 $ 448,253 $ 478,468
Growth - 65.1% 38.3% 6.4% 6.7%
Gros s Profi t 38,281 56,343 76,926 80,240 110,092
Gross Margin % 20.7% 18.5% 18.3% 17.9% 23.0%
EBIT 19,681 36,030 53,960 63,281 91,347
EBIT % 10.7% 11.8% 12.8% 14.1% 19.1%
EBITDA 23,926 43,921 62,445 72,075 100,085
EBITDA % 13.0% 14.4% 14.8% 16.1% 20.9%
Interes t Income 4,345 4,349 4,247 4,270 3,050
EBT 24,026 40,379 58,207 67,551 94,397
Income Ta xes 7,609 12,419 19,584 23,368 31,821
Net Income $ 16,417 $ 27,960 $ 38,623 $ 44,183 $ 62,576
WA Sha res OS 6,827 6,831 6,836 6,845 6,854
Di l uted EPS $ 2.40 $ 4.09 $ 5.65 $ 6.45 $ 9.13
EBIT 19,681 36,030 53,960 63,281 91,347
Ta x Ra te 32% 31% 34% 35% 34%
NOPAT 13,448 24,949 35,805 41,390 60,554
D&A 4,245 7,891 8,485 8,794 8,738
Ca pex (13,832) (7,271) (6,224) (4,370) (3,337)
Chg. WC (3,028) (32,169) (10,161) (18,708) (9,851)
UFCF 833 (6,600) 27,905 27,106 56,104
UFCF/Sha re $ 0.12 $ (0.97) $ 4.08 $ 3.96 $ 8.19
9. Consolidated Balance Sheet:
2005 2006 2007 2008 2009
ASSETS
Ca s h a nd equi va l ents $ 62,023 $ 46,696 $ 26,715 $ 24,692 $ 48,974
Ma rketabl e s ecuri ties 111,552 96,920 116,559 121,217 118,442
Accounts recei va bl e, net 32,284 65,571 87,918 75,594 92,359
Total i nventory 37,679 55,492 65,485 71,720 75,212
Deferred tax a s s et 5,362 7,466 5,694 4,539 6,605
Other current a s s ets 4,325 1,037 1,408 1,754 480
Total current assets 253,225 273,182 303,779 299,516 342,072
PPE, net 50,484 62,559 59,262 54,732 48,848
Goodwi l l 3,556 9,085 11,485 11,485 11,485
Other a s s ets 150 150 150 150 -
Total assets $ 307,415 $ 344,976 $ 374,676 $ 365,883 $ 402,405
LIABILITIES
Accounts pa ya bl e $ 18,084 $ 35,424 $ 40,381 $ 32,325 $ 37,903
Federa l a nd s tate i ncome taxes 8,282 7,029 5,795 4,217 6,291
Accrued l i a bi l i ties 14,138 20,575 30,599 15,347 16,859
Total current liabilities 40,504 63,028 76,775 51,889 61,053
Deferred i ncome taxes 376 1,606 3,290 3,389 5,480
Common s tock 7,441 7,441 7,441 7,441 7,441
Pa i d i n ca pi tal 1,135 1,277 1,496 1,735 2,037
Retai ned ea rni ngs 277,033 290,519 304,246 319,362 343,930
Accumul a ted comprehens i ve i ncome (141) (22) 176 536 643
Trea s ury s tock 18,933 18,873 18,748 18,469 18,179
Total stockholders equity 266,535 280,342 294,611 310,605 335,872
Total stockholders equity and liabilities $ 307,415 $ 344,976 $ 374,676 $ 365,883 $ 402,405
Housewares - Operating
2005 2006 2007 2008 2009
Externa l Sa l es $ 111,987 $ 124,455 $ 131,838 $ 136,840 $ 150,016
Growth % 5.5% 11.1% 5.9% 3.8% 9.6%
Gros s Profi t 30,975 32,809 30,229 30,323 40,336
GP % 27.7% 26.4% 22.9% 22.2% 26.9%
EBIT 21,139 22,441 19,931 20,896 30,290
EBIT % 18.9% 18.0% 15.1% 15.3% 20.2%
EBITDA 22,066 23,253 20,721 21,688 31,215
EBITDA % 19.7% 18.7% 15.7% 15.8% 20.8%
Total As s ets 232,458 213,032 223,115 218,783 260,854
D&A 927 812 790 792 925
% sales 1.8% 1.3% 1.3% 1.4% 1.9%
Ca pex 802 1,314 916 788 1,240
% sales 0.7% 1.1% 0.7% 0.6% 0.8%
10. Defense - Operating
2005 2006 2007 2008 2009
Externa l Sa l es $ 36,954 $ 126,849 $ 224,384 $ 238,752 $ 253,789
Growth - 243.3% 76.9% 6.4% 6.3%
Gros s Profi t 9,564 28,762 48,294 50,232 61,866
GP % 25.9% 22.7% 21.5% 21.0% 24.4%
EBIT 5,797 20,262 36,700 43,550 54,823
EBIT % 15.7% 16.0% 16.4% 18.2% 21.6%
EBITDA 6,102 22,269 39,429 46,761 58,393
EBITDA % 16.5% 17.6% 17.6% 19.6% 23.0%
Total As s ets 28,471 80,043 103,653 106,837 107,907
Growth % - 181.1% 29.5% 3.1% 1.0%
D&A 305 2,007 2,729 3,211 3,570
% sales 0.6% 3.2% 4.6% 5.9% 7.3%
Ca pex 2,137 18,627 4,821 2,603 1,275
% sales 5.8% 14.7% 2.1% 1.1% 0.5%
Absorbent - Operating
2005 2006 2007 2008 2009
Externa l Sa l es $ 35,624 $ 53,377 $ 65,065 $ 72,661 $ 74,663
Growth % 26% 50% 22% 12% 3%
Gros s Profi t (2,258) (5,228) (1,597) (315) 7,890
GP % -6% -10% -2% 0% 11%
EBIT (7,255) (6,673) (2,671) (1,165) 6,234
EBIT % -20% -13% -4% -2% 8%
EBITDA (4,242) (1,601) 2,295 3,626 10,477
EBITDA % -12% -3% 4% 5% 14%
Total As s ets 46,486 51,901 47,908 40,263 33,644
Growth % 6% 12% -8% -16% -16%
D&A 3,013 5,072 4,966 4,791 4,243
% sales 8% 10% 8% 7% 6%
Ca pex 10,893 1,078 487 979 822
% sales 31% 2% 1% 1% 1%