SlideShare a Scribd company logo
1 of 10
1
It’s Your Money: Todays Technology Lets You Take It When You Need It
James R. Barth & Edwin A. Helm1
At one time or another, no matter our age, address, or income level, we all want or need to
borrow funds to purchase goods or services. At year’s end 2015 in the United States alone, some
321 million people, comprising 126 million households, had outstanding debt of $12 trillion.2
The purpose of the loans varied widely, from cell phone purchases to cars, college tuition, and
homes. But access to credit doesn’t just enable us to buy more goods and services; it contributes
to job creation and economic growth. In short, active and well-functioning loan markets promote
social welfare.
Stringency of Loan Terms Hits LowerIncome Groups Hardest
But all loans are not created equal. They differ in terms of interest rates, loan amounts, and terms
to maturity. The specific mix of these factors depends in large part on the creditworthiness of the
borrower. More creditworthy individuals typically can borrow more funds for longer periods,
and at lower interest rates. Understandably, a key factor in determining an individual’s
creditworthiness is income. And not surprisingly, individuals in lower income brackets are
subject to more stringent lending terms than those in the higher income brackets.
There’s also a substantial difference in income distribution across households. Of those 126
million households holding loans last year, 22 percent earned less than $25,000; 23 percent
earned more than $25,000 but less than $50,000; 29 percent earned more than $50,000 but less
than $100,000; and 26 percent earned more than $100,000.3 Again, individuals in the lower
income brackets will have to accept the most stringent lending terms.
For these households, in particular, but for all households, of course, efficient and expeditious
access to credit is a great advantage, and at times a life-saver. Even better, however, would be
access to their own earned income, which could reduce or remove the need to take out a loan at
all, especially a short-term loan with its attendant high fees. New financial technologies are
1. James R. Barth is Lowder Eminent Scholar in Finance at Auburn University, Senior Finance Fellow at
the Milken Institute, Fellow of the Wharton Financial Institutions Center,and Advisor to FlexWage and
Edwin A. Helm is CEO of Acumen Capital Group and an investor in FlexWage.
2. See US Census Bureau population estimates (National Characteristics:Vintage 2015) at
www.census.gov/popest/data/national/asrh/2015/index.html; See US Census Bureau, “Income and
Poverty in the United States:2015” at http://www.census.gov/data/tables/2016/demo/income-
poverty/p60-256.html (Table 1); and see FederalReserve Bank of New York, “Quarterly Report on
Household Debt and Credit” (February 2016) at
https://www.newyorkfed.org/medialibrary/interactives/householdcredit/data/pdf/HHDC_2015Q4.pdf.
3. See US Census Bureau,“Income and Poverty in the United States: 2015” at
http://www.census.gov/data/tables/2016/demo/income-poverty/p60-256.html (Table A-1).
2
making this possible. Employees can now access their earned income more frequently than the
typical two-week pay cycles now in use.
People Borrow for Different Reason
We borrow money for many different reasons. The more common loans—for college tuition or
for a car or home—are those we anticipate and tend to plan for, generally by saving and setting
aside funds to lessen the loan amount. It’s the unexpected expenses like auto repairs, broken
appliances, emergency medical attention that can catch people off guard, with insufficient
savings to cover them. Indeed, over the past twelve months, only 56.3 percent of US households
have saved for unexpected expenses or emergencies.4
Again, immediate access to one’s earned income would ease some of the financial stress these
emergencies trigger. Unfortunately, too many employees must turn elsewhere, to more expensive
funding sources. According to the Federal Reserves “Report on the Economic Well-Being of US
Households in 2015,” “Forty-six percent of adults say they either could not cover an emergency
expense costing $400, or would cover it by selling something or borrowing money.”5 They likely
know already that being cash-poor in an emergency is the surest indicator (and inducer) of
financial stress—and their need to access funds without delay is no less crucial than the
imperative of maintaining a paycheck to cover the new expenses.
Factors Affecting Financial Wellness
Close to 76 million adults are struggling financially, according to the report from the Federal
Reserve,6 and a significant number of those reported they were actually worse off than they’d
been the year before. Overall, individual financial well-being differs significantly, depending on
family income, race/ethnicity, education, and marital and parental status. Individuals who find it
more difficult to get by have lower family incomes, are black (non-Hispanic) or Hispanic, hold a
high school degree or less, and are unmarried have children under 18.
Table 1 provides information on the overall financial well-being of individuals, based upon
various criteria. Clearly, not everybody is living comfortably. Yet everyone seems to be
concerned about their financial health. As would be expected, higher-income individuals are
better able to focus on their long-run financial health, whereas those lower in the income
distribution are less able to focus on these concerns while they struggle to meet pressing short-
term financial obligations. When people live paycheck to paycheck, they are living with
uncertainty. Auto or home repairs, a medical or dental crisis—any of these can push the person
who is just getting by right off the financial cliff.
4. See 2015 FDIC, “National Survey of Unbanked and Underbanked Households” at
www.fdic.gov/householdsurvey/2015/2015report.pdf.
5. See Federal Reserve,“Report on the Economic Well-Being of US Households in 2015.”
6. Ibid.
3
Table 1. Overall individual financial well-being (percentage/characteristics)
Characteristic Finding it
difficult to
get by
Just getting
by
Doing okay Living
comfortably
Family income
Less than $40,000 17.7 31.6 38.5 12.1
$40,000–$100,000 4.4 19.4 47.3 28.8
Greater than $100,000 1.8 7.9 36.6 53.7
Race/ethnicity
White, non-Hispanic 8.5 20.3 40.7 30.3
Black, non-Hispanic 10.3 28.3 40.9 20.4
Hispanic 12.3 24.7 42.6 20.5
Education
High school degree or less 12.9 25.9 41.2 19.8
Some college or associate degree 8.9 25.1 42.1 23.9
Bachelor’s degree or more 5.7 13.8 39.5 40.9
Marital and parental status
Unmarried, no children under 18 12.1 25 41.7 21
Married, no children under 18 5.6 15.3 42.5 36.7
Unmarried, children under 18 18.7 34.3 33.7 13.3
Married, children under 18 6.9 22.2 39.9 31
Overall 9.4 22 41 27.6
Source: FederalReserve, “Report on the Economic Well-Being of US Households in 2015.”
Of note, the report examines whether variation in monthly income or expenses affects the ability
of individuals to pay their bills. It was found that:
Overall, 42 percent of those with volatile incomes or expenses report that they struggled
to pay their bills at least once in the last year due to this kind of volatility. The potential
for hardship from volatile incomes and expenses appears to be greatest among lower-
income respondents and among credit-constrained respondents. Among those with
volatile incomes or expenses whose family income is under $40,000 per year, 54 percent
report that they struggled to pay their bills due to this volatility. Among lower-income
respondents who are not confident that they would be approved for a credit card if they
were to apply for one, an even higher 72 percent report that they struggled to pay their
bills due to income or expense fluctuations.
4
Sources ofFunds for EmergencyNeeds
As we have seen, close to 76 million adults are struggling financially. When such individuals
borrow, particularly to cover emergency costs, they currently turn to a number of sources, the
most expensive of which include overdrafts, payday loans, pawn shop loans, and title loans. The
size of the market for these particular sources of funds in very rough terms involves more than
60 million Americans, obtaining more $50 billion in loans, and paying more than $40 billion in
fees. The next paragraphs address in some detail the extent to which individuals rely upon and
the costs associated with of each of these sources of funds.
Bank Overdrafts
In 2015, US bank customers paid overdraft fees totaling $32.5 billion, with an average overdraft
fee of $35. Within the past year, 18 percent of Americans overdrew their bank accounts; and of
these individuals, 64 percent earned less than $30,000 per year.7 Of “heavy” overdrafters, i.e.,
those who incur over $100 in overdraft and insufficient funds fees (or roughly three $35 fees per
year), 70 percent are employed; these people would benefit greatly if they had access to their
earned income before payday.8 Table 2 shows the extent to which individuals of all different
ages overdraw their accounts.
Table 2. Distribution of accounts and overdraft fees (percent/frequency, age)
18–25 26–45 46–61 62 and over
Annualized
number of
overdrafts
Accounts
Percent
Overdraft
fees
Percent
Accounts
Percent
Overdraft
fees
Percent
Accounts
Percent
Overdraft
fees
Percent
Accounts
Percent
Overdraft
fees
Percent
None 61.5 0.0 64.1 0.0 72.4 0.0 84.6 0.0
1−3 14.7 9.6 13.7 7.2 12.4 8.8 8.4 13.3
4−10 13.1 21.9 11.0 16.0 8.2 17.6 4.2 21.5
10-plus 10.7 68.4 11.1 76.8 7.0 73.5 2.8 65.2
Source: Consumer Finance Protection Bureau, “Data Point: Checking Account Overdraft.”
Table 3 offers more detailed information about overdrafters. As shown, every category of
individual commits overdrafts—renters and homeowners, single and married, male and female,
less and more educated, and all demographic groups. Also notice that overdrafts occur among
individuals at all levels of income. This particular issue is not simply one that arises among only
lower-income individuals. It is employed persons, moreover, that account for the category with
the highest percentage of overdrafters. This percentage even exceeds the percentage of the
population that is employed, 68 versus 59 percent. Lastly, overdrafters are found throughout the
country, though there is clearly some differences in the extent across regions.
7. See www.statisticbrain.com/total-overdraft-fees/.
8. See Pew Charitable Trusts www.pewtrusts.org/en/research-and-analysis/fact-sheets/2016/04/heavy-
overdrafters.
5
Table 3. Overdrafters vs. US population, by demographic characteristic
Percent
Overdrafters
Percent
US Population
Renters 54 36
Homeowners 44 62
Single 44 32
Married 39 49
Employed 68 59
Income under $25,000 32 25
$25,000 to under $40,000 22 16
$40,000 to under $75,000 23 21
$75,000 to $100,000+ 14 23
White (non-Hispanic) 51 65
African-American (non-Hispanic) 18 11
Hispanic 19 13
Ages 18–29 31 21
Ages 30–49 42 33
Ages 50–64 18 24
Ages 65+ 5 17
Less than high school 13 13
High school 30 30
Some college 34 26
College 13 19
Male 48 49
Female 52 51
Northeast 20 18
South 37 37
North-Central 19 21
West 23 23
Source: 2014 Pew Charitable Trusts, “Overdrawn: Persistent Confusion and Concern about Bank
Overdraft Practices.”
Payday Loans
Payday loan stores provide small-dollar, short-term loans from an estimated 20,600 locations
across the country. They extend nearly $40 billion in short-term credit to 19 million households
that experience cash-flow shortfalls.9
The borrower of a payday loan must have a checking account and proof of income. The average
payday loan requires a lump-sum repayment of $430 on the next payday, consuming 36 percent
of an average borrower’s gross paycheck.
9. See Community Financial Services Association at http://cfsaa.com/about-the-payday-advance-
industry.aspx.
6
According to the Pew Charitable Trusts, the average payday loan borrower is in debt five months
of the year and spends an average of $520 in fees annually to repeatedly borrow $375. The
average fee at a storefront loan business is $55 per two-week period. Average borrowers earn
about $30,000 per year, and 58 percent have trouble meeting their monthly expenses. The
average annual percentage rate for a payday loan is 391 percent.10
Payday lenders have come under scrutiny in recent years amid accusations that some of them
engage in predatory and abusive practices, and lure their targets, often single women and
minorities, into harmful debt traps. “When emergencies arise, people need access to credit,” said
Massachusetts Sen. Elizabeth Warren this past April, “but payday lenders that build business
models around trapping people in a never-ending cycle of debt are throwing bricks to a drowning
man.”
The payday loan industry has expanded to online “stores” in recent years. Some payday lenders
operate both stores and online, but others are online only. The payday lenders operating through
storefronts still account for the majority of the payday lender industry. There are some
differences between storefront loans and online loans, however. Two major differences are that
(1) storefront loans are secured by postdated checks or authorization to debit the borrowers’ bank
accounts, whereas online loans primarily use electronic access to borrowers’ bank accounts and
(2) the fees for online payday loans are generally higher than those for storefront loans.11
Figure 1 provides information on the number of online payday overdrafts and nonsufficient
funds transactions per account. Accounts that have at least one online payday loan payment
request resulting in an overdraft or insufficient funds are charged on average $185 in fees by the
linked bank on attempted payment requests from online lenders.
Figure 1. Number of online payday overdraft
and nonsufficient funds transactions per account
Source: Consumer Financial Protection Bureau Report: “Online Payday Loan Payments.”
10. See Pew Charitable Trusts, “Payday Loan Facts and the CFPB’s Impact” (2016) at
http://www.pewtrusts.org/~/media/assets/2016/06/payday_loan_facts_and_the_cfpbs_impact.pdf.
11. See Pew Charitable Trusts, “Fraud and Abuse Online: Harmful Practices in Internet Payday Lending”
(2014) at http://www.pewtrusts.org/~/media/assets/2014/10/payday-lending-
report/fraud_and_abuse_online_harmful_practices_in_internet_payday_lending.pdf.
7
Pawn Shop Loans
More than 30 million people use pawn shop lending services, with the average loan totaling
$150. However, loans can be made for any amount, depending on the value of the pawned item.
The Texas-based Cash America (which was acquired in September 2016 by First Cash Financial
Services) disclosed in its 2014 annual report that it owned 84 check cashing centers and 859
lending locations across the country and had made over $1 billion in pawn loans per year. The
company noted that 30 percent of borrowers never return to redeem the items they pawned and
sales of those items made up over half the company revenues.12 The National Pawnbrokers
Association reports that interest rates for 30-day loans are usually less than bank overdraft fees,
and that “for years, pawn stores have been providing safety net loans to families that encounter
sudden financial emergencies.”13
Title Loans
Auto title loans are similar to payday loans, except that the average loan is $1,000 and is secured
by a borrower’s car title. Roughly 2.5 million Americans spend $3 billion on auto title loan fees
each year.14 The typical annual percentage rate charged is 300 percent. More than 8,000 title loan
stores operate in the US.15
Unbanked and Underbanked Households
Approximately 9.0 million US households, comprising 15.6 million adults and 7.6 million
children, were unbanked in 2015. These are households in which no one has a checking or
savings account. Underbanked households hold a bank account but turn to alternative sources for
financial services and products. Some 24.5 million US households, comprising 51.1 million
adults and 16.3 million children, were underbanked in 2015. “Specifically, a household is
categorized as underbanked,” notes the FDIC, “if it had a checking or savings account and used
one of the following products or services from an alternative financial services (AFS) provider in
the past twelve months: money orders, check cashing, international remittances, payday loans,
refund anticipation loans, rent-to-own service, pawn shop loans, or auto title loans.”16
12. “Reverse Robin Hood: $6 Billion Businesses Preying on Poor People” at
http://truth-out.org/buzzflash/commentary/reverse-robin-hood-six-billion-dollar-businesses-preying-on-
poor-people.
13. National Pawnbrokers Association, www.nationalpawnbrokers.org/2012/6-things-everyone-should-
know-before-going-to-a-pawn-shop/.
14. See Pew Charitable Trusts, “Payday Loan Facts and the CFPB’s Impact.”
15. See Pew Charitable Trusts, “Auto Title Loans: Market Practices and Borrowers’ Experiences” at
www.pewtrusts.org/~/media/assets/2015/03/autotitleloansreport.pdf?la=en.
16. See FDIC “National Survey of Unbanked and Underbanked Households” (2015) at
www.fdic.gov/householdsurvey/2015/2015report.pdf.
8
Additional Problems with High-Cost Loans
We’re a nation of borrowers, and financial stress has carried over into the workplace, according
to studies. Stressed workers affect businesses through lost productivity, absenteeism, accidents,
and health issues. The observed reduction in productivity is the equivalent of about twenty hours
on average per month per employee. “Stressed employees spend time during work hours on the
phone dealing with creditors; working on debt consolidation; worrying about bouncing checks;
worrying about having enough money to pay their monthly utility bills, mortgage and medical
expenses; college tuition and more,” notes one summary of the effects of financial street put out
by Wellness Indiana, a nonprofit owned by the Indiana Chamber of Commerce. There are also
more workplace accidents when employees are stressed; between 60 percent and 80 percent of
workplace accidents occur because of distractions attributable to stress.17
One out of every four US employees reports serious financial stress, according to an article that
the Missouri-based Pension Consultants posts on its home page; and employee financial stress
hurts the bottom line. The following pie chart offers a snapshot of just some of the costs
companies face that are associated with financially stressed employees.18
Figure 2. Costs per Stressed Employee
Source: Pension Consultants Inc.
17. “Employee Financial Stress Is Costing Your Company a Bundle—And How You Can Stop It Now!”
2012. www.wellnessindiana.org/wp-content/uploads/2012/07/Employee-Financial-Stress-is-Costing-
Your-Company-a-Bundle.pdf.
18. “The Impact of Financial Stress on Workforce Productivity,” February 27, 2014.
http://pension-consultants.com/the-impact-of-financial-stress-on-workforce-productivity/.
$3,600
$7,000
$29,000
$3,500
Absenteeism
Lost Productivity
Workplace Accidents
Turnover
9
What Can Be Done to Reduce the Reliance on High-CostFunds?
In June, the Consumer Financial Protection Bureau (CFPB) proposed new rules that would
eliminate about 80 percent of payday loans. If the new rules are instituted, millions of workers
will have fewer ways to obtain fast cash for urgent needs, resulting in increased workplace stress
that costs firms in terms of lost productivity, absenteeism, low retention, and employee
satisfaction.
But access to funds for emergency purposes need no longer mean dependence on high-cost
credit. As noted earlier, technological innovation is allowing people to access their own earned
income “banked” by their employer for days already worked. An employee typically receives
pay on either a weekly and biweekly schedule; but wages accrue hourly or daily. Now an
employee can access his or her earned income before the actual pay period ends.
A firm that provides this service is New Jersey-based financial services company FlexWage
(www.flexwage.com ). Since its founding in 2010, FlexWage has partnered with more than 150
firms, cities, and municipalities in twenty-six states that use its technology to allow employees to
make early withdrawals of unpaid wages via electronic routing of payroll funds directly to
proprietary “prepaid” (Visa and MasterCard debit cards) cards.
The typical charge for early payroll access, is $3−$5; the amount accessible is typically up to 75
percent of the accrued net wages, though an employer can adjust the figures. Indeed, companies
can create their own policies regarding the percentage of wages that can be accessed and how
frequently employees can withdraw funds. Because the employee isn’t borrowing funds, there’s
no repayment and no interest. Moreover, this source of funds avoids giving out your information
to, for example, an online payday lender. This is important because simply entering information
on such a site may come back to haunt an individual.19
FlexWage also enables its partners to convert their entire systems to electronic payroll and
payroll cards, thus cutting employer costs associated with printing and mailing paper checks, and
employee costs for check cashing, money order, and bank fees. Furthermore, the program,
WageBank (www.wagebank.com) , is easy to implement, with just four steps:
1. Employers provide the governing policies, pay schedules, and funding methods,
including, more specifically, the percentage of accrued wages available for transfer, the
number of WageBank transfers per pay period, number of WageBank transfers per
month, and number of WageBank transfers per year.
2. Employers provide employee payroll and time/labor data.
3. FlexWage provides training and communications materials.
4. The program is rolled out to employees.
19. Federal Trade Commission, “Online Payday Loans” (February 2013) at
https://www.consumer.ftc.gov/articles/0249-online-payday-loans.
10
Near the end of each pay period, the FlexWage application will close access to WageBank for
that pay period and provide reporting to the employer for all WageBank transaction activity.
Transaction activity is uploaded into the payroll system similar to a benefit file, and deducted
from the employee’s pay as an after-tax benefit line item. The WageBank transaction fee is also
deducted as a separate line item.
The bottom line is this: Employers providing a service to their employees like the one offered by
FlexWage will discover a happier, healthier, more productive and more loyal workforce—a win
for both, and an overall improvement in the financial well-being of workers who would
otherwise be paying more in high fees, interest, or penalties.

More Related Content

What's hot

Retirement Derailers Research Report
Retirement Derailers Research ReportRetirement Derailers Research Report
Retirement Derailers Research ReportBrendan K. Maginnis
 
National Debt and How to Deal With It
National Debt and How to Deal With ItNational Debt and How to Deal With It
National Debt and How to Deal With ItLuke Rzepiennik
 
Fed Reserve Study 2006
Fed Reserve Study 2006Fed Reserve Study 2006
Fed Reserve Study 2006strivere
 
A Test Of Policies: Wisconsin Vs Illinois
A Test Of Policies: Wisconsin Vs IllinoisA Test Of Policies: Wisconsin Vs Illinois
A Test Of Policies: Wisconsin Vs Illinoisradarbutane60
 
Home Mortgage Disclosure Act Report
Home Mortgage Disclosure Act ReportHome Mortgage Disclosure Act Report
Home Mortgage Disclosure Act ReportCTUL
 
Economic Downturn Effect on Fundraising
Economic Downturn Effect on FundraisingEconomic Downturn Effect on Fundraising
Economic Downturn Effect on FundraisingUniversity of Florida
 
767600 jrn0wbro00box374387b00public0
767600 jrn0wbro00box374387b00public0767600 jrn0wbro00box374387b00public0
767600 jrn0wbro00box374387b00public0Arvind Rathod
 
Mercer Capital's BankWatch | October 2013 | Loan Growth Resumes, Remains Slow
Mercer Capital's BankWatch | October 2013 | Loan Growth Resumes, Remains SlowMercer Capital's BankWatch | October 2013 | Loan Growth Resumes, Remains Slow
Mercer Capital's BankWatch | October 2013 | Loan Growth Resumes, Remains SlowMercer Capital
 
Childrens Hospices And The Recession 100129
Childrens Hospices And The Recession 100129Childrens Hospices And The Recession 100129
Childrens Hospices And The Recession 100129Karl Wilding
 
Presentation To Mortgage Servicer
Presentation To Mortgage ServicerPresentation To Mortgage Servicer
Presentation To Mortgage Serviceramygonthebeach
 
Credit demand and_rationing_in_uganda_okurut
Credit demand and_rationing_in_uganda_okurutCredit demand and_rationing_in_uganda_okurut
Credit demand and_rationing_in_uganda_okurutDr Lendy Spires
 
REAL Solutions_Foreclosures in America_2009
REAL Solutions_Foreclosures in America_2009REAL Solutions_Foreclosures in America_2009
REAL Solutions_Foreclosures in America_2009realsolutions
 
The Next Financial Crisis?
The Next Financial Crisis?The Next Financial Crisis?
The Next Financial Crisis?sack4april
 
Ivo Pezzuto - CONCLUSIONS OF THE US FINANCIAL CRISIS INQUIRY COMMISSION (2011)
Ivo Pezzuto - CONCLUSIONS OF THE US FINANCIAL CRISIS INQUIRY COMMISSION (2011)Ivo Pezzuto - CONCLUSIONS OF THE US FINANCIAL CRISIS INQUIRY COMMISSION (2011)
Ivo Pezzuto - CONCLUSIONS OF THE US FINANCIAL CRISIS INQUIRY COMMISSION (2011)Dr. Ivo Pezzuto
 

What's hot (20)

Retirement Derailers Research Report
Retirement Derailers Research ReportRetirement Derailers Research Report
Retirement Derailers Research Report
 
National Debt and How to Deal With It
National Debt and How to Deal With ItNational Debt and How to Deal With It
National Debt and How to Deal With It
 
Fed Reserve Study 2006
Fed Reserve Study 2006Fed Reserve Study 2006
Fed Reserve Study 2006
 
White Paper UCC Insurance For Secured Lenders
White Paper UCC Insurance For Secured LendersWhite Paper UCC Insurance For Secured Lenders
White Paper UCC Insurance For Secured Lenders
 
A Test Of Policies: Wisconsin Vs Illinois
A Test Of Policies: Wisconsin Vs IllinoisA Test Of Policies: Wisconsin Vs Illinois
A Test Of Policies: Wisconsin Vs Illinois
 
Home Mortgage Disclosure Act Report
Home Mortgage Disclosure Act ReportHome Mortgage Disclosure Act Report
Home Mortgage Disclosure Act Report
 
Economic Downturn Effect on Fundraising
Economic Downturn Effect on FundraisingEconomic Downturn Effect on Fundraising
Economic Downturn Effect on Fundraising
 
767600 jrn0wbro00box374387b00public0
767600 jrn0wbro00box374387b00public0767600 jrn0wbro00box374387b00public0
767600 jrn0wbro00box374387b00public0
 
DC Top 10 for 2021
DC Top 10 for 2021DC Top 10 for 2021
DC Top 10 for 2021
 
Philly public bank and cafr presentation
Philly public bank and cafr presentationPhilly public bank and cafr presentation
Philly public bank and cafr presentation
 
Mercer Capital's BankWatch | October 2013 | Loan Growth Resumes, Remains Slow
Mercer Capital's BankWatch | October 2013 | Loan Growth Resumes, Remains SlowMercer Capital's BankWatch | October 2013 | Loan Growth Resumes, Remains Slow
Mercer Capital's BankWatch | October 2013 | Loan Growth Resumes, Remains Slow
 
Bpm
BpmBpm
Bpm
 
Press Final
Press FinalPress Final
Press Final
 
Childrens Hospices And The Recession 100129
Childrens Hospices And The Recession 100129Childrens Hospices And The Recession 100129
Childrens Hospices And The Recession 100129
 
Presentation To Mortgage Servicer
Presentation To Mortgage ServicerPresentation To Mortgage Servicer
Presentation To Mortgage Servicer
 
Credit demand and_rationing_in_uganda_okurut
Credit demand and_rationing_in_uganda_okurutCredit demand and_rationing_in_uganda_okurut
Credit demand and_rationing_in_uganda_okurut
 
REAL Solutions_Foreclosures in America_2009
REAL Solutions_Foreclosures in America_2009REAL Solutions_Foreclosures in America_2009
REAL Solutions_Foreclosures in America_2009
 
Fair Credit and Fair Housing in the Wake of the Subprime and Foreclosure Crisis
Fair Credit and Fair Housing in the Wake of the Subprime and Foreclosure CrisisFair Credit and Fair Housing in the Wake of the Subprime and Foreclosure Crisis
Fair Credit and Fair Housing in the Wake of the Subprime and Foreclosure Crisis
 
The Next Financial Crisis?
The Next Financial Crisis?The Next Financial Crisis?
The Next Financial Crisis?
 
Ivo Pezzuto - CONCLUSIONS OF THE US FINANCIAL CRISIS INQUIRY COMMISSION (2011)
Ivo Pezzuto - CONCLUSIONS OF THE US FINANCIAL CRISIS INQUIRY COMMISSION (2011)Ivo Pezzuto - CONCLUSIONS OF THE US FINANCIAL CRISIS INQUIRY COMMISSION (2011)
Ivo Pezzuto - CONCLUSIONS OF THE US FINANCIAL CRISIS INQUIRY COMMISSION (2011)
 

Viewers also liked

Viewers also liked (14)

A mi edad
A mi edadA mi edad
A mi edad
 
Reyes magos vs santa
Reyes magos vs santaReyes magos vs santa
Reyes magos vs santa
 
Gbi
GbiGbi
Gbi
 
Social media
Social mediaSocial media
Social media
 
Adolescência no Brasil
Adolescência no Brasil Adolescência no Brasil
Adolescência no Brasil
 
Digipak analysis
Digipak analysisDigipak analysis
Digipak analysis
 
Cообщающиеся сосуды
Cообщающиеся сосудыCообщающиеся сосуды
Cообщающиеся сосуды
 
No hay problema
No hay problemaNo hay problema
No hay problema
 
Guias rapidas mme copia
Guias rapidas mme   copiaGuias rapidas mme   copia
Guias rapidas mme copia
 
Digital Marketing - Teil I von III
Digital Marketing - Teil I von IIIDigital Marketing - Teil I von III
Digital Marketing - Teil I von III
 
Travian
TravianTravian
Travian
 
Memilih Jodoh dengan metode bayes
Memilih Jodoh dengan metode bayesMemilih Jodoh dengan metode bayes
Memilih Jodoh dengan metode bayes
 
Use of indesign and photoshop
Use of  indesign and photoshopUse of  indesign and photoshop
Use of indesign and photoshop
 
Attachment (1)
Attachment (1)Attachment (1)
Attachment (1)
 

Similar to FlexWage White Paper_Barth and Helm_November_28_2016

The Development of the Reverse Mortgage Market
The Development of the Reverse Mortgage MarketThe Development of the Reverse Mortgage Market
The Development of the Reverse Mortgage MarketTom Roughan
 
Five Minutes of Financial Literacy A guide for college s.docx
Five Minutes of Financial Literacy A guide for college s.docxFive Minutes of Financial Literacy A guide for college s.docx
Five Minutes of Financial Literacy A guide for college s.docxAKHIL969626
 
Feb 2015 Newsletter
Feb 2015 NewsletterFeb 2015 Newsletter
Feb 2015 NewsletterPeter Mu
 
Payday Lending in TEXAS-Brief
Payday Lending in TEXAS-BriefPayday Lending in TEXAS-Brief
Payday Lending in TEXAS-BriefRama Gerig
 
Poverty chapter 10
Poverty chapter 10Poverty chapter 10
Poverty chapter 10Ray Brannon
 
Avoid Mistakes in Buying LTC Insurance
 Avoid Mistakes in Buying LTC Insurance Avoid Mistakes in Buying LTC Insurance
Avoid Mistakes in Buying LTC Insurancefreddysaamy
 
Winning Affluent Millennials: A LinkedIn and Ipsos Study
Winning Affluent Millennials: A LinkedIn and Ipsos StudyWinning Affluent Millennials: A LinkedIn and Ipsos Study
Winning Affluent Millennials: A LinkedIn and Ipsos StudyIpsos Business Consulting
 
Are We Overestimating Demand for Microloans?
Are We Overestimating Demand for Microloans? Are We Overestimating Demand for Microloans?
Are We Overestimating Demand for Microloans? Dr Lendy Spires
 
Are We Overestimating Demand for Microloans
Are We Overestimating Demand for MicroloansAre We Overestimating Demand for Microloans
Are We Overestimating Demand for MicroloansDr Lendy Spires
 
Mortgage Fraud, Fraud And Fraud
Mortgage Fraud, Fraud And FraudMortgage Fraud, Fraud And Fraud
Mortgage Fraud, Fraud And FraudRenee Jones
 
underbank-economic-full-092110
underbank-economic-full-092110underbank-economic-full-092110
underbank-economic-full-092110Donna V.S. Ortega
 
Td Household Debt Report
Td Household Debt ReportTd Household Debt Report
Td Household Debt Reporthbains758hhc
 
Controlling the Growth of Payday Lending Through Local O.docx
Controlling the Growth of Payday Lending Through Local O.docxControlling the Growth of Payday Lending Through Local O.docx
Controlling the Growth of Payday Lending Through Local O.docxdickonsondorris
 
Counting the-cost-of-debt-recovery
Counting the-cost-of-debt-recoveryCounting the-cost-of-debt-recovery
Counting the-cost-of-debt-recoveryEchoMarketing
 

Similar to FlexWage White Paper_Barth and Helm_November_28_2016 (20)

Emerge ing
Emerge ingEmerge ing
Emerge ing
 
The Development of the Reverse Mortgage Market
The Development of the Reverse Mortgage MarketThe Development of the Reverse Mortgage Market
The Development of the Reverse Mortgage Market
 
Five Minutes of Financial Literacy A guide for college s.docx
Five Minutes of Financial Literacy A guide for college s.docxFive Minutes of Financial Literacy A guide for college s.docx
Five Minutes of Financial Literacy A guide for college s.docx
 
A_Beale Final Project
A_Beale Final ProjectA_Beale Final Project
A_Beale Final Project
 
Cdl conference finance presentation v.final
Cdl conference finance presentation v.finalCdl conference finance presentation v.final
Cdl conference finance presentation v.final
 
Top Financial Sector Trends
Top Financial Sector TrendsTop Financial Sector Trends
Top Financial Sector Trends
 
Feb 2015 Newsletter
Feb 2015 NewsletterFeb 2015 Newsletter
Feb 2015 Newsletter
 
The New Face of LMI Lending
The New Face of LMI Lending The New Face of LMI Lending
The New Face of LMI Lending
 
Payday Lending in TEXAS-Brief
Payday Lending in TEXAS-BriefPayday Lending in TEXAS-Brief
Payday Lending in TEXAS-Brief
 
Poverty chapter 10
Poverty chapter 10Poverty chapter 10
Poverty chapter 10
 
Avoid Mistakes in Buying LTC Insurance
 Avoid Mistakes in Buying LTC Insurance Avoid Mistakes in Buying LTC Insurance
Avoid Mistakes in Buying LTC Insurance
 
Winning Affluent Millennials: A LinkedIn and Ipsos Study
Winning Affluent Millennials: A LinkedIn and Ipsos StudyWinning Affluent Millennials: A LinkedIn and Ipsos Study
Winning Affluent Millennials: A LinkedIn and Ipsos Study
 
Are We Overestimating Demand for Microloans?
Are We Overestimating Demand for Microloans? Are We Overestimating Demand for Microloans?
Are We Overestimating Demand for Microloans?
 
Are We Overestimating Demand for Microloans
Are We Overestimating Demand for MicroloansAre We Overestimating Demand for Microloans
Are We Overestimating Demand for Microloans
 
Mortgage Fraud, Fraud And Fraud
Mortgage Fraud, Fraud And FraudMortgage Fraud, Fraud And Fraud
Mortgage Fraud, Fraud And Fraud
 
underbank-economic-full-092110
underbank-economic-full-092110underbank-economic-full-092110
underbank-economic-full-092110
 
Td Household Debt Report
Td Household Debt ReportTd Household Debt Report
Td Household Debt Report
 
Controlling the Growth of Payday Lending Through Local O.docx
Controlling the Growth of Payday Lending Through Local O.docxControlling the Growth of Payday Lending Through Local O.docx
Controlling the Growth of Payday Lending Through Local O.docx
 
Q117 TD Return On Investment Newletter Kriss Bush January 1, 2017pdf
Q117 TD Return On Investment Newletter Kriss Bush January 1, 2017pdfQ117 TD Return On Investment Newletter Kriss Bush January 1, 2017pdf
Q117 TD Return On Investment Newletter Kriss Bush January 1, 2017pdf
 
Counting the-cost-of-debt-recovery
Counting the-cost-of-debt-recoveryCounting the-cost-of-debt-recovery
Counting the-cost-of-debt-recovery
 

FlexWage White Paper_Barth and Helm_November_28_2016

  • 1. 1 It’s Your Money: Todays Technology Lets You Take It When You Need It James R. Barth & Edwin A. Helm1 At one time or another, no matter our age, address, or income level, we all want or need to borrow funds to purchase goods or services. At year’s end 2015 in the United States alone, some 321 million people, comprising 126 million households, had outstanding debt of $12 trillion.2 The purpose of the loans varied widely, from cell phone purchases to cars, college tuition, and homes. But access to credit doesn’t just enable us to buy more goods and services; it contributes to job creation and economic growth. In short, active and well-functioning loan markets promote social welfare. Stringency of Loan Terms Hits LowerIncome Groups Hardest But all loans are not created equal. They differ in terms of interest rates, loan amounts, and terms to maturity. The specific mix of these factors depends in large part on the creditworthiness of the borrower. More creditworthy individuals typically can borrow more funds for longer periods, and at lower interest rates. Understandably, a key factor in determining an individual’s creditworthiness is income. And not surprisingly, individuals in lower income brackets are subject to more stringent lending terms than those in the higher income brackets. There’s also a substantial difference in income distribution across households. Of those 126 million households holding loans last year, 22 percent earned less than $25,000; 23 percent earned more than $25,000 but less than $50,000; 29 percent earned more than $50,000 but less than $100,000; and 26 percent earned more than $100,000.3 Again, individuals in the lower income brackets will have to accept the most stringent lending terms. For these households, in particular, but for all households, of course, efficient and expeditious access to credit is a great advantage, and at times a life-saver. Even better, however, would be access to their own earned income, which could reduce or remove the need to take out a loan at all, especially a short-term loan with its attendant high fees. New financial technologies are 1. James R. Barth is Lowder Eminent Scholar in Finance at Auburn University, Senior Finance Fellow at the Milken Institute, Fellow of the Wharton Financial Institutions Center,and Advisor to FlexWage and Edwin A. Helm is CEO of Acumen Capital Group and an investor in FlexWage. 2. See US Census Bureau population estimates (National Characteristics:Vintage 2015) at www.census.gov/popest/data/national/asrh/2015/index.html; See US Census Bureau, “Income and Poverty in the United States:2015” at http://www.census.gov/data/tables/2016/demo/income- poverty/p60-256.html (Table 1); and see FederalReserve Bank of New York, “Quarterly Report on Household Debt and Credit” (February 2016) at https://www.newyorkfed.org/medialibrary/interactives/householdcredit/data/pdf/HHDC_2015Q4.pdf. 3. See US Census Bureau,“Income and Poverty in the United States: 2015” at http://www.census.gov/data/tables/2016/demo/income-poverty/p60-256.html (Table A-1).
  • 2. 2 making this possible. Employees can now access their earned income more frequently than the typical two-week pay cycles now in use. People Borrow for Different Reason We borrow money for many different reasons. The more common loans—for college tuition or for a car or home—are those we anticipate and tend to plan for, generally by saving and setting aside funds to lessen the loan amount. It’s the unexpected expenses like auto repairs, broken appliances, emergency medical attention that can catch people off guard, with insufficient savings to cover them. Indeed, over the past twelve months, only 56.3 percent of US households have saved for unexpected expenses or emergencies.4 Again, immediate access to one’s earned income would ease some of the financial stress these emergencies trigger. Unfortunately, too many employees must turn elsewhere, to more expensive funding sources. According to the Federal Reserves “Report on the Economic Well-Being of US Households in 2015,” “Forty-six percent of adults say they either could not cover an emergency expense costing $400, or would cover it by selling something or borrowing money.”5 They likely know already that being cash-poor in an emergency is the surest indicator (and inducer) of financial stress—and their need to access funds without delay is no less crucial than the imperative of maintaining a paycheck to cover the new expenses. Factors Affecting Financial Wellness Close to 76 million adults are struggling financially, according to the report from the Federal Reserve,6 and a significant number of those reported they were actually worse off than they’d been the year before. Overall, individual financial well-being differs significantly, depending on family income, race/ethnicity, education, and marital and parental status. Individuals who find it more difficult to get by have lower family incomes, are black (non-Hispanic) or Hispanic, hold a high school degree or less, and are unmarried have children under 18. Table 1 provides information on the overall financial well-being of individuals, based upon various criteria. Clearly, not everybody is living comfortably. Yet everyone seems to be concerned about their financial health. As would be expected, higher-income individuals are better able to focus on their long-run financial health, whereas those lower in the income distribution are less able to focus on these concerns while they struggle to meet pressing short- term financial obligations. When people live paycheck to paycheck, they are living with uncertainty. Auto or home repairs, a medical or dental crisis—any of these can push the person who is just getting by right off the financial cliff. 4. See 2015 FDIC, “National Survey of Unbanked and Underbanked Households” at www.fdic.gov/householdsurvey/2015/2015report.pdf. 5. See Federal Reserve,“Report on the Economic Well-Being of US Households in 2015.” 6. Ibid.
  • 3. 3 Table 1. Overall individual financial well-being (percentage/characteristics) Characteristic Finding it difficult to get by Just getting by Doing okay Living comfortably Family income Less than $40,000 17.7 31.6 38.5 12.1 $40,000–$100,000 4.4 19.4 47.3 28.8 Greater than $100,000 1.8 7.9 36.6 53.7 Race/ethnicity White, non-Hispanic 8.5 20.3 40.7 30.3 Black, non-Hispanic 10.3 28.3 40.9 20.4 Hispanic 12.3 24.7 42.6 20.5 Education High school degree or less 12.9 25.9 41.2 19.8 Some college or associate degree 8.9 25.1 42.1 23.9 Bachelor’s degree or more 5.7 13.8 39.5 40.9 Marital and parental status Unmarried, no children under 18 12.1 25 41.7 21 Married, no children under 18 5.6 15.3 42.5 36.7 Unmarried, children under 18 18.7 34.3 33.7 13.3 Married, children under 18 6.9 22.2 39.9 31 Overall 9.4 22 41 27.6 Source: FederalReserve, “Report on the Economic Well-Being of US Households in 2015.” Of note, the report examines whether variation in monthly income or expenses affects the ability of individuals to pay their bills. It was found that: Overall, 42 percent of those with volatile incomes or expenses report that they struggled to pay their bills at least once in the last year due to this kind of volatility. The potential for hardship from volatile incomes and expenses appears to be greatest among lower- income respondents and among credit-constrained respondents. Among those with volatile incomes or expenses whose family income is under $40,000 per year, 54 percent report that they struggled to pay their bills due to this volatility. Among lower-income respondents who are not confident that they would be approved for a credit card if they were to apply for one, an even higher 72 percent report that they struggled to pay their bills due to income or expense fluctuations.
  • 4. 4 Sources ofFunds for EmergencyNeeds As we have seen, close to 76 million adults are struggling financially. When such individuals borrow, particularly to cover emergency costs, they currently turn to a number of sources, the most expensive of which include overdrafts, payday loans, pawn shop loans, and title loans. The size of the market for these particular sources of funds in very rough terms involves more than 60 million Americans, obtaining more $50 billion in loans, and paying more than $40 billion in fees. The next paragraphs address in some detail the extent to which individuals rely upon and the costs associated with of each of these sources of funds. Bank Overdrafts In 2015, US bank customers paid overdraft fees totaling $32.5 billion, with an average overdraft fee of $35. Within the past year, 18 percent of Americans overdrew their bank accounts; and of these individuals, 64 percent earned less than $30,000 per year.7 Of “heavy” overdrafters, i.e., those who incur over $100 in overdraft and insufficient funds fees (or roughly three $35 fees per year), 70 percent are employed; these people would benefit greatly if they had access to their earned income before payday.8 Table 2 shows the extent to which individuals of all different ages overdraw their accounts. Table 2. Distribution of accounts and overdraft fees (percent/frequency, age) 18–25 26–45 46–61 62 and over Annualized number of overdrafts Accounts Percent Overdraft fees Percent Accounts Percent Overdraft fees Percent Accounts Percent Overdraft fees Percent Accounts Percent Overdraft fees Percent None 61.5 0.0 64.1 0.0 72.4 0.0 84.6 0.0 1−3 14.7 9.6 13.7 7.2 12.4 8.8 8.4 13.3 4−10 13.1 21.9 11.0 16.0 8.2 17.6 4.2 21.5 10-plus 10.7 68.4 11.1 76.8 7.0 73.5 2.8 65.2 Source: Consumer Finance Protection Bureau, “Data Point: Checking Account Overdraft.” Table 3 offers more detailed information about overdrafters. As shown, every category of individual commits overdrafts—renters and homeowners, single and married, male and female, less and more educated, and all demographic groups. Also notice that overdrafts occur among individuals at all levels of income. This particular issue is not simply one that arises among only lower-income individuals. It is employed persons, moreover, that account for the category with the highest percentage of overdrafters. This percentage even exceeds the percentage of the population that is employed, 68 versus 59 percent. Lastly, overdrafters are found throughout the country, though there is clearly some differences in the extent across regions. 7. See www.statisticbrain.com/total-overdraft-fees/. 8. See Pew Charitable Trusts www.pewtrusts.org/en/research-and-analysis/fact-sheets/2016/04/heavy- overdrafters.
  • 5. 5 Table 3. Overdrafters vs. US population, by demographic characteristic Percent Overdrafters Percent US Population Renters 54 36 Homeowners 44 62 Single 44 32 Married 39 49 Employed 68 59 Income under $25,000 32 25 $25,000 to under $40,000 22 16 $40,000 to under $75,000 23 21 $75,000 to $100,000+ 14 23 White (non-Hispanic) 51 65 African-American (non-Hispanic) 18 11 Hispanic 19 13 Ages 18–29 31 21 Ages 30–49 42 33 Ages 50–64 18 24 Ages 65+ 5 17 Less than high school 13 13 High school 30 30 Some college 34 26 College 13 19 Male 48 49 Female 52 51 Northeast 20 18 South 37 37 North-Central 19 21 West 23 23 Source: 2014 Pew Charitable Trusts, “Overdrawn: Persistent Confusion and Concern about Bank Overdraft Practices.” Payday Loans Payday loan stores provide small-dollar, short-term loans from an estimated 20,600 locations across the country. They extend nearly $40 billion in short-term credit to 19 million households that experience cash-flow shortfalls.9 The borrower of a payday loan must have a checking account and proof of income. The average payday loan requires a lump-sum repayment of $430 on the next payday, consuming 36 percent of an average borrower’s gross paycheck. 9. See Community Financial Services Association at http://cfsaa.com/about-the-payday-advance- industry.aspx.
  • 6. 6 According to the Pew Charitable Trusts, the average payday loan borrower is in debt five months of the year and spends an average of $520 in fees annually to repeatedly borrow $375. The average fee at a storefront loan business is $55 per two-week period. Average borrowers earn about $30,000 per year, and 58 percent have trouble meeting their monthly expenses. The average annual percentage rate for a payday loan is 391 percent.10 Payday lenders have come under scrutiny in recent years amid accusations that some of them engage in predatory and abusive practices, and lure their targets, often single women and minorities, into harmful debt traps. “When emergencies arise, people need access to credit,” said Massachusetts Sen. Elizabeth Warren this past April, “but payday lenders that build business models around trapping people in a never-ending cycle of debt are throwing bricks to a drowning man.” The payday loan industry has expanded to online “stores” in recent years. Some payday lenders operate both stores and online, but others are online only. The payday lenders operating through storefronts still account for the majority of the payday lender industry. There are some differences between storefront loans and online loans, however. Two major differences are that (1) storefront loans are secured by postdated checks or authorization to debit the borrowers’ bank accounts, whereas online loans primarily use electronic access to borrowers’ bank accounts and (2) the fees for online payday loans are generally higher than those for storefront loans.11 Figure 1 provides information on the number of online payday overdrafts and nonsufficient funds transactions per account. Accounts that have at least one online payday loan payment request resulting in an overdraft or insufficient funds are charged on average $185 in fees by the linked bank on attempted payment requests from online lenders. Figure 1. Number of online payday overdraft and nonsufficient funds transactions per account Source: Consumer Financial Protection Bureau Report: “Online Payday Loan Payments.” 10. See Pew Charitable Trusts, “Payday Loan Facts and the CFPB’s Impact” (2016) at http://www.pewtrusts.org/~/media/assets/2016/06/payday_loan_facts_and_the_cfpbs_impact.pdf. 11. See Pew Charitable Trusts, “Fraud and Abuse Online: Harmful Practices in Internet Payday Lending” (2014) at http://www.pewtrusts.org/~/media/assets/2014/10/payday-lending- report/fraud_and_abuse_online_harmful_practices_in_internet_payday_lending.pdf.
  • 7. 7 Pawn Shop Loans More than 30 million people use pawn shop lending services, with the average loan totaling $150. However, loans can be made for any amount, depending on the value of the pawned item. The Texas-based Cash America (which was acquired in September 2016 by First Cash Financial Services) disclosed in its 2014 annual report that it owned 84 check cashing centers and 859 lending locations across the country and had made over $1 billion in pawn loans per year. The company noted that 30 percent of borrowers never return to redeem the items they pawned and sales of those items made up over half the company revenues.12 The National Pawnbrokers Association reports that interest rates for 30-day loans are usually less than bank overdraft fees, and that “for years, pawn stores have been providing safety net loans to families that encounter sudden financial emergencies.”13 Title Loans Auto title loans are similar to payday loans, except that the average loan is $1,000 and is secured by a borrower’s car title. Roughly 2.5 million Americans spend $3 billion on auto title loan fees each year.14 The typical annual percentage rate charged is 300 percent. More than 8,000 title loan stores operate in the US.15 Unbanked and Underbanked Households Approximately 9.0 million US households, comprising 15.6 million adults and 7.6 million children, were unbanked in 2015. These are households in which no one has a checking or savings account. Underbanked households hold a bank account but turn to alternative sources for financial services and products. Some 24.5 million US households, comprising 51.1 million adults and 16.3 million children, were underbanked in 2015. “Specifically, a household is categorized as underbanked,” notes the FDIC, “if it had a checking or savings account and used one of the following products or services from an alternative financial services (AFS) provider in the past twelve months: money orders, check cashing, international remittances, payday loans, refund anticipation loans, rent-to-own service, pawn shop loans, or auto title loans.”16 12. “Reverse Robin Hood: $6 Billion Businesses Preying on Poor People” at http://truth-out.org/buzzflash/commentary/reverse-robin-hood-six-billion-dollar-businesses-preying-on- poor-people. 13. National Pawnbrokers Association, www.nationalpawnbrokers.org/2012/6-things-everyone-should- know-before-going-to-a-pawn-shop/. 14. See Pew Charitable Trusts, “Payday Loan Facts and the CFPB’s Impact.” 15. See Pew Charitable Trusts, “Auto Title Loans: Market Practices and Borrowers’ Experiences” at www.pewtrusts.org/~/media/assets/2015/03/autotitleloansreport.pdf?la=en. 16. See FDIC “National Survey of Unbanked and Underbanked Households” (2015) at www.fdic.gov/householdsurvey/2015/2015report.pdf.
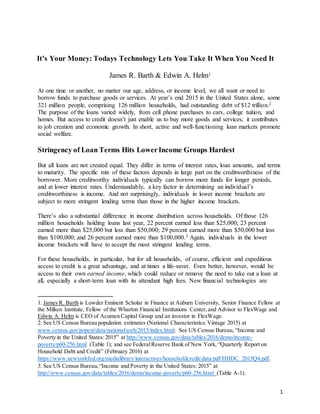
  • 8. 8 Additional Problems with High-Cost Loans We’re a nation of borrowers, and financial stress has carried over into the workplace, according to studies. Stressed workers affect businesses through lost productivity, absenteeism, accidents, and health issues. The observed reduction in productivity is the equivalent of about twenty hours on average per month per employee. “Stressed employees spend time during work hours on the phone dealing with creditors; working on debt consolidation; worrying about bouncing checks; worrying about having enough money to pay their monthly utility bills, mortgage and medical expenses; college tuition and more,” notes one summary of the effects of financial street put out by Wellness Indiana, a nonprofit owned by the Indiana Chamber of Commerce. There are also more workplace accidents when employees are stressed; between 60 percent and 80 percent of workplace accidents occur because of distractions attributable to stress.17 One out of every four US employees reports serious financial stress, according to an article that the Missouri-based Pension Consultants posts on its home page; and employee financial stress hurts the bottom line. The following pie chart offers a snapshot of just some of the costs companies face that are associated with financially stressed employees.18 Figure 2. Costs per Stressed Employee Source: Pension Consultants Inc. 17. “Employee Financial Stress Is Costing Your Company a Bundle—And How You Can Stop It Now!” 2012. www.wellnessindiana.org/wp-content/uploads/2012/07/Employee-Financial-Stress-is-Costing- Your-Company-a-Bundle.pdf. 18. “The Impact of Financial Stress on Workforce Productivity,” February 27, 2014. http://pension-consultants.com/the-impact-of-financial-stress-on-workforce-productivity/. $3,600 $7,000 $29,000 $3,500 Absenteeism Lost Productivity Workplace Accidents Turnover
  • 9. 9 What Can Be Done to Reduce the Reliance on High-CostFunds? In June, the Consumer Financial Protection Bureau (CFPB) proposed new rules that would eliminate about 80 percent of payday loans. If the new rules are instituted, millions of workers will have fewer ways to obtain fast cash for urgent needs, resulting in increased workplace stress that costs firms in terms of lost productivity, absenteeism, low retention, and employee satisfaction. But access to funds for emergency purposes need no longer mean dependence on high-cost credit. As noted earlier, technological innovation is allowing people to access their own earned income “banked” by their employer for days already worked. An employee typically receives pay on either a weekly and biweekly schedule; but wages accrue hourly or daily. Now an employee can access his or her earned income before the actual pay period ends. A firm that provides this service is New Jersey-based financial services company FlexWage (www.flexwage.com ). Since its founding in 2010, FlexWage has partnered with more than 150 firms, cities, and municipalities in twenty-six states that use its technology to allow employees to make early withdrawals of unpaid wages via electronic routing of payroll funds directly to proprietary “prepaid” (Visa and MasterCard debit cards) cards. The typical charge for early payroll access, is $3−$5; the amount accessible is typically up to 75 percent of the accrued net wages, though an employer can adjust the figures. Indeed, companies can create their own policies regarding the percentage of wages that can be accessed and how frequently employees can withdraw funds. Because the employee isn’t borrowing funds, there’s no repayment and no interest. Moreover, this source of funds avoids giving out your information to, for example, an online payday lender. This is important because simply entering information on such a site may come back to haunt an individual.19 FlexWage also enables its partners to convert their entire systems to electronic payroll and payroll cards, thus cutting employer costs associated with printing and mailing paper checks, and employee costs for check cashing, money order, and bank fees. Furthermore, the program, WageBank (www.wagebank.com) , is easy to implement, with just four steps: 1. Employers provide the governing policies, pay schedules, and funding methods, including, more specifically, the percentage of accrued wages available for transfer, the number of WageBank transfers per pay period, number of WageBank transfers per month, and number of WageBank transfers per year. 2. Employers provide employee payroll and time/labor data. 3. FlexWage provides training and communications materials. 4. The program is rolled out to employees. 19. Federal Trade Commission, “Online Payday Loans” (February 2013) at https://www.consumer.ftc.gov/articles/0249-online-payday-loans.
  • 10. 10 Near the end of each pay period, the FlexWage application will close access to WageBank for that pay period and provide reporting to the employer for all WageBank transaction activity. Transaction activity is uploaded into the payroll system similar to a benefit file, and deducted from the employee’s pay as an after-tax benefit line item. The WageBank transaction fee is also deducted as a separate line item. The bottom line is this: Employers providing a service to their employees like the one offered by FlexWage will discover a happier, healthier, more productive and more loyal workforce—a win for both, and an overall improvement in the financial well-being of workers who would otherwise be paying more in high fees, interest, or penalties.