Acid fumigation of soils to remove co3 prior to c 13 isotopic analysis
•
0 recomendaciones•40 vistas

Acid fumigation of soils to remove co3 prior to c 13 isotopic analysis

Recomendados
Recomendados
Más contenido relacionado
La actualidad más candente
La actualidad más candente (20)
Similar a Acid fumigation of soils to remove co3 prior to c 13 isotopic analysis
Similar a Acid fumigation of soils to remove co3 prior to c 13 isotopic analysis (20)
Más de Mahbubul Hassan
Más de Mahbubul Hassan (20)
Último
Último (20)
Acid fumigation of soils to remove co3 prior to c 13 isotopic analysis
- 1. DIVISION S-8—NOTES pathway of vegetation (C3 vs. C4). When a sample is ACID FUMIGATION OF SOILS TO combusted at high temperature (1000⬚C), all organic REMOVE CARBONATES PRIOR TO and inorganic C present in the soil is converted into CO2. To avoid the confounding influence of inorganic TOTAL ORGANIC CARBON C during the determination of the isotopic signature of OR CARBON-13 ISOTOPIC ANALYSIS the organic C, all carbonates must be removed prior to isotopic analysis. Because carbonates may be enriched David Harris, William R. Horwáth, in 13 C by as much as 30‰ compared with organic C, and Chris van Kessel* partial removal of carbonates will have a large effect on the ␦13 C signature of the sample. For example, if Abstract residual carbonate at 0‰ accounts for 1% of total soil The use of 13 C natural abundance (␦13 C) to follow C input to soil C in a soil where organic C is ⫺25‰, the inclusion of the has gained widespread acceptance. However, inorganic C present in CO2 in the measurement would result in a 0.25‰ error. the soil as carbonates will interfere with the measurement of soil A common method to remove carbonates from soil organic 13 C unless removed or excluded from measurement. We report is treatment with dilute HCl or H3PO4 (Connin et al., a simple and convenient HCl-fumigation method to remove inorganic 1997; Rochette and Flanagan, 1997; Collins et al., 1999; C from soil. Soil samples are weighed in Ag-foil capsules, arranged on a microtiter plate, wetted with water to approximately field capac- Van Kessel et al., 2000b). Although acid washing will ity, and placed in a desiccator containing a beaker with concentrated remove all carbonates, the procedure is time consuming (12 M) HCl. The carbonates are released as CO2 by the acid treatment and could lead to losses of acid-soluble organic C. Thus, in 6 to 8 h. The soil samples are then dried at 60ⴗC prior to isotope there is a risk that the soluble C may be isotopically determination. The advantages of the HCl-fumigation method to re- different from the insoluble residue. However, Mid- move inorganic C from the soil are that: (i) no water soluble C will wood and Boutton (1998) found that the ␦13 C signature be lost from the soil; (ii) a large number of samples can be processed of SOM C was largely unaffected by the acid concentra- simultaneously; (iii) the removal of inorganic C is rapid and complete; tion (0.1–6 M HCl) or duration (1–8 d) of the acid and (iv) the method could also be used to determine both organic treatment. To avoid losses of soluble organic C and and inorganic C content in the soil. A potential disadvantage, however, possible changes in the ␦13 C signature of SOM, the re- is that the HCl fumigation changed the 15 N natural abundance of soil N. moval of carbonates can be carried out by HCl fumiga- tion (Hedges and Stern, 1984). Using continuous flow isotope ratio mass spectrome- The ␦ 13 C method is increasingly being used to follow ters, it has been common to determine both the 13 C and C dynamics in the soil (Balesdent and Mariotti, 15 N isotopes from a single combusted sample (Nadelhof- 1996; Collins et al., 1999). The difference between the fer and Fry, 1988; Van Kessel et al., 1994). However, the 13 C content of the existing soil organic matter (SOM) possibility that HCl fumigation changes the 15 N isotopic and the new plant C may result from changes in the pho- composition of the sample must be investigated if C and tosynthetic pathway of vegetation (C3 vs. C4) (Bales- N isotope measurements are to be routinely applied. dent and Mariotti, 1996; Collins et al., 1999), or when The main objectives of this study were (i) to deter- 13 C depleted CO2 is used to elevate the atmospheric CO2 mine the effectiveness of HCl fumigation in removing concentration such as in a free atmospheric CO2 en- carbonates from soil, (ii) to test the effects of HCl treat- richment (FACE) experiment (Leavitt et al., 1994; Van ments on the residual SOM 13 C, and (iii) to determine Kessel et al., 2000a,b). The difference in the ␦13 C values the effects of the HCl treatment on ␦15 N of soil N. The of the new C input and of the older SOM C is sufficiently possible use of the HCl-fumigation method to determine large to follow the dynamics of both the new and the inorganic and organic C contents was also explored. old C in the soil (Balesdent et al., 1988). In addition to organic C, soil may also contain inor- Materials and Methods ganic C in the form of carbonates. The C in primary or lithogenic carbonates has ␦13 C values close to 0‰ Pee To determine the rate and effectiveness of carbonate re- Dee Belemnite (PDB) (Boutton, 1991). Pedogenic or moval by HCl vapor, a calcareous soil with a high inorganic C content was selected (Table 1). The calcareous soil (Molli- secondary carbonates show ␦13 C values between ⫺12 sol) was oven-dried and ball-milled for 24 h. Subsamples (30 and ⫹2‰ (PDB), depending on the photosynthetic mg) of soil were placed in open Ag-foil capsules (8 by 5 mm). Silver capsules are required because Sn capsules disintegrate D. Harris, Stable Isotope Lab., Univ. of California-Davis, Davis, CA 95616; W.R. Horwáth, Dep. of Land, Air, and Water Resources, when exposed to HCl vapor. The capsules were placed in the Univ. of California-Davis, Davis, CA 95616; C. van Kessel, Dep. of wells of a microtiter plate, sufficient water was added to each Agronomy and Range Science, Univ. of California-Davis, Davis, CA capsule (50 L) to moisten the soil to approximately field 95616. Received 13 July 2000. *Corresponding author (cvankessel@ ucdavis.edu). Abbreviations: SOM, soil organic matter; FACE, Free Atmospheric CO2 Enrichment; HCl, HCl acid; ␦ 13 C, natural abundance 13 C. Published in Soil Sci. Soc. Am. J. 65:1853–1856 (2001). 1853
- 2. 1854 SOIL SCI. SOC. AM. J., VOL. 65, NOVEMBER–DECEMBER 2001 Table 1. Physical and chemical characteristics of the soils used for the HCl fumigation and washing experiment. Soil order and description Common name Horizon pH Total C Total N Sand Silt Clay CEC mg g⫺1 g kg⫺1 cmol kg⫺1 Inceptisol: loamy, mixed, superactive, thermic Lithic Haploxerepts Auburn A† 5.8 29.1 2.5 460 320 120 12.2‡ Inceptisol: loamy, mixed, active, mesic shallow, Typic Dystroxerepts Chawanakee A† 5.8 24.8 1.3 180 90 630 6.4‡ Inceptisol: loamy skeletal, mixed, superactive, mesic, Typic Haploxerepts Pardaloe A§ 6.2 26.2 1.3 210 430 360 24.7 Entisol: fine silty, siliceous, active, acid, thermic, Fluvaquentic Endoaquepts Pophers A¶ 4.3 50.7 4.3 10 600 390 3.6 Mollisol: clay-loamy, mesic, Argiudoll Unknown C 8.1 25.8 3.6 320 370 310 NA# † Data from Trott, 1981. ‡ Includes only Ca and Mg. § Data from Munn and Singer, 1981, p. 93. ¶ Data from Midwood and Boutton, 1998. # NA ⫽ not available. capacity, and the microtiter plate was then placed in a vacuum expressed relative to atmospheric N2. The ␦13 C values are expressed relative to Vienna-Pee Dee Belemnite (V-PDB). desiccator (5 L). A beaker (150 mL) with 100 mL of concen- trated (12 M) HCl was also placed inside the desiccator. The Controls (Ag capsules, HCl fumigation and water) were in- cluded. The amounts of C and N in the controls never exceeded samples were exposed to HCl vapor for times increasing in 6-h increments to 30 h, then 12-h increments to 96 h. After 2 g for N and 6 g for C, and were too low to obtain a reli- able isotopic composition. each exposure time, four replicates were removed from the desiccator, dried at 60⬚C for 4 h, and the capsules were then One-way analysis of variance followed by the Student-New- man Keuls test (SAS Institute, 1989) was used to test for differ- closed. The effects of HCl fumigation and HCl washing on total ences in total N, total C, ␦15 N, and ␦13 C between treatments. soil N and C content and 13 C and 15 N abundance were deter- mined on four carbonate-free soils: Auburn (loamy, mixed, su- Results and Discussion peractive, thermic Lithic Haploxerepts), Chawanakee (loamy, mixed, active, mesic, shallow Typic Dystroxerepts), Pardaloe A common practice for removing carbonates from (loamy-skeletal, mixed, superactive, mesic Typic Haploxer- soil is washing the samples with dilute acid followed by epts), and Pophers (fine-silty, siliceous, active, acid, thermic several washings with deionized water (Connin et al., Fluvaquentic Endoaquepts) (Table 1). Subsamples of the soil 1997; Midwood and Boutton, 1998; Collins et al., 1999). were analyzed either untreated, exposed overnight to HCl Although, the ␦13 C of the bulk soil organic C may be vapor, or treated with 0.5 M HCl (10 mL g⫺1 soil) for 24 h unaffected by this treatment (Midwood and Boutton, followed by two washings with water. 1998), it is conceivable that the composition of isotopi- The procedure of Midwood and Boutton (1998) was fol- cally heterogeneous soils could be altered by this treat- lowed for acid washing the soils. Briefly, 5 g of ball-milled ment through removal of dissolved organic C. Fumigat- soil was treated with 150 mL of 0.5 M HCl and the soil-acid mixture stirred three times over a 24-h period. Soils were then ing the soil with HCl may reduce or eliminate any washed twice with distilled water. Each time the water was organic C losses and minimize the potential for changes replaced after a 24-h period. Soil was dried at 60⬚C, ground in ␦13 C. by mortar and pestle, 30-mg samples were weighed into Ag Acid fumigation with HCl of the four noncalcareous foil capsules, and the capsules closed for isotopic analysis. soils did not alter their 13 C compositions or their organic Four replicates were used for all analyses. C and total N contents (Table 2). Treating the same soils Total N, total C, ␦15 N, and the ␦13 C for all samples were with dilute HCl followed by washing led to significant determined on a Europa 20-20 continuous flow isotope ratio declines in total soil C and N for all four soils. For three mass spectrometer (PDZ Europa Ltd., Sandbach, UK) follow- soils, the ␦13 C value also became more negative. As the ing combustion at 1000⬚C in a Europa ANCA-GSL CN ana- lyzer (PDZ Europa Ltd., Sandbach, UK). The ␦15 N values are decline in the 13 C value for these three soils ranged Table 2. Results of HCl fumigation and HCl washing on the elemental and isotopic N and C in soil (n ⫽ 4 replicates). Soil name Treatment ␦15 N ␦13 C N C ‰ mg g⫺1 Auburn Untreated 1.80 ⫾ 0.01a† ⫺26.98 ⫾ 0.02a 2.528 ⫾ 0.000a 29.138 ⫾ 0.004a HCl fumigation 1.84 ⫾ 0.05a ⫺26.93 ⫾ 0.01a 2.455 ⫾ 0.000a 28.960 ⫾ 0.008a HCl washed 1.97 ⫾ 0.04b ⫺26.96 ⫾ 0.02a 2.366 ⫾ 0.001b 27.743 ⫾ 0.017b Chawanakee Untreated 0.78 ⫾ 0.04a ⫺26.02 ⫾ 0.01a 1.286 ⫾ 0.002a 24.826 ⫾ 0.026a HCl fumigation 0.84 ⫾ 0.03a ⫺26.04 ⫾ 0.01a 1.300 ⫾ 0.001a 25.124 ⫾ 0.007a HCl washed 0.81 ⫾ 0.02a ⫺26.11 ⫾ 0.01b 1.174 ⫾ 0.002b 23.099 ⫾ 0.027b Pardaloe Untreated 2.70 ⫾ 0.02a ⫺25.90 ⫾ 0.02a 1.251 ⫾ 0.000a 26.206 ⫾ 0.008a HCl fumigation 2.81 ⫾ 0.03b ⫺25.92 ⫾ 0.01a 1.167 ⫾ 0.001a 26.147 ⫾ 0.018a HCl washed 2.84 ⫾ 0.03b ⫺26.06 ⫾ 0.02b 1.139 ⫾ 0.001b 23.881 ⫾ 0.017b Pophers Untreated 2.58 ⫾ 0.02a ⫺27.31 ⫾ 0.02a 4.260 ⫾ 0.002a 54.090 ⫾ 0.028a HCl fumigation 2.64 ⫾ 0.01a ⫺27.28 ⫾ 0.01a 4.175 ⫾ 0.001a 53.158 ⫾ 0.026a HCl washed 3.38 ⫾ 0.04b ⫺27.51 ⫾ 0.01b 3.570 ⫾ 0.004b 48.584 ⫾ 0.045b † Means ⫾ S.E. within a column and followed by the same letter are not significantly different at P ⬍ 0.05.
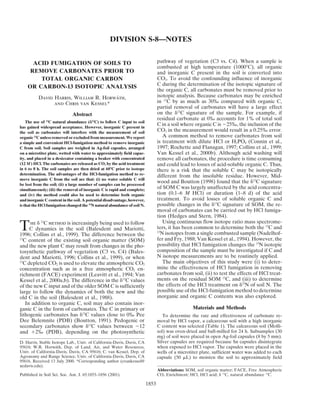
- 3. NOTES 1855 HCl fumigation for 6 h. No further decline in the ␦13 C value occurred for the remainder of the fumigation pe- riod. At the same time, the total C content of the soil declined from a maximum of 32 mg g⫺1 to 8 mg g⫺1 after 6 h of HCl fumigation and remained constant thereafter (Fig. 1). However, Hedges and Stern (1984) found that HCl-vapor treatment failed to remove all carbonate from a soil with 50% carbonate, suggesting that HCl fumigation may not always be completely effective in removing carbonates from highly calcareous soils. Water should be added to the dried soil prior to the HCl fumigation. In dry soil, the rate at which carbonates are converted into CO2 is low and the treatment may fail to remove all carbonates from the soil (data not Fig. 1. Changes in soil C concentration and the 13 C content of soil C shown). In this study, the addition of 50 L of distilled following the removal of carbonates by HCl fumigation. The open water to 30 mg of soil was sufficient to ensure complete squares represent C values, the closed squares represent ␦13 C removal of carbonates upon HCl fumigation. values. The HCl fumigation technique is a convenient and easy method to remove inorganic C and could poten- between 0.09 and 0.20‰, the removed C was enriched tially also be used to determine the quantity of organic in 13 C compared with residual organic C. When coralline and inorganic C in a soil. One sample of the soil should sediments that contained ⬎80% by weight CaCO3 were be fumigated with HCl, another sample left untreated. exposed to HCl fumigation, no contamination or loss Following total C analysis, the difference in total C of organic C and N occurred (Yamamuro and Kayanne, content in the soil is attributed to carbonates. Total soil 1995). In contrast, when samples were acidified with 20 C content in the calcareous soil before HCl fumigation mL of 1 M HCl and washed with distilled water, 20% was 32 mg g⫺1 soil and decreased to 8 mg g⫺1 soil after of the C and N was lost. Since those samples were not HCl fumigation. Therefore, 24 mg g⫺1 soil or 75% of the analyzed for isotopic composition, it remains unknown total C content in the soil was in the form of inorganic C. whether the 13 C and 15 N abundances were changed. Mid- It should be pointed out that the HCl-fumigation wood and Boutton (1998) used one of the carbonate- method for determining inorganic C requires two sepa- free soils included in this study (Pophers). When they rate analyses: total organic and inorganic C (untreated treated this soil with 1 M HCl for up to 8 d, followed sample), and organic C (treated sample). As both analy- by washing the soil with distilled water, organic C con- ses contribute experimental error, the calculated amount centration declined significantly but the ␦13 C value of of inorganic C based on the difference between the C the soil was unaffected. in the two analyses may be less accurate than a direct Acid fumigation always increased the ␦15 N value of measurement. However, this point requires further re- the soil but for only one soil (Pardaloe) was the increase search. significant at P ⬍ 0.05 (Table 2). For this soil, there was Finally, it should be mentioned that the HCl-fumiga- also a decrease, albeit not a significant one, in total N tion method does reduce, by about 50%, the number content following HCl fumigation (Table 2). Appar- of samples that can be combusted before the elemental ently, the amount of N lost remained small but its ␦15 N analyzer combustion reactor is exhausted. differed sufficiently to result in an increase in the ␦15 N value of the bulk soil N following fumigation. Lohse et Conclusions al. (2000) observed up to a 50% loss of N in continental Fumigating soil with HCl vapor rather than washing margin sediments following the elimination of carbon- the soil in dilute HCl is an effective method to remove ates by acidification using diluted H2SO4. Fumigation carbonates prior to isotopic analysis. The method does with HCl led to a small but consistent increases in the not alter the ␦13 C signature of organic C and no losses ␦15 N value of soil N and losses of N can occur. Therefore, of organic C occurred. In a soil that contained 75% of some caution is recommended in the use of 15 N measure- total C as carbonates, all carbonates were removed ments from HCl-fumigated soils. Treating soil with di- within a 6-h period of fumigation. A large number of luted HCl followed by washing significantly reduced the samples can be processed simultaneously. However, N concentration for all soils tested, and the ␦15 N value HCl fumigation may lead to a small increase in the ␦15 N increased significantly in three of the four soils (Table value of soil N. 2). Midwood and Boutton (1998) also observed signifi- cant losses in N concentration when the Pophers soil Acknowledgments was treated with HCl. Clearly, when soils are washed We thank Dr. T. Boutton, Texas A&M University, and with HCl, total N concentration can be reduced, and Dr. M. Singer, University of California-Davis, for providing the ␦15 N changed. us with the carbonate-free soil samples. We also thank Chris Exposure to concentrated HCl vapor for 6 h com- Hartley for the statistical analyses. pletely removed carbonates from a soil that contained References high levels of carbonates (Fig. 1). The high ␦13 C value (⫺5‰) of untreated soil reflected a strong presence of Balesdent, J., and A. Mariotti. 1996. Measurement of soil organic matter turnover using 13 C natural abundance. p. 83–112. In T.W. carbonates. The ␦13 C value declined to ⫺27‰ following
- 4. 1856 SOIL SCI. SOC. AM. J., VOL. 65, NOVEMBER–DECEMBER 2001 Boutton and S. Yamasaki (ed.) Mass spectrometry of soils. Marcel Munn, J.R., Jr., and M.J. Singer. 1981. Relative erodibility of Califor- nia benchmark soils. Tech. Rep. USDA–SCS. Land, Air and Water Dekker, New York. Balesdent, J., G.H. Wagner, and A. Mariotti. 1988. Soil organic matter Resources papers 10007, Univ. California-Davis. Nadelhoffer, K.J., and B. Fry. 1988. Controls on natural nitrogen-15 turnover in long-term field experiments as revealed by carbon-13 natural abundance. Soil Sci. Soc. Am. J. 52:118–124. and carbon-13 abundance in forest soil organic matter. Soil Sci. Soc. Am. J. 52:1633–1640. Boutton, T.W. 1991. Stable carbon isotope ratios of natural materials: II. Atmospheric, terrestrial, marine, and freshwater environments. Rochette, P., and L.B. Flanagan. 1997. Quantifying rhizosphere respi- ration in a corn crop under field conditions. Soil Sci. Soc. Am. p. 173–185. In D.C. Coleman and B. Fry (ed.) Carbon isotope techniques. Academic Press, San Diego, CA. J. 61:466–474. SAS Institute. 1989. SAS/STAT user’s guide. Version 6. 4th ed. Vol. Collins, H.P., R.L. Blevins, L.G. Bundy, D.R. Christensen, W.A. Dick, D.R. Huggins, and E.A. Paul. 1999. Soil carbon dynamics in corn- 2. SAS Inst., Cary, NC. Trott, K.E. 1981. The importance of selected soil physical and chemical based agroecosystems: Results from carbon-13 natural abundance. Soil Sci. Soc. Am. J. 63:584–591. properties for the prediction of soil erodibility of several western upland soils. Ph.D. diss. Dept. of Land, Air and Water Resources, Connin, S.L., R.A. Virginia, and C.P. Chamberlain. 1997. Carbon isotopes reveal soil organic matter dynamics following arid land Univ. of California, Davis, CA. Van Kessel, C., R.E. Farrell, and D.J. Pennock. 1994. Carbon-13 and shrub expansion. Oecologia 110:374–386. Hedges, J.L., and J.H. Stern. 1984. Carbon and nitrogen determination nitrogen-15 natural abundance in crop residues and soil organic matter. Soil Sci. Soc. Am. J. 58:382–389. of carbonate-containing solids. Limnol. Oceanogr. 29:657–663. Leavitt, S.W., E.A. Paul, B.A. Kimball, G.R. Hendrey, J.R. Mauney, Van Kessel, C., W.R. Horwath, U. Hartwig, D. Harris, and A. Lüscher. 2000a. Net soil carbon input under ambient and elevated CO2 R. Rauschkolb, H. Rogers, K.F. Lewin, J. Nagy, P.J. Pinter, Jr., and H.B. Johnson. 1994. Carbon isotope dynamics of free-air CO2- concentrations: isotopic evidence after four years. Global Change Biol. 6:435–444. enriched cotton and soils. Agric. For. Meteor. 70:87–101. Lohse, L., R.T. Klooserhuis, H.C. de Stighter, W. Helder, W. van Van Kessel, C., J. Nitschelm, W.R. Horwath, D. Harris, F. Walley, A. Lüscher, and U. Hartwig. 2000b. Carbon-13 input and turn- Raaphorst, and T.C.E. van Weering. 2000. Carbonate removal by acidification causes loss of nitrogenous compounds in continental over in a pasture soil exposed to long-term elevated atmospheric CO2. Global Change Biol. 6:123–135. margin sediments. Mar. Chem. 69:193–201. Midwood, A.J., and T.W. Boutton. 1998. Soil carbonate decomposi- Yamamuro, M., and H. Kayanne. 1995. Rapid direct determination of organic carbon and nitrogen in carbonate-bearing sediments with tion by acid has little effect on the ␦13 C or organic matter. Soil Biol. Biochem. 30:1301–1307. a Yanaco MT-5 CHN analyzer. Limnol. Oceanogr. 40:1001–1005. DIVISION S-10—WETLAND SOILS Heterotrophic Microbial Activity in Northern Everglades Wetland Soils A. L. Wright and K. R. Reddy* ABSTRACT Organic matter degradation plays an important Phosphorus loading to the northern Florida Everglades has been role in nutrient cycling of wetlands. Rates of or- implicated in causing changes in vegetation, peat accretion rates, and ganic matter degradation and CO2 production provide other soil physical-chemical properties. Our study focused on de- an indication of the microbial activity of soils, with pri- termining the influence of P loading on aerobic and anaerobic hetero- mary factors influencing microbial activity being con- trophic microbial activities (measured as CO2 and CH4 production) centrations of utilizable substrates, electron acceptors, in detritus and soil collected from the Water Conservation Area 2a and nutrients such as N and P (Webster and Benfield, (WCA-2a) of the Everglades. Heterotrophic microbial activities mea- sured under both field and laboratory conditions were higher in areas 1986; D’Angelo and Reddy, 1994; Reddy et al., 1999) impacted by P loading as compared to the unimpacted interior marsh. A major limiting factor of microbial growth in short Microbial heterotrophic activities were higher in detritus and surface term studies is the utilization of readily degradable com- soils and decreased with depth. In field studies, CO2 production rates pounds of the dissolved organic carbon (DOC) pool in anaerobic soils were approximately 64% of those observed in aero- (Hoppe, 1983). Short term studies primarily determine bic soils. Additions of substrates containing C, N, and P generally microbial respiration on the basis of the DOC pool. In enhanced heterotrophic microbial activity. In laboratory studies in- long term studies, utilizable portions of the DOC pool are volving addition of various inorganic electron acceptors, increased microbial activities in the order of O⫺ 2 ⬎ NO⫺ 3 ⫽ SO2⫺ 4 ⬎ HCO⫺ 3 were depleted, and heterotrophic microbial activity measure- observed. Microbial CO2 production rates under denitrifying and sul- ments are often based on utilization of large organic com- fate reducing conditions ranged from 30–42% and 29–44%, respec- pounds which must be acted upon by extracellular en- tively, of aerobic rates. Methane production rates were only up to zymes, resulting in lower microbial activity (Chrost, 1991). 9% of aerobic CO2 production rates. Both CO2 and CH4 production Organic matter degradation in wetlands is often lim- rates were significantly correlated with soil P parameters and micro- ited by the availability of electron acceptors rather than bial biomass. Enhanced heterotrophic microbial activities resulting electron donors (Reddy and D’Angelo, 1994; Amador from P loading has the potential to increase turnover of organic and Jones, 1995; McLatchey and Reddy, 1998). Oxygen matter which may lead to increased supply of bioavailable nutrients to emergent macrophytes and periphyton and higher nutrient concen- is the most important electron acceptor in terrestrial trations in the water column. systems, but is usually limited to the upper soil surface and the overlying water column in wetlands. A sequen- tial reduction of electron acceptors with depth in soils gen- Wetland Biogeochmistry Laboratory, University of Florida, 106 New- erally proceeds in the order of O⫺ 2 ⬎ NO⫺ 3 ⬎ SO2⫺ 4 ⬎ ell Hall, P.O. Box 110510, Gainesville, FL 32611. Received 22 Aug. HCO⫺ 3 on the basis of theoretical thermodynamic en- 2000. *Corresponding author (krr@ufl.edu). ergy yields to microorganisms (Billen, 1982; Reddy and D’Angelo, 1994). Thus, degradation rates of DOC in Published in Soil Sci. Soc. Am. J. 65:1856–1864 (2001).