Mekko Graphics New in Our Latest Version
•Descargar como PPTX, PDF•
1 recomendación•3,472 vistas

See some of the things you can do using the latest version of the Mekko Graphics software.

Recomendados
Más contenido relacionado
La actualidad más candente
La actualidad más candente (20)
Destacado
Destacado (9)
Similar a Mekko Graphics New in Our Latest Version
Similar a Mekko Graphics New in Our Latest Version (20)
Más de Mekko Graphics
Más de Mekko Graphics (20)
Último
Último (20)
Mekko Graphics New in Our Latest Version
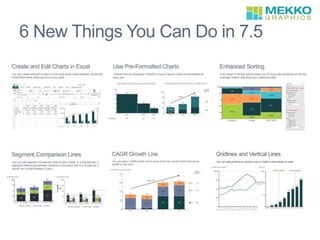
- 1. 6 New Things You Can Do
- 2. Create and Edit Charts in Excel You can create and edit a chart in Excel and move charts between Excel and PowerPoint while retaining links to your data.
- 3. A collection of quick launch charts pre-formatted for easy use. Use Pre-Formatted Charts Bar Mekko with Data Row and Set Bar Width Stacked Bar with Growth Line and CAGR column
- 4. Enhanced Sorting A full range of sorting options allow you to focus your audience on the key message without adjusting your underlying data.
- 5. Segment Comparison Lines You can add segment comparison lines to your charts. In a stacked bar, it highlights differences between locations in the stack and in a cluster bar it shows the change between 2 bars.
- 6. CAGR Growth Line You can add a CAGR growth line to easily show the overall CAGR and series CAGR on the chart. `
- 7. Gridlines and Vertical Lines You can add gridlines or vertical lines to make a chart easier to read.