November 2017 Market Watch
•
0 likes•592 views

Full November 2017 Market Watch compliments of Toronto Real Estate Board.

Recommended
More Related Content
More from Michelle Makos
More from Michelle Makos (20)
Recently uploaded
Recently uploaded (20)
November 2017 Market Watch
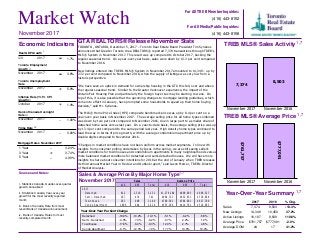
- 1. Toronto Employment Growth November 2017 3.8% Month November 2017 1 Year 3 Year 5 Year 3.24% 3.74% 4.99% November 2017 1 Year 3 Year 5 Year -- -- Market Watch For All TREB Member Inquiries: (416) 443-8158 For All Media/Public Inquiries: (416) 443-8152 GTA REALTORS® Release November Stats TORONTO, ONTARIO, December 5, 2017 – Toronto Real Estate Board President Tim Syrianos announced that Greater Toronto Area REALTORS® reported 7,374 transactions through TREB’s MLS® System in November 2017. This result was up compared to October 2017, bucking the regular seasonal trend. On a year-over-year basis, sales were down by 13.3 per cent compared to November 2016. New listings entered into TREB’s MLS® System in November 2017 amounted to 14,349 – up by 37.2 per cent compared to November 2016, when the supply of listings was very low from a historic perspective. “We have seen an uptick in demand for ownership housing in the GTA this fall, over and above the regular seasonal trend. Similar to the Greater Vancouver experience, the impact of the Ontario Fair Housing Plan and particularly the foreign buyer tax may be starting to wane. On top of this, it is also possible that the upcoming changes to mortgage lending guidelines, which come into effect in January, have prompted some households to speed up their home buying decision,” said Mr. Syrianos. The MLS® Home Price Index (HPI) composite benchmark price was up by 8.4 per cent on a year-over-year basis in November 2017. The average selling price for all home types combined was down by two per cent compared to November 2016, due in large part to a smaller share of detached home sales versus last year. On a year-to-date basis, the average selling price was up by 13.4 per cent compared to the same period last year. High density home types continued to lead the way in terms of price growth, with the average condominium apartment price up by double-digits compared to November 2016. “Changes in market conditions have not been uniform across market segments. In line with insights from consumer polling undertaken by Ipsos in the spring, we are still seeing seller’s market conditions for townhouses and condominium apartments in many neighbourhoods versus more balanced market conditions for detached and semi-detached houses. We will have more insights to share about consumer intentions for 2018 at the end of January when TREB releases its third annual Market Year in Review and Outlook report,” said Jason Mercer, TREB’s Director of Market Analysis. TREB MLS® Sales Activity 7,374 8,503 November 2017 November 2016 TREB MLS® Average Price $761,757 $777,091 November 2017 November 2016 Year-Over-Year Summary 2017 2016 % Chg. Sales New Listings Active Listings Average Price Average DOM 7,374 8,503 -13.3% 14,349 10,456 37.2% 18,197 8,639 110.6% $761,757 $777,091 -2.0% 24 17 41.2% Sources and Notes: i - Statistics Canada, Quarter-over-quarter growth, annualized ii - Statistics Canada, Year-over-year growth for the most recently reported month iii - Bank of Canada, Rate from most recent Bank of Canada announcement iv - Bank of Canada, Rates for most recently completed month Real GDP Growth Q3 2017 1.7% Toronto Unemployment Rate November 2017 5.9% Inflation Rate (Yr./Yr. CPI Growth) October 2017 1.4% Bank of Canada Overnight Rate November 2017 -- 1.00% Prime Rate November 2017 -- 3.20% Economic Indicators Metrics Sales Average Price 416 905 Total 416 905 Total 2017 Detached Semi - Detached Townhouse Condo Apartment 812 2,319 3,131 $1,276,184 $898,605 $996,527 267 474 741 $904,711 $632,631 $730,668 281 908 1,189 $760,501 $586,601 $627,700 1,606 604 2,210 $555,396 $414,782 $516,965 Sales & Average Price By Major Home Type November 2017 November 2017 i ii ii iii iv Detached Semi - Detached Townhouse Condo Apartment -5.1% -6.2% -5.8% -0.7% 2.2% 1.2% 12.3% 2.7% 4.8% 17.7% 10.6% 16.4% Detached Semi - Detached Townhouse Condo Apartment -18.9% -19.2% -19.1% -4.0% -7.4% -6.2% -17.6% -6.4% -9.3% -6.1% -12.3% -7.9% 1,7 1,7 1,7 1,7 Year-Over-Year Per Cent Change Mortgage Rates
- 2. Toronto Real Estate Board Market Watch, November 2017 SALES BY PRICE RANGE AND HOUSE TYPE NOVEMBER 2017 2 Price Range Detached Semi-Detached Att/Row/Twnhouse Condo Townhouse Condo Apt Link Co-op Apt Det Condo Co-ownership Apt Total $0 to $99,999 $100,000 to $199,999 $200,000 to $299,999 $300,000 to $399,999 $400,000 to $499,999 $500,000 to $599,999 $600,000 to $699,999 $700,000 to $799,999 $800,000 to $899,999 $900,000 to $999,999 $1,000,000 to $1,249,999 $1,250,000 to $1,499,999 $1,500,000 to $1,749,999 $1,750,000 to $1,999,999 $2,000,000+ 0 0 0 0 1 0 0 0 0 1 3 0 0 2 14 0 3 0 0 22 8 0 0 24 105 0 2 0 1 140 63 21 8 84 586 1 2 0 1 766 175 49 64 172 662 11 0 0 0 1,133 276 118 169 140 402 22 0 1 0 1,128 443 227 171 66 188 22 0 1 1 1,119 524 150 90 23 90 8 0 1 0 886 377 66 50 19 47 13 0 1 1 574 272 35 34 8 16 6 0 0 0 371 374 37 25 10 39 3 0 1 0 489 251 25 10 3 24 0 0 0 0 313 107 6 4 2 15 0 0 1 0 135 79 1 2 4 8 0 0 0 0 94 179 6 4 1 13 0 0 0 0 203 Price Range Detached Semi-Detached Att/Row/Twnhouse Condo Townhouse Condo Apt Link Co-op Apt Det Condo Co-ownership Apt Total $0 to $99,999 $100,000 to $199,999 $200,000 to $299,999 $300,000 to $399,999 $400,000 to $499,999 $500,000 to $599,999 $600,000 to $699,999 $700,000 to $799,999 $800,000 to $899,999 $900,000 to $999,999 $1,000,000 to $1,249,999 $1,250,000 to $1,499,999 $1,500,000 to $1,749,999 $1,750,000 to $1,999,999 $2,000,000+ 0 0 0 0 28 0 0 0 0 28 30 1 1 25 244 0 18 0 3 322 138 8 2 251 1,584 1 30 0 16 2,030 578 187 118 727 6,914 12 19 1 28 8,584 1,591 421 654 1,664 7,013 161 8 10 6 11,528 2,867 1,031 1,570 1,504 4,058 222 8 15 3 11,278 4,198 2,013 1,896 1,039 2,251 174 2 18 2 11,593 5,028 1,602 1,054 444 1,218 128 6 11 1 9,492 4,914 987 706 223 724 154 3 7 1 7,719 3,740 569 492 120 338 122 5 3 0 5,389 5,652 609 433 131 411 130 3 5 0 7,374 3,906 285 180 60 225 31 3 2 0 4,692 2,353 102 52 31 112 2 1 2 0 2,655 1,366 47 13 15 64 1 0 0 0 1,506 3,059 93 16 13 141 0 1 0 0 3,323 SALES BY PRICE RANGE AND HOUSE TYPE YEAR-TO-DATE, 2017 Total Sales Share of Total Sales Average Price 3,131 741 631 558 2,210 86 7 6 4 7,374 42.5% 10.0% 8.6% 7.6% 30.0% 1.2% 0.1% 0.1% 0.1% 100.0% $996,527 $730,668 $698,436 $547,709 $516,965 $671,406 $239,307 $899,833 $501,250 $761,757 Total Sales Share of Total Sales Average Price 39,420 7,955 7,187 6,247 25,325 1,138 107 74 60 87,513 45.0% 9.1% 8.2% 7.1% 28.9% 1.3% 0.1% 0.1% 0.1% 100.0% $1,104,337 $785,832 $716,267 $566,356 $512,971 $739,920 $456,578 $717,702 $357,283 $827,608 1,7 1,7
- 3. Toronto Real Estate Board Market Watch, November 2017 Number of Sales Dollar Volume Average Price Median Price New Listings SNLR (Trend) Active Listings Mos. Inv. (Trend) Avg. SP / LP Avg. DOM TREB Total Halton Region Burlington Halton Hills Milton Oakville Peel Region Brampton Caledon Mississauga City of Toronto Toronto West Toronto Central Toronto East York Region Aurora E. Gwillimbury Georgina King Markham Newmarket Richmond Hill Vaughan Whitchurch-Stouffville Durham Region Ajax Brock Clarington Oshawa Pickering Scugog Uxbridge Whitby Dufferin County Orangeville Simcoe County Adjala-Tosorontio Bradford West GwillimburyEssa Innisfil New Tecumseth 7,374 $5,617,199,379 761,757 $640,000 14,349 52.6% 18,197 1.8 98% 24 716 $596,897,769 833,656 $717,250 1,285 54.9% 1,796 1.8 97% 28 201 $144,735,850 720,079 $655,000 308 60.7% 454 1.7 97% 33 73 $52,758,600 722,721 $699,000 102 68.3% 126 1.3 98% 26 190 $131,818,037 693,779 $659,950 351 53.7% 369 1.4 98% 21 252 $267,585,282 1,061,846 $847,500 524 49.2% 847 2.2 97% 29 1,554 $1,051,976,834 676,948 $630,000 2,980 51.2% 3,435 1.7 97% 24 718 $471,019,935 656,017 $630,000 1,527 49.0% 1,651 1.7 98% 22 82 $72,131,800 879,656 $790,000 154 47.0% 258 2.8 96% 33 754 $508,825,099 674,834 $605,750 1,299 54.0% 1,526 1.6 98% 25 2,978 $2,389,010,519 802,220 $630,000 4,881 59.8% 5,430 1.5 99% 21 797 $569,100,490 714,053 $635,000 1,294 60.3% 1,496 1.6 100% 24 1,446 $1,316,594,036 910,508 $600,000 2,332 61.3% 2,599 1.5 99% 20 735 $503,315,993 684,784 $679,000 1,255 56.5% 1,335 1.4 100% 20 1,027 $946,538,979 921,654 $820,000 3,070 41.7% 4,756 2.5 97% 28 56 $51,656,088 922,430 $807,000 205 38.8% 333 2.7 97% 34 27 $19,603,000 726,037 $715,000 120 34.2% 233 3.9 97% 30 74 $39,125,090 528,717 $512,500 175 42.4% 282 2.8 97% 33 26 $43,416,000 1,669,846 $1,447,500 76 38.3% 183 4.1 93% 33 263 $246,757,423 938,241 $856,000 746 44.8% 1,057 2.2 98% 26 102 $84,107,693 824,585 $759,000 290 40.5% 418 2.4 97% 28 188 $183,950,548 978,460 $846,000 584 39.9% 928 2.6 96% 26 237 $227,436,250 959,647 $888,000 746 42.9% 1,099 2.4 97% 25 54 $50,486,887 934,942 $789,000 128 41.4% 223 2.8 97% 33 879 $505,337,569 574,901 $550,000 1,632 53.3% 1,780 1.5 98% 23 122 $78,948,535 647,119 $640,250 265 52.9% 268 1.4 99% 21 15 $6,639,400 442,627 $470,000 25 54.1% 50 3.0 98% 19 154 $80,028,872 519,668 $510,000 244 56.1% 277 1.4 98% 23 258 $122,792,101 475,938 $457,000 485 51.3% 488 1.5 99% 21 105 $72,054,060 686,229 $624,000 229 51.2% 253 1.6 97% 21 29 $21,080,029 726,898 $610,000 34 57.7% 66 2.2 97% 42 28 $20,340,000 726,429 $725,000 32 55.4% 79 2.5 97% 46 168 $103,454,572 615,801 $599,500 318 54.5% 299 1.3 98% 22 52 $25,471,619 489,839 $495,950 68 69.3% 90 1.2 98% 26 52 $25,471,619 489,839 $495,950 68 69.3% 90 1.2 98% 26 168 $101,966,090 606,941 $573,500 433 44.6% 910 2.9 97% 36 10 $7,977,000 797,700 $687,000 10 56.6% 51 3.3 96% 51 49 $33,170,300 676,945 $650,000 141 42.1% 236 2.6 97% 29 19 $10,054,400 529,179 $499,900 43 53.8% 89 2.5 96% 45 44 $25,809,200 586,573 $495,000 130 35.3% 308 3.9 96% 38 46 $24,955,190 542,504 $502,000 109 53.6% 226 2.3 98% 35 SUMMARY OF EXISTING HOME TRANSACTIONS ALL HOME TYPES, NOVEMBER 2017 ALL TREB AREAS 3 1 1 1 2 5498 3
- 4. Toronto Real Estate Board Market Watch, November 2017 SUMMARY OF EXISTING HOME TRANSACTIONS ALL HOME TYPES, NOVEMBER 2017 CITY OF TORONTO MUNICIPAL BREAKDOWN 4 Number of Sales Dollar Volume Average Price Median Price New Listings SNLR (Trend) Active Listings Mos. Inv. (Trend) Avg. SP / LP Avg. DOM TREB Total City of Toronto Total Toronto West Toronto W01 Toronto W02 Toronto W03 Toronto W04 Toronto W05 Toronto W06 Toronto W07 Toronto W08 Toronto W09 Toronto W10 Toronto Central Toronto C01 Toronto C02 Toronto C03 Toronto C04 Toronto C06 Toronto C07 Toronto C08 Toronto C09 Toronto C10 Toronto C11 Toronto C12 Toronto C13 Toronto C14 Toronto C15 Toronto East Toronto E01 Toronto E02 Toronto E03 Toronto E04 Toronto E05 Toronto E06 Toronto E07 Toronto E08 Toronto E09 Toronto E10 Toronto E11 7,374 $5,617,199,379 $761,757 $640,000 14,349 52.6% 18,197 1.8 98% 24 2,978 $2,389,010,519 $802,220 $630,000 4,881 59.8% 5,430 1.5 99% 21 797 $569,100,490 $714,053 $635,000 1,294 60.3% 1,496 1.6 100% 24 50 $43,531,630 $870,633 $634,000 69 66.9% 67 1.2 103% 19 78 $75,110,906 $962,960 $950,000 107 64.8% 87 1.1 104% 17 62 $43,484,688 $701,366 $712,500 104 56.2% 91 1.5 101% 23 72 $47,164,400 $655,061 $606,250 136 57.2% 186 1.8 98% 28 109 $61,486,988 $564,101 $615,000 152 55.4% 248 2.1 97% 28 129 $84,556,647 $655,478 $596,500 237 64.4% 252 1.5 100% 21 28 $23,758,600 $848,521 $840,000 52 59.1% 48 1.4 100% 16 160 $135,167,204 $844,795 $555,000 241 62.7% 262 1.4 99% 22 30 $19,128,577 $637,619 $744,000 73 55.6% 94 1.7 99% 29 79 $35,710,850 $452,036 $355,000 123 55.8% 161 2.0 98% 30 1,446 $1,316,594,036 $910,508 $600,000 2,332 61.3% 2,599 1.5 99% 20 494 $333,155,536 $674,404 $557,500 718 67.1% 635 1.2 101% 18 69 $95,796,089 $1,388,349 $1,201,000 104 57.3% 130 2.1 99% 24 49 $82,913,368 $1,692,110 $1,096,000 83 57.4% 80 1.6 97% 17 83 $144,902,000 $1,745,807 $1,550,000 148 54.7% 157 1.7 99% 16 35 $25,090,178 $716,862 $532,800 70 55.1% 81 1.7 97% 30 99 $95,224,487 $961,864 $660,000 215 50.6% 296 2.0 96% 23 171 $113,649,695 $664,618 $551,000 232 68.6% 218 1.2 101% 18 29 $46,401,773 $1,600,061 $959,900 37 62.2% 41 1.7 99% 20 51 $56,609,450 $1,109,989 $779,800 78 65.7% 65 1.1 99% 24 35 $33,926,000 $969,314 $450,000 45 66.2% 55 1.1 98% 21 24 $63,578,750 $2,649,115 $2,079,000 44 47.0% 114 3.0 96% 24 47 $36,522,211 $777,068 $652,000 98 58.8% 128 1.4 97% 22 140 $117,474,715 $839,105 $523,000 226 57.9% 290 1.5 97% 22 120 $71,349,784 $594,582 $471,500 234 58.0% 309 1.6 98% 27 735 $503,315,993 $684,784 $679,000 1,255 56.5% 1,335 1.4 100% 20 81 $72,881,387 $899,770 $880,000 124 64.2% 76 0.9 106% 12 50 $53,667,409 $1,073,348 $959,150 93 62.4% 84 1.1 102% 14 76 $60,469,597 $795,653 $814,000 126 55.2% 113 1.3 101% 13 94 $54,735,851 $582,296 $649,950 167 56.7% 179 1.5 98% 22 64 $41,573,063 $649,579 $623,000 131 53.4% 170 1.6 100% 20 34 $25,552,001 $751,529 $681,500 68 50.1% 63 1.6 97% 19 72 $43,589,887 $605,415 $565,000 122 54.7% 159 1.7 101% 22 39 $25,875,000 $663,462 $660,000 75 58.3% 105 1.5 97% 27 107 $52,657,460 $492,126 $405,000 157 57.4% 161 1.4 98% 27 56 $36,123,388 $645,061 $693,750 101 50.1% 120 1.8 98% 19 62 $36,190,950 $583,725 $578,500 91 58.3% 105 1.5 99% 25 1 1 1 2 8 3 9 4 5
- 5. Toronto Real Estate Board Market Watch, November 2017 SUMMARY OF EXISTING HOME TRANSACTIONS ALL HOME TYPES, YEAR-TO-DATE 2017 ALL TREB AREAS 5 Number of Sales Dollar Volume Average Price Median Price New Listings Avg. SP / LP Avg. DOM TREB Total Halton Region Burlington Halton Hills Milton Oakville Peel Region Brampton Caledon Mississauga City of Toronto Toronto West Toronto Central Toronto East York Region Aurora E. Gwillimbury Georgina King Markham Newmarket Richmond Hill Vaughan Whitchurch-Stouffville Durham Region Ajax Brock Clarington Oshawa Pickering Scugog Uxbridge Whitby Dufferin County Orangeville Simcoe County Adjala-Tosorontio Bradford West GwillimburyEssa Innisfil New Tecumseth 87,513 $72,426,495,901 $827,608 $682,000 172,280 104% 16 8,507 $7,774,691,672 $913,917 $780,000 15,917 102% 18 2,303 $1,835,000,230 $796,787 $726,525 3,874 101% 20 982 $728,518,914 $741,873 $680,000 1,464 102% 17 2,093 $1,559,581,364 $745,142 $700,000 4,020 103% 15 3,129 $3,651,591,164 $1,167,015 $1,020,000 6,559 101% 19 17,884 $12,966,092,279 $725,011 $669,000 36,126 103% 16 8,244 $5,791,482,239 $702,509 $665,000 17,474 102% 15 857 $811,876,290 $947,347 $850,000 1,899 100% 20 8,783 $6,362,733,750 $724,437 $650,000 16,753 103% 16 33,236 $27,904,002,568 $839,572 $639,000 57,399 104% 16 8,675 $6,361,512,281 $733,316 $634,450 14,875 104% 17 16,641 $15,675,558,429 $941,984 $607,000 28,059 104% 16 7,920 $5,866,931,858 $740,774 $711,000 14,465 107% 15 14,199 $15,141,382,016 $1,066,370 $940,000 35,736 104% 17 913 $1,002,902,054 $1,098,469 $989,000 2,457 104% 17 417 $402,593,912 $965,453 $873,000 1,280 105% 19 1,005 $652,307,141 $649,062 $600,000 2,465 103% 18 370 $593,900,068 $1,605,135 $1,427,500 984 99% 28 3,748 $4,023,646,872 $1,073,545 $960,000 8,802 105% 16 1,355 $1,247,761,714 $920,857 $855,000 3,513 106% 16 2,511 $2,956,490,320 $1,177,415 $1,085,000 6,625 105% 16 3,253 $3,580,388,876 $1,100,642 $978,800 7,980 103% 16 627 $681,391,059 $1,086,748 $920,000 1,630 102% 22 10,596 $6,682,538,294 $630,666 $590,000 20,455 105% 15 1,652 $1,129,252,323 $683,567 $656,900 3,246 106% 14 172 $86,535,540 $503,114 $425,000 326 100% 25 1,905 $1,079,453,034 $566,642 $532,000 3,477 105% 14 3,016 $1,592,400,668 $527,984 $500,000 6,029 106% 14 1,220 $907,848,651 $744,138 $687,250 2,453 104% 15 304 $204,322,130 $672,112 $607,500 540 100% 23 307 $260,030,746 $847,006 $765,000 567 101% 25 2,020 $1,422,695,202 $704,305 $660,000 3,817 105% 13 651 $343,763,575 $528,055 $517,000 962 101% 18 651 $343,763,575 $528,055 $517,000 962 101% 18 2,440 $1,614,025,497 $661,486 $595,000 5,685 101% 21 152 $125,842,615 $827,912 $683,750 280 98% 29 630 $506,798,862 $804,443 $744,250 1,594 103% 17 339 $181,007,332 $533,945 $478,000 635 99% 24 641 $396,898,950 $619,187 $560,000 1,869 101% 22 678 $403,477,738 $595,100 $552,250 1,307 100% 21 1 1 1 2 4 5
- 6. Toronto Real Estate Board Market Watch, November 2017 SUMMARY OF EXISTING HOME TRANSACTIONS ALL HOME TYPES, YEAR-TO-DATE 2017 CITY OF TORONTO MUNICIPAL BREAKDOWN 6 Number of Sales Dollar Volume Average Price Median Price New Listings Avg. SP / LP Avg. DOM TREB Total City of Toronto Total Toronto West Toronto W01 Toronto W02 Toronto W03 Toronto W04 Toronto W05 Toronto W06 Toronto W07 Toronto W08 Toronto W09 Toronto W10 Toronto Central Toronto C01 Toronto C02 Toronto C03 Toronto C04 Toronto C06 Toronto C07 Toronto C08 Toronto C09 Toronto C10 Toronto C11 Toronto C12 Toronto C13 Toronto C14 Toronto C15 Toronto East Toronto E01 Toronto E02 Toronto E03 Toronto E04 Toronto E05 Toronto E06 Toronto E07 Toronto E08 Toronto E09 Toronto E10 Toronto E11 87,513 $72,426,495,901 $827,608 $682,000 172,280 104% 16 33,236 $27,904,002,568 $839,572 $639,000 57,399 104% 16 8,675 $6,361,512,281 $733,316 $634,450 14,875 104% 17 574 $495,675,153 $863,546 $620,000 886 104% 16 806 $766,966,831 $951,572 $900,000 1,268 108% 12 611 $438,658,729 $717,936 $720,000 1,111 107% 15 785 $524,229,714 $667,809 $620,000 1,442 104% 19 1,022 $560,972,086 $548,896 $551,250 1,902 102% 22 1,597 $1,008,498,293 $631,495 $535,000 2,575 103% 18 265 $306,775,975 $1,157,645 $1,102,200 463 106% 14 1,741 $1,547,349,956 $888,771 $640,000 2,851 103% 15 434 $306,306,379 $705,775 $705,000 802 104% 17 840 $406,079,165 $483,428 $400,000 1,575 102% 21 16,641 $15,675,558,429 $941,984 $607,000 28,059 104% 16 5,549 $3,686,732,629 $664,396 $550,500 8,513 103% 16 792 $1,159,063,706 $1,463,464 $1,172,500 1,413 102% 22 500 $743,633,439 $1,487,267 $1,032,495 890 104% 16 789 $1,427,709,782 $1,809,518 $1,680,000 1,469 104% 16 365 $325,848,126 $892,735 $555,000 690 106% 17 1,130 $1,048,461,003 $927,842 $620,000 2,347 102% 17 2,092 $1,351,010,706 $645,799 $560,000 3,102 103% 16 277 $572,908,144 $2,068,260 $1,526,000 461 102% 17 653 $656,155,677 $1,004,833 $711,100 1,013 105% 14 425 $395,495,532 $930,578 $488,000 656 104% 14 325 $1,000,648,238 $3,078,918 $2,688,000 731 100% 21 708 $759,737,996 $1,073,076 $699,000 1,264 109% 13 1,586 $1,418,123,739 $894,151 $550,000 2,894 103% 16 1,450 $1,130,029,712 $779,331 $516,650 2,616 105% 16 7,920 $5,866,931,858 $740,774 $711,000 14,465 107% 15 723 $685,376,405 $947,962 $897,000 1,152 111% 10 639 $695,277,362 $1,088,071 $970,000 1,056 106% 12 794 $722,070,798 $909,409 $890,000 1,492 108% 13 991 $625,975,178 $631,660 $675,000 1,806 106% 15 812 $588,350,603 $724,570 $611,750 1,559 108% 15 327 $280,639,089 $858,224 $750,000 669 104% 14 767 $465,307,616 $606,659 $448,000 1,485 106% 16 537 $387,802,569 $722,165 $708,000 955 104% 15 1,067 $596,685,474 $559,218 $510,000 1,914 106% 16 546 $425,201,498 $778,757 $774,500 1,113 105% 17 717 $394,245,266 $549,854 $560,000 1,264 104% 17 1 1 1 2 4 5
- 7. Toronto Real Estate Board Market Watch, November 2017 SUMMARY OF EXISTING HOME TRANSACTIONS DETACHED HOUSES, NOVEMBER 2017 ALL TREB AREAS 7 Sales Dollar Volume Average Price Median Price New Listings Active Listings Avg. SP / LP Avg. DOM TREB Total Halton Region Burlington Halton Hills Milton Oakville Peel Region Brampton Caledon Mississauga City of Toronto Toronto West Toronto Central Toronto East York Region Aurora E. Gwillimbury Georgina King Markham Newmarket Richmond Hill Vaughan Whitchurch-Stouffville Durham Region Ajax Brock Clarington Oshawa Pickering Scugog Uxbridge Whitby Dufferin County Orangeville Simcoe County Adjala-Tosorontio Bradford West GwillimburyEssa Innisfil New Tecumseth 3,131 $3,120,125,714 $996,527 $819,000 7,420 10,600 97% 26 398 $417,969,984 $1,050,176 $860,000 740 1,128 97% 29 110 $95,906,730 $871,879 $767,500 187 302 97% 34 54 $42,696,900 $790,683 $756,250 73 98 98% 28 96 $80,831,850 $841,998 $773,500 171 214 97% 23 138 $198,534,504 $1,438,656 $1,182,500 309 514 96% 30 634 $569,014,839 $897,500 $815,000 1,488 1,931 97% 25 352 $273,250,537 $776,280 $737,750 893 1,027 97% 22 55 $55,096,400 $1,001,753 $845,000 115 221 95% 35 227 $240,667,902 $1,060,211 $926,000 480 683 97% 27 812 $1,036,261,266 $1,276,184 $949,500 1,692 2,143 98% 22 285 $289,581,770 $1,016,076 $860,000 536 667 100% 24 228 $480,868,022 $2,109,070 $1,799,000 526 780 97% 22 299 $265,811,474 $889,002 $790,000 630 696 99% 19 524 $617,492,237 $1,178,420 $1,087,944 1,921 3,202 96% 29 27 $33,739,550 $1,249,613 $1,150,000 123 220 97% 27 21 $16,024,500 $763,071 $790,000 106 210 96% 28 63 $34,195,890 $542,792 $535,000 158 259 97% 35 21 $39,495,500 $1,880,738 $1,600,000 68 172 93% 36 102 $136,935,866 $1,342,508 $1,183,500 388 562 97% 25 60 $56,787,893 $946,465 $859,500 203 311 97% 29 77 $117,566,339 $1,526,836 $1,226,000 347 609 95% 29 117 $144,641,200 $1,236,250 $1,150,000 427 667 97% 28 36 $38,105,499 $1,058,486 $930,000 101 192 97% 33 602 $379,272,479 $630,021 $603,000 1,163 1,361 98% 25 81 $57,545,635 $710,440 $705,000 182 180 98% 21 14 $6,241,600 $445,829 $471,000 25 50 99% 18 113 $63,495,882 $561,910 $547,900 192 237 98% 25 176 $92,298,201 $524,422 $510,000 343 369 99% 23 56 $47,073,160 $840,592 $730,000 142 165 97% 21 29 $21,080,029 $726,898 $610,000 34 66 97% 42 24 $18,516,500 $771,521 $745,000 28 70 98% 45 109 $73,021,472 $669,922 $640,000 217 224 98% 23 27 $15,534,419 $575,349 $573,500 48 65 98% 30 27 $15,534,419 $575,349 $573,500 48 65 98% 30 134 $84,580,490 $631,198 $600,000 368 770 96% 37 10 $7,977,000 $797,700 $687,000 10 51 96% 51 38 $27,014,500 $710,908 $685,000 118 193 96% 30 18 $9,744,400 $541,356 $509,950 37 74 96% 46 37 $22,179,400 $599,443 $515,000 118 276 96% 37 31 $17,665,190 $569,845 $541,000 85 176 97% 37 1 2 3 4 51 1 1
- 8. Toronto Real Estate Board Market Watch, November 2017 SUMMARY OF EXISTING HOME TRANSACTIONS DETACHED HOUSES, NOVEMBER 2017 CITY OF TORONTO MUNICIPAL BREAKDOWN 8 Sales Dollar Volume Average Price Median Price New Listings Active Listings Avg. SP / LP Avg. DOM TREB Total City of Toronto Total Toronto West Toronto W01 Toronto W02 Toronto W03 Toronto W04 Toronto W05 Toronto W06 Toronto W07 Toronto W08 Toronto W09 Toronto W10 Toronto Central Toronto C01 Toronto C02 Toronto C03 Toronto C04 Toronto C06 Toronto C07 Toronto C08 Toronto C09 Toronto C10 Toronto C11 Toronto C12 Toronto C13 Toronto C14 Toronto C15 Toronto East Toronto E01 Toronto E02 Toronto E03 Toronto E04 Toronto E05 Toronto E06 Toronto E07 Toronto E08 Toronto E09 Toronto E10 Toronto E11 3,131 $3,120,125,714 $996,527 $819,000 7,420 10,600 97% 26 812 $1,036,261,266 $1,276,184 $949,500 1,692 2,143 98% 22 285 $289,581,770 $1,016,076 $860,000 536 667 100% 24 12 $17,063,330 $1,421,944 $1,269,500 18 21 106% 22 33 $39,685,849 $1,202,601 $1,256,500 38 34 104% 23 33 $25,542,688 $774,021 $740,000 58 54 99% 28 35 $28,681,400 $819,469 $720,000 69 105 98% 22 24 $19,201,500 $800,063 $787,500 41 80 95% 36 30 $27,420,510 $914,017 $842,500 77 80 98% 17 14 $15,209,400 $1,086,386 $1,100,000 36 32 101% 17 61 $84,118,716 $1,378,995 $1,060,000 104 139 99% 25 15 $13,303,077 $886,872 $850,000 46 58 100% 27 28 $19,355,300 $691,261 $665,000 49 64 98% 20 228 $480,868,022 $2,109,070 $1,799,000 526 780 97% 22 4 $6,391,000 $1,597,750 $1,550,000 9 10 107% 19 9 $18,981,089 $2,109,010 $1,950,000 13 13 97% 23 27 $62,838,000 $2,327,333 $1,425,000 50 51 96% 15 52 $114,617,000 $2,204,173 $1,925,000 99 119 98% 17 10 $12,936,878 $1,293,688 $1,111,944 42 56 95% 45 36 $57,926,388 $1,609,066 $1,517,500 88 130 95% 25 1 $2,365,000 $2,365,000 $2,365,000 1 1 91% 14 6 $21,230,224 $3,538,371 $2,427,612 14 24 99% 19 16 $29,702,500 $1,856,406 $1,826,500 18 15 101% 19 8 $18,755,000 $2,344,375 $2,317,500 10 22 97% 16 14 $52,207,750 $3,729,125 $3,021,875 23 91 96% 27 14 $18,794,500 $1,342,464 $1,267,500 43 65 95% 15 23 $51,424,693 $2,235,856 $2,228,000 69 111 95% 24 8 $12,698,000 $1,587,250 $1,599,000 47 72 94% 52 299 $265,811,474 $889,002 $790,000 630 696 99% 19 15 $16,540,000 $1,102,667 $1,100,000 24 14 106% 13 20 $29,150,309 $1,457,515 $1,230,155 37 41 99% 13 40 $36,537,197 $913,430 $881,000 86 87 100% 14 43 $33,427,225 $777,377 $740,800 108 106 98% 19 26 $23,384,888 $899,419 $892,500 53 62 101% 16 24 $19,750,001 $822,917 $724,500 61 58 97% 19 22 $20,042,400 $911,018 $832,000 44 60 102% 23 19 $17,688,500 $930,974 $745,000 41 55 97% 23 38 $27,149,154 $714,451 $709,000 74 82 99% 24 31 $25,462,800 $821,381 $774,000 69 91 97% 20 21 $16,679,000 $794,238 $799,500 33 40 98% 24 1 1 1 1 2 3 4 5
- 9. Toronto Real Estate Board Market Watch, November 2017 SUMMARY OF EXISTING HOME TRANSACTIONS SEMI-DETACHED HOUSES, NOVEMBER 2017 ALL TREB AREAS 9 Sales Dollar Volume Average Price Median Price New Listings Active Listings Avg. SP / LP Avg. DOM TREB Total Halton Region Burlington Halton Hills Milton Oakville Peel Region Brampton Caledon Mississauga City of Toronto Toronto West Toronto Central Toronto East York Region Aurora E. Gwillimbury Georgina King Markham Newmarket Richmond Hill Vaughan Whitchurch-Stouffville Durham Region Ajax Brock Clarington Oshawa Pickering Scugog Uxbridge Whitby Dufferin County Orangeville Simcoe County Adjala-Tosorontio Bradford West GwillimburyEssa Innisfil New Tecumseth 741 $541,425,103 $730,668 $680,000 1,308 1,308 100% 20 39 $24,483,098 $627,772 $639,900 98 109 98% 24 10 $5,551,000 $555,100 $549,950 16 24 98% 36 2 $1,256,900 $628,450 $628,450 1 1 100% 38 19 $11,922,900 $627,521 $639,900 52 50 98% 20 8 $5,752,298 $719,037 $708,749 29 34 99% 16 277 $176,982,884 $638,927 $640,000 455 423 98% 21 158 $96,490,423 $610,699 $611,500 264 242 98% 19 10 $6,422,300 $642,230 $646,900 17 11 99% 19 109 $74,070,161 $679,543 $680,000 174 170 99% 24 267 $241,557,821 $904,711 $810,000 419 393 103% 20 97 $74,838,400 $771,530 $705,000 139 157 101% 27 64 $77,129,120 $1,205,143 $1,133,750 119 122 102% 19 106 $89,590,301 $845,192 $818,500 161 114 105% 13 86 $65,219,100 $758,362 $755,000 217 268 98% 22 5 $3,758,500 $751,700 $750,000 18 23 96% 11 2 $1,322,000 $661,000 $661,000 3 8 98% 34 2 $961,000 $480,500 $480,500 2 2 96% 12 0 - - - 0 0 - - 19 $15,786,300 $830,858 $820,000 59 68 98% 22 24 $15,568,300 $648,679 $678,000 49 52 97% 28 6 $4,960,000 $826,667 $754,000 27 34 99% 27 23 $19,142,000 $832,261 $827,000 54 74 98% 16 5 $3,721,000 $744,200 $755,000 5 7 100% 24 57 $26,223,000 $460,053 $435,000 98 79 100% 13 11 $6,223,000 $565,727 $575,000 25 26 100% 19 0 - - - 0 0 - - 3 $1,170,000 $390,000 $370,000 4 6 97% 16 32 $12,896,300 $403,009 $399,000 52 32 100% 9 6 $3,595,000 $599,167 $611,500 11 10 99% 16 0 - - - 0 0 - - 1 $300,000 $300,000 $300,000 0 0 95% 46 4 $2,038,700 $509,675 $511,450 6 5 99% 14 8 $3,382,400 $422,800 $422,750 7 6 98% 20 8 $3,382,400 $422,800 $422,750 7 6 98% 20 7 $3,576,800 $510,971 $489,000 14 30 97% 40 0 - - - 0 0 - - 5 $2,791,800 $558,360 $579,900 8 18 98% 40 1 $310,000 $310,000 $310,000 0 1 95% 33 1 $475,000 $475,000 $475,000 1 1 95% 49 0 - - - 5 10 - - 1 1 1 1 2 3 4 5
- 10. Toronto Real Estate Board Market Watch, November 2017 SUMMARY OF EXISTING HOME TRANSACTIONS SEMI-DETACHED HOUSES, NOVEMBER 2017 CITY OF TORONTO MUNICIPAL BREAKDOWN 10 Sales Dollar Volume Average Price Median Price New Listings Active Listings Avg. SP / LP Avg. DOM TREB Total City of Toronto Total Toronto West Toronto W01 Toronto W02 Toronto W03 Toronto W04 Toronto W05 Toronto W06 Toronto W07 Toronto W08 Toronto W09 Toronto W10 Toronto Central Toronto C01 Toronto C02 Toronto C03 Toronto C04 Toronto C06 Toronto C07 Toronto C08 Toronto C09 Toronto C10 Toronto C11 Toronto C12 Toronto C13 Toronto C14 Toronto C15 Toronto East Toronto E01 Toronto E02 Toronto E03 Toronto E04 Toronto E05 Toronto E06 Toronto E07 Toronto E08 Toronto E09 Toronto E10 Toronto E11 741 $541,425,103 $730,668 $680,000 1,308 1,308 100% 20 267 $241,557,821 $904,711 $810,000 419 393 103% 20 97 $74,838,400 $771,530 $705,000 139 157 101% 27 2 $2,555,000 $1,277,500 $1,277,500 7 7 114% 12 20 $19,767,000 $988,350 $930,000 29 21 103% 16 19 $13,540,500 $712,658 $700,000 30 24 103% 18 8 $6,180,000 $772,500 $731,500 8 12 100% 64 35 $23,082,500 $659,500 $670,000 46 74 97% 30 5 $4,485,500 $897,100 $904,500 9 8 108% 8 2 $1,290,000 $645,000 $645,000 2 1 98% 21 3 $2,247,900 $749,300 $747,900 2 3 97% 47 1 $530,000 $530,000 $530,000 4 5 98% 19 2 $1,160,000 $580,000 $580,000 2 2 97% 76 64 $77,129,120 $1,205,143 $1,133,750 119 122 102% 19 14 $18,437,520 $1,316,966 $1,290,000 28 20 104% 9 13 $18,600,500 $1,430,808 $1,250,000 17 14 102% 14 7 $6,692,000 $956,000 $802,000 11 7 108% 13 2 $2,661,000 $1,330,500 $1,330,500 9 4 106% 4 0 - - - 2 3 - - 3 $2,645,000 $881,667 $810,000 7 10 95% 31 3 $3,345,000 $1,115,000 $990,000 9 10 112% 1 2 $4,600,000 $2,300,000 $2,300,000 1 1 92% 35 3 $3,500,300 $1,166,767 $1,117,500 5 5 98% 9 4 $5,305,000 $1,326,250 $1,347,500 4 1 103% 9 0 - - - 0 0 - - 3 $2,640,000 $880,000 $730,000 3 12 97% 72 0 - - - 0 0 - - 10 $8,702,800 $870,280 $842,900 23 35 98% 38 106 $89,590,301 $845,192 $818,500 161 114 105% 13 30 $29,748,287 $991,610 $1,002,000 48 28 109% 8 20 $18,136,300 $906,815 $889,000 40 25 108% 9 20 $17,732,000 $886,600 $849,500 25 17 103% 12 6 $3,965,626 $660,938 $645,000 3 1 101% 18 3 $2,223,000 $741,000 $710,000 6 11 100% 11 5 $3,195,000 $639,000 $655,000 4 2 98% 12 10 $7,247,300 $724,730 $728,650 15 13 98% 25 0 - - - 2 1 - - 0 - - - 3 4 - - 4 $2,424,888 $606,222 $602,500 5 2 104% 16 8 $4,917,900 $614,738 $609,000 10 10 100% 27 1 1 1 1 2 3 4 5
- 11. Toronto Real Estate Board Market Watch, November 2017 SUMMARY OF EXISTING HOME TRANSACTIONS CONDOMINIUM TOWNHOUSES, NOVEMBER 2017 ALL TREB AREAS 11 Sales Dollar Volume Average Price Median Price New Listings Active Listings Avg. SP / LP Avg. DOM TREB Total Halton Region Burlington Halton Hills Milton Oakville Peel Region Brampton Caledon Mississauga City of Toronto Toronto West Toronto Central Toronto East York Region Aurora E. Gwillimbury Georgina King Markham Newmarket Richmond Hill Vaughan Whitchurch-Stouffville Durham Region Ajax Brock Clarington Oshawa Pickering Scugog Uxbridge Whitby Dufferin County Orangeville Simcoe County Adjala-Tosorontio Bradford West GwillimburyEssa Innisfil New Tecumseth 558 $305,621,839 $547,709 $498,000 891 1,028 99% 26 67 $35,213,877 $525,580 $485,000 97 120 98% 30 28 $16,114,700 $575,525 $503,250 35 41 98% 30 7 $3,085,400 $440,771 $442,500 9 8 99% 20 10 $4,580,387 $458,039 $452,750 14 12 99% 25 22 $11,433,390 $519,700 $485,000 39 59 98% 36 191 $98,477,026 $515,587 $517,000 313 341 98% 24 49 $21,748,000 $443,837 $420,000 90 105 98% 28 0 - - - 1 0 - - 142 $76,729,026 $540,345 $540,000 222 236 98% 23 184 $116,419,148 $632,713 $533,250 294 342 99% 25 61 $30,072,688 $492,995 $447,500 74 96 99% 24 63 $55,037,310 $873,608 $675,000 110 124 99% 24 60 $31,309,150 $521,819 $500,000 110 122 99% 26 50 $31,382,288 $627,646 $587,500 97 134 98% 26 7 $3,202,000 $457,429 $400,000 12 26 96% 47 0 - - - 0 0 - - 0 - - - 1 1 - - 0 - - - 0 0 - - 22 $15,228,388 $692,199 $647,500 37 40 99% 26 2 $1,155,000 $577,500 $577,500 9 15 97% 40 9 $5,205,400 $578,378 $576,500 17 17 100% 19 10 $6,591,500 $659,150 $606,250 21 34 97% 17 0 - - - 0 1 - - 62 $22,840,000 $368,387 $390,000 82 79 99% 25 4 $1,784,000 $446,000 $435,000 12 14 101% 23 0 - - - 0 0 - - 3 $1,071,000 $357,000 $348,000 4 2 98% 20 30 $9,400,100 $313,337 $310,000 24 13 99% 26 16 $6,851,000 $428,188 $426,500 21 30 98% 25 0 - - - 0 0 - - 2 $950,000 $475,000 $475,000 1 5 92% 44 7 $2,783,900 $397,700 $399,000 20 15 99% 20 3 $929,000 $309,667 $307,000 2 3 99% 33 3 $929,000 $309,667 $307,000 2 3 99% 33 1 $360,500 $360,500 $360,500 6 9 98% 25 0 - - - 0 0 - - 0 - - - 4 3 - - 0 - - - 0 0 - - 0 - - - 0 1 - - 1 $360,500 $360,500 $360,500 2 5 98% 25 1 1 1 1 2 3 4 5
- 12. Toronto Real Estate Board Market Watch, November 2017 SUMMARY OF EXISTING HOME TRANSACTIONS CONDOMINIUM TOWNHOUSES, NOVEMBER 2017 CITY OF TORONTO MUNICIPAL BREAKDOWN 12 Sales Dollar Volume Average Price Median Price New Listings Active Listings Avg. SP / LP Avg. DOM TREB Total City of Toronto Total Toronto West Toronto W01 Toronto W02 Toronto W03 Toronto W04 Toronto W05 Toronto W06 Toronto W07 Toronto W08 Toronto W09 Toronto W10 Toronto Central Toronto C01 Toronto C02 Toronto C03 Toronto C04 Toronto C06 Toronto C07 Toronto C08 Toronto C09 Toronto C10 Toronto C11 Toronto C12 Toronto C13 Toronto C14 Toronto C15 Toronto East Toronto E01 Toronto E02 Toronto E03 Toronto E04 Toronto E05 Toronto E06 Toronto E07 Toronto E08 Toronto E09 Toronto E10 Toronto E11 558 $305,621,839 $547,709 $498,000 891 1,028 99% 26 184 $116,419,148 $632,713 $533,250 294 342 99% 25 61 $30,072,688 $492,995 $447,500 74 96 99% 24 2 $1,140,000 $570,000 $570,000 1 1 102% 13 5 $3,204,500 $640,900 $670,000 10 11 99% 6 0 - - - 4 4 - - 4 $1,827,500 $456,875 $455,500 8 15 98% 22 25 $9,903,288 $396,132 $395,000 25 37 99% 24 10 $6,548,500 $654,850 $654,000 10 8 99% 24 0 - - - 0 0 - - 3 $1,942,500 $647,500 $550,000 6 9 101% 32 4 $2,611,500 $652,875 $574,500 4 3 96% 19 8 $2,894,900 $361,863 $347,000 6 8 99% 43 63 $55,037,310 $873,608 $675,000 110 124 99% 24 19 $19,184,022 $1,009,685 $725,000 27 18 99% 20 1 $1,300,000 $1,300,000 $1,300,000 2 4 93% 44 0 - - - 0 0 - - 0 - - - 1 1 - - 1 $615,000 $615,000 $615,000 1 1 96% 11 7 $3,937,000 $562,429 $560,000 11 13 96% 24 4 $3,786,000 $946,500 $708,000 12 18 100% 23 1 $1,165,000 $1,165,000 $1,165,000 1 1 96% 47 0 - - - 3 5 - - 2 $1,255,000 $627,500 $627,500 7 7 105% 6 7 $9,373,000 $1,339,000 $1,390,000 10 12 100% 21 2 $1,727,000 $863,500 $863,500 4 2 97% 25 6 $4,471,400 $745,233 $630,500 6 9 96% 26 13 $8,223,888 $632,607 $632,888 25 33 99% 33 60 $31,309,150 $521,819 $500,000 110 122 99% 26 4 $3,959,500 $989,875 $1,072,500 14 16 97% 25 2 $1,667,000 $833,500 $833,500 5 9 95% 14 0 - - - 0 1 - - 9 $4,570,000 $507,778 $510,000 7 6 101% 21 12 $6,062,500 $505,208 $520,500 23 25 98% 26 0 - - - 0 0 - - 4 $2,212,000 $553,000 $565,000 6 8 101% 23 1 $600,000 $600,000 $600,000 5 8 100% 25 3 $1,075,000 $358,333 $340,000 14 13 97% 64 10 $4,135,300 $413,530 $419,750 18 16 98% 23 15 $7,027,850 $468,523 $462,000 18 20 100% 27 1 1 1 1 2 3 4 5
- 13. Toronto Real Estate Board Market Watch, November 2017 SUMMARY OF EXISTING HOME TRANSACTIONS CONDOMINIUM APARTMENT, NOVEMBER 2017 ALL TREB AREAS 13 Sales Dollar Volume Average Price Median Price New Listings Active Listings Avg. SP / LP Avg. DOM TREB Total Halton Region Burlington Halton Hills Milton Oakville Peel Region Brampton Caledon Mississauga City of Toronto Toronto West Toronto Central Toronto East York Region Aurora E. Gwillimbury Georgina King Markham Newmarket Richmond Hill Vaughan Whitchurch-Stouffville Durham Region Ajax Brock Clarington Oshawa Pickering Scugog Uxbridge Whitby Dufferin County Orangeville Simcoe County Adjala-Tosorontio Bradford West GwillimburyEssa Innisfil New Tecumseth 2,210 $1,142,493,570 $516,965 $450,000 3,243 3,618 99% 23 87 $38,600,790 $443,687 $408,500 116 177 97% 29 31 $14,122,500 $455,565 $412,000 39 48 97% 36 1 $375,000 $375,000 $375,000 2 5 97% 12 23 $9,385,900 $408,083 $413,000 24 25 98% 22 32 $14,717,390 $459,918 $408,250 51 99 97% 28 298 $115,082,374 $386,182 $370,000 443 465 98% 25 51 $17,565,400 $344,420 $340,000 71 83 98% 23 0 - - - 0 0 - - 247 $97,516,974 $394,806 $375,000 372 382 98% 26 1,606 $891,965,415 $555,396 $485,000 2,277 2,355 99% 21 331 $155,692,432 $470,370 $436,000 491 517 99% 22 1,040 $643,700,915 $618,943 $529,000 1,500 1,509 100% 20 235 $92,572,068 $393,924 $362,500 286 329 99% 23 178 $82,689,391 $464,547 $435,000 331 514 98% 30 4 $1,707,500 $426,875 $379,250 7 12 98% 76 0 - - - 0 0 - - 2 $573,000 $286,500 $286,500 2 3 96% 28 1 $725,000 $725,000 $725,000 3 4 100% 32 60 $27,846,691 $464,112 $436,500 112 199 98% 31 2 $1,086,000 $543,000 $543,000 2 4 98% 38 62 $26,637,500 $429,637 $408,000 95 130 99% 25 47 $24,113,700 $513,057 $507,000 107 153 97% 31 0 - - - 3 9 - - 34 $12,223,700 $359,521 $353,750 71 86 98% 23 5 $1,801,500 $360,300 $365,000 4 9 99% 20 0 - - - 0 0 - - 9 $2,865,800 $318,422 $305,000 9 11 99% 33 6 $1,544,500 $257,417 $260,750 29 40 97% 20 7 $2,917,900 $416,843 $401,000 19 16 98% 14 0 - - - 0 0 - - 0 - - - 1 1 - - 7 $3,094,000 $442,000 $467,000 9 9 99% 23 4 $923,900 $230,975 $239,000 3 7 97% 21 4 $923,900 $230,975 $239,000 3 7 97% 21 3 $1,008,000 $336,000 $332,000 2 14 99% 30 0 - - - 0 0 - - 0 - - - 0 3 - - 0 - - - 0 0 - - 0 - - - 0 9 - - 3 $1,008,000 $336,000 $332,000 2 2 99% 30 1 1 1 1 2 3 4 5
- 14. Toronto Real Estate Board Market Watch, November 2017 SUMMARY OF EXISTING HOME TRANSACTIONS CONDOMINIUM APARTMENT, NOVEMBER 2017 CITY OF TORONTO MUNICIPAL BREAKDOWN 14 Sales Dollar Volume Average Price Median Price New Listings Active Listings Avg. SP / LP Avg. DOM TREB Total City of Toronto Total Toronto West Toronto W01 Toronto W02 Toronto W03 Toronto W04 Toronto W05 Toronto W06 Toronto W07 Toronto W08 Toronto W09 Toronto W10 Toronto Central Toronto C01 Toronto C02 Toronto C03 Toronto C04 Toronto C06 Toronto C07 Toronto C08 Toronto C09 Toronto C10 Toronto C11 Toronto C12 Toronto C13 Toronto C14 Toronto C15 Toronto East Toronto E01 Toronto E02 Toronto E03 Toronto E04 Toronto E05 Toronto E06 Toronto E07 Toronto E08 Toronto E09 Toronto E10 Toronto E11 2,210 $1,142,493,570 $516,965 $450,000 3,243 3,618 99% 23 1,606 $891,965,415 $555,396 $485,000 2,277 2,355 99% 21 331 $155,692,432 $470,370 $436,000 491 517 99% 22 32 $20,943,300 $654,478 $570,000 42 35 100% 18 18 $9,863,557 $547,975 $527,000 30 20 100% 11 9 $3,881,500 $431,278 $425,000 9 5 101% 14 24 $9,825,500 $409,396 $400,750 50 52 96% 28 21 $7,395,700 $352,176 $395,000 28 43 100% 22 78 $40,711,737 $521,945 $480,000 127 142 100% 23 9 $4,466,200 $496,244 $455,000 7 8 101% 14 90 $43,950,288 $488,337 $437,000 120 105 100% 19 9 $2,354,000 $261,556 $237,000 15 24 96% 38 41 $12,300,650 $300,016 $325,000 63 83 97% 31 1,040 $643,700,915 $618,943 $529,000 1,500 1,509 100% 20 440 $270,677,974 $615,177 $542,500 630 574 100% 18 40 $46,360,000 $1,159,000 $866,500 66 95 99% 28 12 $10,480,118 $873,343 $795,500 17 18 100% 21 25 $23,703,200 $948,128 $699,000 35 31 98% 16 23 $10,612,300 $461,404 $432,000 24 21 99% 26 50 $28,048,100 $560,962 $529,500 105 138 98% 21 156 $96,677,495 $619,728 $547,444 197 178 100% 19 16 $13,159,049 $822,441 $810,500 13 10 102% 21 32 $23,406,650 $731,458 $577,000 51 38 97% 28 20 $7,901,000 $395,050 $376,250 23 24 97% 28 3 $1,998,000 $666,000 $605,000 11 11 100% 15 27 $12,670,711 $469,286 $421,000 44 42 99% 20 107 $56,281,222 $525,993 $485,000 146 164 98% 22 89 $41,725,096 $468,821 $431,000 138 165 99% 22 235 $92,572,068 $393,924 $362,500 286 329 99% 23 23 $14,482,100 $629,657 $568,500 26 8 101% 13 7 $3,925,000 $560,714 $550,000 7 6 99% 32 16 $6,200,400 $387,525 $324,250 13 7 102% 13 32 $10,378,100 $324,316 $320,000 41 58 97% 27 20 $7,887,675 $394,384 $371,250 40 60 98% 23 5 $2,607,000 $521,400 $525,000 3 3 100% 25 34 $12,754,387 $375,129 $396,000 51 70 99% 20 16 $5,550,500 $346,906 $343,500 21 32 99% 29 66 $24,433,306 $370,202 $360,000 65 61 98% 27 6 $1,523,400 $253,900 $269,700 4 6 99% 18 10 $2,830,200 $283,020 $280,000 15 18 98% 23 1 1 1 1 2 3 4 5
- 15. Toronto Real Estate Board Market Watch, November 2017 SUMMARY OF EXISTING HOME TRANSACTIONS LINK, NOVEMBER 2017 ALL TREB AREAS 15 Sales Dollar Volume Average Price Median Price New Listings Active Listings Avg. SP / LP Avg. DOM TREB Total Halton Region Burlington Halton Hills Milton Oakville Peel Region Brampton Caledon Mississauga City of Toronto Toronto West Toronto Central Toronto East York Region Aurora E. Gwillimbury Georgina King Markham Newmarket Richmond Hill Vaughan Whitchurch-Stouffville Durham Region Ajax Brock Clarington Oshawa Pickering Scugog Uxbridge Whitby Dufferin County Orangeville Simcoe County Adjala-Tosorontio Bradford West GwillimburyEssa Innisfil New Tecumseth 86 $57,740,874 $671,406 $627,500 162 211 99% 21 9 $6,131,000 $681,222 $655,000 5 4 97% 20 3 $1,798,000 $599,333 $615,000 1 0 97% 21 1 $658,000 $658,000 $658,000 1 0 100% 7 0 - - - 0 1 - - 5 $3,675,000 $735,000 $755,000 3 3 97% 22 11 $6,719,286 $610,844 $606,500 16 22 98% 20 8 $4,737,000 $592,125 $583,000 11 12 98% 18 1 $615,000 $615,000 $615,000 1 2 98% 28 2 $1,367,286 $683,643 $683,643 4 8 98% 25 1 $530,000 $530,000 $530,000 12 21 92% 34 0 - - - 2 1 - - 0 - - - 1 5 - - 1 $530,000 $530,000 $530,000 9 15 92% 34 30 $25,517,188 $850,573 $840,000 88 114 99% 25 0 - - - 1 1 - - 0 - - - 0 0 - - 0 - - - 2 2 - - 1 $757,500 $757,500 $757,500 1 1 98% 24 22 $19,282,188 $876,463 $851,250 56 71 100% 26 2 $1,135,500 $567,750 $567,750 2 0 100% 11 2 $1,664,000 $832,000 $832,000 11 20 99% 19 3 $2,678,000 $892,667 $850,000 14 18 97% 29 0 - - - 1 1 - - 30 $16,140,400 $538,013 $544,000 31 24 99% 18 1 $635,000 $635,000 $635,000 0 1 98% 26 0 - - - 0 0 - - 11 $5,035,900 $457,809 $434,000 15 9 101% 10 2 $1,016,000 $508,000 $508,000 6 5 97% 13 4 $2,396,500 $599,125 $603,250 2 2 98% 19 0 - - - 0 0 - - 0 - - - 1 1 - - 12 $7,057,000 $588,083 $598,000 7 6 99% 26 0 - - - 0 0 - - 0 - - - 0 0 - - 5 $2,703,000 $540,600 $527,000 10 26 98% 15 0 - - - 0 0 - - 4 $2,226,000 $556,500 $561,500 5 13 99% 13 0 - - - 1 6 - - 0 - - - 1 1 - - 1 $477,000 $477,000 $477,000 3 6 95% 24 1 1 1 1 2 3 4 5
- 16. Toronto Real Estate Board Market Watch, November 2017 SUMMARY OF EXISTING HOME TRANSACTIONS LINK, NOVEMBER 2017 CITY OF TORONTO MUNICIPAL BREAKDOWN 16 Sales Dollar Volume Average Price Median Price New Listings Active Listings Avg. SP / LP Avg. DOM TREB Total City of Toronto Total Toronto West Toronto W01 Toronto W02 Toronto W03 Toronto W04 Toronto W05 Toronto W06 Toronto W07 Toronto W08 Toronto W09 Toronto W10 Toronto Central Toronto C01 Toronto C02 Toronto C03 Toronto C04 Toronto C06 Toronto C07 Toronto C08 Toronto C09 Toronto C10 Toronto C11 Toronto C12 Toronto C13 Toronto C14 Toronto C15 Toronto East Toronto E01 Toronto E02 Toronto E03 Toronto E04 Toronto E05 Toronto E06 Toronto E07 Toronto E08 Toronto E09 Toronto E10 Toronto E11 86 $57,740,874 $671,406 $627,500 162 211 99% 21 1 $530,000 $530,000 $530,000 12 21 92% 34 0 - - - 2 1 - - 0 - - - 0 0 - - 0 - - - 0 0 - - 0 - - - 0 0 - - 0 - - - 0 0 - - 0 - - - 0 0 - - 0 - - - 0 0 - - 0 - - - 0 0 - - 0 - - - 2 1 - - 0 - - - 0 0 - - 0 - - - 0 0 - - 0 - - - 1 5 - - 0 - - - 0 0 - - 0 - - - 0 0 - - 0 - - - 0 0 - - 0 - - - 0 0 - - 0 - - - 0 0 - - 0 - - - 0 1 - - 0 - - - 0 0 - - 0 - - - 0 0 - - 0 - - - 0 0 - - 0 - - - 0 0 - - 0 - - - 0 0 - - 0 - - - 0 0 - - 0 - - - 0 0 - - 0 - - - 1 4 - - 1 $530,000 $530,000 $530,000 9 15 92% 34 0 - - - 0 0 - - 0 - - - 0 0 - - 0 - - - 0 0 - - 0 - - - 0 0 - - 0 - - - 4 7 - - 0 - - - 0 0 - - 0 - - - 4 6 - - 0 - - - 1 1 - - 0 - - - 0 0 - - 0 - - - 0 0 - - 1 $530,000 $530,000 $530,000 0 1 92% 34 1 1 1 1 2 3 4 5
- 17. Toronto Real Estate Board Market Watch, November 2017 SUMMARY OF EXISTING HOME TRANSACTIONS ATTACHED/ROW/TOWNHOUSE, NOVEMBER 2017 ALL TREB AREAS 17 Sales Dollar Volume Average Price Median Price New Listings Active Listings Avg. SP / LP Avg. DOM TREB Total Halton Region Burlington Halton Hills Milton Oakville Peel Region Brampton Caledon Mississauga City of Toronto Toronto West Toronto Central Toronto East York Region Aurora E. Gwillimbury Georgina King Markham Newmarket Richmond Hill Vaughan Whitchurch-Stouffville Durham Region Ajax Brock Clarington Oshawa Pickering Scugog Uxbridge Whitby Dufferin County Orangeville Simcoe County Adjala-Tosorontio Bradford West GwillimburyEssa Innisfil New Tecumseth 631 $440,713,129 $698,436 $635,000 1,291 1,385 99% 21 114 $73,687,020 $646,377 $625,000 229 257 98% 22 17 $10,430,920 $613,584 $610,000 30 38 99% 28 8 $4,686,400 $585,800 $588,500 16 14 100% 15 42 $25,097,000 $597,548 $602,550 90 67 99% 16 47 $33,472,700 $712,185 $730,000 93 138 97% 26 142 $85,140,425 $599,580 $599,500 259 247 98% 23 100 $57,228,575 $572,286 $575,000 197 181 99% 21 16 $9,998,100 $624,881 $632,500 19 22 97% 32 26 $17,913,750 $688,990 $676,500 43 44 98% 21 97 $97,281,719 $1,002,904 $854,200 162 151 102% 16 21 $18,458,200 $878,962 $895,000 45 49 100% 23 44 $55,750,419 $1,267,055 $1,087,500 61 46 102% 11 32 $23,073,100 $721,034 $673,400 56 56 102% 19 158 $123,125,775 $779,277 $765,000 416 523 98% 24 13 $9,248,538 $711,426 $703,000 44 51 100% 35 4 $2,256,500 $564,125 $543,750 11 15 98% 39 7 $3,395,200 $485,029 $489,000 10 15 98% 19 3 $2,438,000 $812,667 $839,000 4 6 93% 14 37 $30,564,990 $826,081 $795,000 94 117 98% 22 12 $8,375,000 $697,917 $665,000 25 36 97% 25 32 $27,917,309 $872,416 $822,500 87 117 97% 26 37 $30,269,850 $818,104 $815,000 123 153 98% 17 13 $8,660,388 $666,184 $660,000 18 13 98% 34 94 $48,637,990 $517,425 $517,750 186 150 99% 18 20 $10,959,400 $547,970 $541,000 41 37 100% 22 1 $397,800 $397,800 $397,800 0 0 95% 23 15 $6,390,290 $426,019 $425,000 20 12 100% 14 12 $5,637,000 $469,750 $452,500 31 29 99% 14 16 $9,220,500 $576,281 $572,000 34 30 98% 20 0 - - - 0 0 - - 1 $573,500 $573,500 $573,500 1 2 96% 68 29 $15,459,500 $533,086 $522,000 59 40 99% 17 10 $4,701,900 $470,190 $467,500 8 9 99% 23 10 $4,701,900 $470,190 $467,500 8 9 99% 23 16 $8,138,300 $508,644 $471,500 31 48 97% 33 0 - - - 0 0 - - 2 $1,138,000 $569,000 $569,000 6 6 97% 12 0 - - - 5 8 - - 6 $3,154,800 $525,800 $404,900 10 20 95% 40 8 $3,845,500 $480,688 $476,500 10 14 99% 32 1 1 1 1 2 3 4 5
- 18. Toronto Real Estate Board Market Watch, November 2017 SUMMARY OF EXISTING HOME TRANSACTIONS ATTACHED/ROW/TOWNHOUSE, NOVEMBER 2017 CITY OF TORONTO MUNICIPAL BREAKDOWN 18 Sales Dollar Volume Average Price Median Price New Listings Active Listings Avg. SP / LP Avg. DOM TREB Total City of Toronto Total Toronto West Toronto W01 Toronto W02 Toronto W03 Toronto W04 Toronto W05 Toronto W06 Toronto W07 Toronto W08 Toronto W09 Toronto W10 Toronto Central Toronto C01 Toronto C02 Toronto C03 Toronto C04 Toronto C06 Toronto C07 Toronto C08 Toronto C09 Toronto C10 Toronto C11 Toronto C12 Toronto C13 Toronto C14 Toronto C15 Toronto East Toronto E01 Toronto E02 Toronto E03 Toronto E04 Toronto E05 Toronto E06 Toronto E07 Toronto E08 Toronto E09 Toronto E10 Toronto E11 631 $440,713,129 $698,436 $635,000 1,291 1,385 99% 21 97 $97,281,719 $1,002,904 $854,200 162 151 102% 16 21 $18,458,200 $878,962 $895,000 45 49 100% 23 2 $1,830,000 $915,000 $915,000 1 3 98% 31 2 $2,590,000 $1,295,000 $1,295,000 0 1 119% 7 1 $520,000 $520,000 $520,000 3 4 96% 41 1 $650,000 $650,000 $650,000 1 2 98% 15 3 $1,777,000 $592,333 $595,000 10 10 98% 39 6 $5,390,400 $898,400 $893,750 10 10 98% 20 3 $2,793,000 $931,000 $923,000 6 6 99% 13 3 $2,907,800 $969,267 $945,000 7 5 96% 24 0 - - - 4 4 - - 0 - - - 3 4 - - 44 $55,750,419 $1,267,055 $1,087,500 61 46 102% 11 17 $18,465,020 $1,086,178 $1,075,000 24 13 109% 8 5 $10,292,000 $2,058,400 $1,855,000 4 3 100% 17 1 $2,300,000 $2,300,000 $2,300,000 1 1 96% 13 3 $3,610,800 $1,203,600 $910,800 3 1 102% 6 1 $926,000 $926,000 $926,000 1 0 100% 8 3 $2,667,999 $889,333 $988,000 4 4 100% 9 7 $7,476,200 $1,068,029 $1,002,000 12 10 100% 12 1 $3,315,000 $3,315,000 $3,315,000 2 1 96% 11 0 - - - 1 2 - - 1 $710,000 $710,000 $710,000 1 1 101% 13 0 - - - 0 0 - - 1 $690,000 $690,000 $690,000 3 5 99% 5 4 $5,297,400 $1,324,350 $1,301,250 5 5 96% 24 0 - - - 0 0 - - 32 $23,073,100 $721,034 $673,400 56 56 102% 19 9 $8,151,500 $905,722 $940,000 12 10 106% 17 1 $788,800 $788,800 $788,800 4 3 113% 8 0 - - - 2 1 - - 3 $2,155,000 $718,333 $720,000 8 8 97% 12 3 $2,015,000 $671,667 $660,000 5 5 99% 20 0 - - - 0 0 - - 2 $1,333,800 $666,900 $666,900 2 2 111% 8 3 $2,036,000 $678,667 $698,000 4 7 95% 36 0 - - - 1 1 - - 4 $2,387,000 $596,750 $626,500 5 5 99% 14 7 $4,206,000 $600,857 $600,000 13 14 99% 25 1 1 1 1 2 3 4 5
- 19. Toronto Real Estate Board Market Watch, November 2017 SUMMARY OF EXISTING HOME TRANSACTIONS CO-OP APARTMENT, NOVEMBER 2017 ALL TREB AREAS 19 Sales Dollar Volume Average Price Median Price New Listings Active Listings Avg. SP / LP Average DOM TREB Total Halton Region Burlington Halton Hills Milton Oakville Peel Region Brampton Caledon Mississauga City of Toronto Toronto West Toronto Central Toronto East York Region Aurora E. Gwillimbury Georgina King Markham Newmarket Richmond Hill Vaughan Whitchurch-Stouffville Durham Region Ajax Brock Clarington Oshawa Pickering Scugog Uxbridge Whitby Dufferin County Orangeville Simcoe County Adjala-Tosorontio Bradford West GwillimburyEssa Innisfil New Tecumseth 7 $1,675,150 $239,307 $239,250 11 13 98% 29 1 $185,000 $185,000 $185,000 0 0 98% 64 1 $185,000 $185,000 $185,000 0 0 98% 64 0 - - - 0 0 - - 0 - - - 0 0 - - 0 - - - 0 0 - - 0 - - - 0 0 - - 0 - - - 0 0 - - 0 - - - 0 0 - - 0 - - - 0 0 - - 6 $1,490,150 $248,358 $239,575 11 12 99% 24 2 $457,000 $228,500 $228,500 3 3 95% 27 2 $603,250 $301,625 $301,625 8 9 100% 22 2 $429,900 $214,950 $214,950 0 0 100% 23 0 - - - 0 1 - - 0 - - - 0 0 - - 0 - - - 0 0 - - 0 - - - 0 0 - - 0 - - - 0 0 - - 0 - - - 0 0 - - 0 - - - 0 0 - - 0 - - - 0 1 - - 0 - - - 0 0 - - 0 - - - 0 0 - - 0 - - - 0 0 - - 0 - - - 0 0 - - 0 - - - 0 0 - - 0 - - - 0 0 - - 0 - - - 0 0 - - 0 - - - 0 0 - - 0 - - - 0 0 - - 0 - - - 0 0 - - 0 - - - 0 0 - - 0 - - - 0 0 - - 0 - - - 0 0 - - 0 - - - 0 0 - - 0 - - - 0 0 - - 0 - - - 0 0 - - 0 - - - 0 0 - - 0 - - - 0 0 - - 0 - - - 0 0 - - 1 1 1 1 2 3 4 5
- 20. Toronto Real Estate Board Market Watch, November 2017 SUMMARY OF EXISTING HOME TRANSACTIONS CO-OP APARTMENT, NOVEMBER 2017 CITY OF TORONTO MUNICIPAL BREAKDOWN 20 Sales Dollar Volume Average Price Median Price New Listings Active Listings Avg. SP / LP Avg. DOM TREB Total City of Toronto Total Toronto West Toronto W01 Toronto W02 Toronto W03 Toronto W04 Toronto W05 Toronto W06 Toronto W07 Toronto W08 Toronto W09 Toronto W10 Toronto Central Toronto C01 Toronto C02 Toronto C03 Toronto C04 Toronto C06 Toronto C07 Toronto C08 Toronto C09 Toronto C10 Toronto C11 Toronto C12 Toronto C13 Toronto C14 Toronto C15 Toronto East Toronto E01 Toronto E02 Toronto E03 Toronto E04 Toronto E05 Toronto E06 Toronto E07 Toronto E08 Toronto E09 Toronto E10 Toronto E11 7 $1,675,150 $239,307 $239,250 11 13 98% 29 6 $1,490,150 $248,358 $239,575 11 12 99% 24 2 $457,000 $228,500 $228,500 3 3 95% 27 0 - - - 0 0 - - 0 - - - 0 0 - - 0 - - - 0 0 - - 0 - - - 0 0 - - 1 $127,000 $127,000 $127,000 0 0 98% 7 0 - - - 2 2 - - 0 - - - 1 1 - - 0 - - - 0 0 - - 1 $330,000 $330,000 $330,000 0 0 95% 46 0 - - - 0 0 - - 2 $603,250 $301,625 $301,625 8 9 100% 22 0 - - - 0 0 - - 0 - - - 1 1 - - 2 $603,250 $301,625 $301,625 3 2 100% 22 0 - - - 1 1 - - 0 - - - 0 0 - - 0 - - - 0 0 - - 0 - - - 0 0 - - 0 - - - 3 4 - - 0 - - - 0 0 - - 0 - - - 0 0 - - 0 - - - 0 0 - - 0 - - - 0 0 - - 0 - - - 0 1 - - 0 - - - 0 0 - - 2 $429,900 $214,950 $214,950 0 0 100% 23 0 - - - 0 0 - - 0 - - - 0 0 - - 0 - - - 0 0 - - 1 $239,900 $239,900 $239,900 0 0 96% 43 0 - - - 0 0 - - 0 - - - 0 0 - - 0 - - - 0 0 - - 0 - - - 0 0 - - 0 - - - 0 0 - - 1 $190,000 $190,000 $190,000 0 0 106% 3 0 - - - 0 0 - - 1 1 1 1 2 3 4 5
- 21. Toronto Real Estate Board Market Watch, November 2017 SUMMARY OF EXISTING HOME TRANSACTIONS DETACHED CONDOMINIUM, NOVEMBER 2017 ALL TREB AREAS 21 Sales Dollar Volume Average Price Median Price New Listings Active Listings Avg. SP / LP Avg. DOM TREB Total Halton Region Burlington Halton Hills Milton Oakville Peel Region Brampton Caledon Mississauga City of Toronto Toronto West Toronto Central Toronto East York Region Aurora E. Gwillimbury Georgina King Markham Newmarket Richmond Hill Vaughan Whitchurch-Stouffville Durham Region Ajax Brock Clarington Oshawa Pickering Scugog Uxbridge Whitby Dufferin County Orangeville Simcoe County Adjala-Tosorontio Bradford West GwillimburyEssa Innisfil New Tecumseth 6 $5,399,000 $899,833 $799,500 13 24 100% 28 1 $627,000 $627,000 $627,000 0 1 97% 51 1 $627,000 $627,000 $627,000 0 1 97% 51 0 - - - 0 0 - - 0 - - - 0 0 - - 0 - - - 0 0 - - 1 $560,000 $560,000 $560,000 6 6 112% 6 0 - - - 1 1 - - 0 - - - 1 2 - - 1 $560,000 $560,000 $560,000 4 3 112% 6 1 $1,500,000 $1,500,000 $1,500,000 4 3 108% 2 0 - - - 0 0 - - 1 $1,500,000 $1,500,000 $1,500,000 1 0 108% 2 0 - - - 3 3 - - 1 $1,113,000 $1,113,000 $1,113,000 0 0 91% 14 0 - - - 0 0 - - 0 - - - 0 0 - - 0 - - - 0 0 - - 0 - - - 0 0 - - 1 $1,113,000 $1,113,000 $1,113,000 0 0 91% 14 0 - - - 0 0 - - 0 - - - 0 0 - - 0 - - - 0 0 - - 0 - - - 0 0 - - 0 - - - 1 1 - - 0 - - - 1 1 - - 0 - - - 0 0 - - 0 - - - 0 0 - - 0 - - - 0 0 - - 0 - - - 0 0 - - 0 - - - 0 0 - - 0 - - - 0 0 - - 0 - - - 0 0 - - 0 - - - 0 0 - - 0 - - - 0 0 - - 2 $1,599,000 $799,500 $799,500 2 13 98% 47 0 - - - 0 0 - - 0 - - - 0 0 - - 0 - - - 0 0 - - 0 - - - 0 0 - - 2 $1,599,000 $799,500 $799,500 2 13 98% 47 1 1 1 1 2 3 4 5
- 22. Toronto Real Estate Board Market Watch, November 2017 SUMMARY OF EXISTING HOME TRANSACTIONS DETACHED CONDOMINIUM, NOVEMBER 2017 CITY OF TORONTO MUNICIPAL BREAKDOWN 22 Sales Dollar Volume Average Price Median Price New Listings Active Listings Avg. SP / LP Avg. DOM TREB Total City of Toronto Total Toronto West Toronto W01 Toronto W02 Toronto W03 Toronto W04 Toronto W05 Toronto W06 Toronto W07 Toronto W08 Toronto W09 Toronto W10 Toronto Central Toronto C01 Toronto C02 Toronto C03 Toronto C04 Toronto C06 Toronto C07 Toronto C08 Toronto C09 Toronto C10 Toronto C11 Toronto C12 Toronto C13 Toronto C14 Toronto C15 Toronto East Toronto E01 Toronto E02 Toronto E03 Toronto E04 Toronto E05 Toronto E06 Toronto E07 Toronto E08 Toronto E09 Toronto E10 Toronto E11 6 $5,399,000 $899,833 $799,500 13 24 100% 28 1 $1,500,000 $1,500,000 $1,500,000 4 3 108% 2 0 - - - 0 0 - - 0 - - - 0 0 - - 0 - - - 0 0 - - 0 - - - 0 0 - - 0 - - - 0 0 - - 0 - - - 0 0 - - 0 - - - 0 0 - - 0 - - - 0 0 - - 0 - - - 0 0 - - 0 - - - 0 0 - - 0 - - - 0 0 - - 1 $1,500,000 $1,500,000 $1,500,000 1 0 108% 2 0 - - - 0 0 - - 0 - - - 0 0 - - 0 - - - 0 0 - - 0 - - - 0 0 - - 0 - - - 0 0 - - 0 - - - 0 0 - - 0 - - - 0 0 - - 1 $1,500,000 $1,500,000 $1,500,000 1 0 108% 2 0 - - - 0 0 - - 0 - - - 0 0 - - 0 - - - 0 0 - - 0 - - - 0 0 - - 0 - - - 0 0 - - 0 - - - 0 0 - - 0 - - - 3 3 - - 0 - - - 0 0 - - 0 - - - 0 0 - - 0 - - - 0 0 - - 0 - - - 0 0 - - 0 - - - 0 0 - - 0 - - - 0 0 - - 0 - - - 0 0 - - 0 - - - 1 1 - - 0 - - - 0 0 - - 0 - - - 0 0 - - 0 - - - 2 2 - - 1 1 1 1 2 3 4 5
- 23. Toronto Real Estate Board Market Watch, November 2017 SUMMARY OF EXISTING HOME TRANSACTIONS CO-OWNERSHIP APARTMENT, NOVEMBER 2017 ALL TREB AREAS 23 Sales Dollar Volume Average Price Median Price New Listings Active Listings Avg. SP / LP Avg. DOM TREB Total Halton Region Burlington Halton Hills Milton Oakville Peel Region Brampton Caledon Mississauga City of Toronto Toronto West Toronto Central Toronto East York Region Aurora E. Gwillimbury Georgina King Markham Newmarket Richmond Hill Vaughan Whitchurch-Stouffville Durham Region Ajax Brock Clarington Oshawa Pickering Scugog Uxbridge Whitby Dufferin County Orangeville Simcoe County Adjala-Tosorontio Bradford West GwillimburyEssa Innisfil New Tecumseth 4 $2,005,000 $501,250 $467,500 10 10 109% 10 0 - - - 0 0 - - 0 - - - 0 0 - - 0 - - - 0 0 - - 0 - - - 0 0 - - 0 - - - 0 0 - - 0 - - - 0 0 - - 0 - - - 0 0 - - 0 - - - 0 0 - - 0 - - - 0 0 - - 4 $2,005,000 $501,250 $467,500 10 10 109% 10 0 - - - 4 6 - - 4 $2,005,000 $501,250 $467,500 6 4 109% 10 0 - - - 0 0 - - 0 - - - 0 0 - - 0 - - - 0 0 - - 0 - - - 0 0 - - 0 - - - 0 0 - - 0 - - - 0 0 - - 0 - - - 0 0 - - 0 - - - 0 0 - - 0 - - - 0 0 - - 0 - - - 0 0 - - 0 - - - 0 0 - - 0 - - - 0 0 - - 0 - - - 0 0 - - 0 - - - 0 0 - - 0 - - - 0 0 - - 0 - - - 0 0 - - 0 - - - 0 0 - - 0 - - - 0 0 - - 0 - - - 0 0 - - 0 - - - 0 0 - - 0 - - - 0 0 - - 0 - - - 0 0 - - 0 - - - 0 0 - - 0 - - - 0 0 - - 0 - - - 0 0 - - 0 - - - 0 0 - - 0 - - - 0 0 - - 0 - - - 0 0 - - 1 1 1 1 2 3 4 5
- 24. Toronto Real Estate Board Market Watch, November 2017 SUMMARY OF EXISTING HOME TRANSACTIONS CO-OWNERSHIP APARTMENT, NOVEMBER 2017 CITY OF TORONTO MUNICIPAL BREAKDOWN 24 Sales Dollar Volume Average Price Median Price New Listings Active Listings Avg. SP / LP Avg. DOM TREB Total City of Toronto Total Toronto West Toronto W01 Toronto W02 Toronto W03 Toronto W04 Toronto W05 Toronto W06 Toronto W07 Toronto W08 Toronto W09 Toronto W10 Toronto Central Toronto C01 Toronto C02 Toronto C03 Toronto C04 Toronto C06 Toronto C07 Toronto C08 Toronto C09 Toronto C10 Toronto C11 Toronto C12 Toronto C13 Toronto C14 Toronto C15 Toronto East Toronto E01 Toronto E02 Toronto E03 Toronto E04 Toronto E05 Toronto E06 Toronto E07 Toronto E08 Toronto E09 Toronto E10 Toronto E11 4 $2,005,000 $501,250 $467,500 10 10 109% 10 4 $2,005,000 $501,250 $467,500 10 10 109% 10 0 - - - 4 6 - - 0 - - - 0 0 - - 0 - - - 0 0 - - 0 - - - 0 0 - - 0 - - - 0 0 - - 0 - - - 2 4 - - 0 - - - 2 2 - - 0 - - - 0 0 - - 0 - - - 0 0 - - 0 - - - 0 0 - - 0 - - - 0 0 - - 4 $2,005,000 $501,250 $467,500 6 4 109% 10 0 - - - 0 0 - - 1 $262,500 $262,500 $262,500 1 0 99% 7 0 - - - 1 1 - - 1 $310,000 $310,000 $310,000 0 0 98% 19 0 - - - 0 0 - - 0 - - - 0 0 - - 0 - - - 1 1 - - 2 $1,432,500 $716,250 $716,250 2 0 113% 7 0 - - - 0 0 - - 0 - - - 0 0 - - 0 - - - 0 0 - - 0 - - - 1 2 - - 0 - - - 0 0 - - 0 - - - 0 0 - - 0 - - - 0 0 - - 0 - - - 0 0 - - 0 - - - 0 0 - - 0 - - - 0 0 - - 0 - - - 0 0 - - 0 - - - 0 0 - - 0 - - - 0 0 - - 0 - - - 0 0 - - 0 - - - 0 0 - - 0 - - - 0 0 - - 0 - - - 0 0 - - 0 - - - 0 0 - - 1 1 1 1 2 3 4 5
- 25. Toronto Real Estate Board Market Watch, November 2017 FOCUS ON THE MLS HOME PRICE INDEX INDEX AND BENCHMARK PRICE, NOVEMBER 2017 ALL TREB AREAS 25 Composite Single-Family Detached Single-Family Attached Townhouse Apartment Index Benchmark Yr./Yr. % Chg. Index Benchmark Yr./Yr. % Chg. Index Benchmark Yr./Yr. % Chg. Index Benchmark Yr./Yr. % Chg. Index Benchmark Yr./Yr. % Chg. TREB Total Halton Region Burlington Halton Hills Milton Oakville Peel Region Brampton Caledon Mississauga City of Toronto York Region Aurora East Gwillimbury Georgina King Markham Newmarket Richmond Hill Vaughan Whitchurch-Stouffville Durham Region Ajax Brock Clarington Oshawa Pickering Scugog Uxbridge Whitby Dufferin County Orangeville Simcoe County Adjala-Tosorontio Bradford West GwillimburyEssa Innisfil New Tecumseth 245.0 $744,700 8.41% 247.2 $915,600 4.04% 250.1 $703,500 4.51% 245.4 $544,400 11.70% 232.3 $464,000 21.62% 251.8 $811,900 7.56% 252.5 $931,300 5.25% 259.0 $662,600 7.20% 264.0 $487,000 10.69% 233.5 $431,800 14.74% 250.3 $680,000 7.52% 251.2 $850,400 4.02% 261.2 $626,700 9.75% 270.6 $497,300 10.67% 232.6 $382,900 14.24% 239.4 $708,500 6.21% 240.4 $782,200 6.37% 242.4 $549,200 5.62% 236.5 $380,100 10.41% 221.6 $448,100 14.40% 239.1 $708,800 5.84% 236.3 $845,600 4.60% 248.4 $600,400 5.52% 240.5 $398,200 13.12% 231.6 $471,700 17.56% 261.3 $955,800 7.27% 262.3 $1,108,800 4.34% 270.9 $756,400 4.55% 263.6 $570,400 10.80% 235.6 $452,600 14.76% 234.7 $666,500 9.37% 233.6 $824,800 6.86% 236.8 $606,200 6.71% 236.7 $508,200 11.44% 224.0 $385,000 18.77% 235.6 $597,400 9.79% 229.9 $671,500 8.39% 235.5 $552,300 8.18% 240.8 $440,200 15.55% 219.9 $328,200 18.54% 208.3 $764,900 6.71% 207.9 $790,300 6.56% 238.6 $589,400 8.11% - - - 230.6 $560,600 23.18% 236.0 $700,400 9.11% 243.1 $971,000 4.92% 238.6 $658,000 4.70% 235.3 $528,900 10.11% 224.6 $395,900 18.71% 244.1 $791,300 12.33% 248.0 $1,088,200 2.86% 255.1 $850,400 5.72% 248.3 $599,100 13.53% 236.8 $486,200 23.53% 260.4 $879,100 1.92% 268.1 $1,020,200 0.22% 263.5 $762,400 -1.31% 234.6 $600,600 9.83% 211.7 $465,400 19.47% 268.7 $889,200 3.47% 271.4 $1,025,200 2.18% 272.2 $702,000 2.52% 243.1 $664,700 9.50% 233.0 $487,100 11.32% 237.1 $810,100 5.61% 240.3 $856,400 5.35% 248.6 $520,000 6.15% - - - - - - 239.4 $456,200 7.21% 245.6 $463,100 7.72% 245.8 $484,600 0.57% - - - - - - 235.3 $984,400 4.95% 236.4 $983,400 4.65% 241.5 $565,600 1.94% - - - 221.7 $606,300 21.75% 266.3 $922,800 1.95% 289.6 $1,191,400 -0.52% 272.4 $814,700 -0.77% 226.7 $598,400 10.96% 202.5 $484,700 20.18% 239.8 $706,600 0.50% 242.5 $817,400 -0.74% 238.9 $562,700 -3.40% 235.3 $488,500 9.29% 246.9 $415,900 14.41% 281.5 $1,011,300 0.04% 304.2 $1,292,800 -1.52% 278.5 $846,400 -2.62% 227.1 $575,100 5.58% 215.5 $438,600 17.76% 250.6 $906,400 3.77% 245.9 $1,022,200 1.70% 255.7 $774,600 -1.58% 259.5 $705,600 11.28% 216.0 $498,400 22.45% 263.9 $909,400 -1.09% 264.8 $949,900 -1.82% 233.0 $640,000 1.30% 216.0 $387,700 10.88% 237.0 $526,600 9.62% 232.5 $543,000 7.29% 229.2 $595,600 6.90% 236.4 $472,100 4.74% 234.3 $371,600 10.05% 228.4 $389,400 12.02% 237.2 $584,400 5.75% 237.3 $636,600 5.05% 241.3 $520,700 5.65% 221.9 $405,600 2.02% 213.9 $346,700 17.79% 194.4 $353,600 18.32% 195.5 $356,800 18.41% - - - - - - - - - 225.5 $476,000 7.33% 220.1 $530,100 6.95% 219.0 $418,400 0.74% 260.5 $408,100 18.09% 206.9 $306,700 14.94% 233.5 $444,600 7.50% 226.5 $483,400 6.09% 245.5 $410,900 7.49% 252.1 $313,100 20.39% 218.3 $256,000 9.64% 240.0 $643,600 7.19% 236.7 $737,200 6.96% 244.3 $570,100 7.15% 227.3 $405,900 3.65% 263.0 $488,800 11.63% 228.4 $596,300 22.07% 235.3 $609,500 22.17% 214.6 $449,100 14.21% - - - - - - 227.7 $696,000 16.00% 226.6 $699,700 16.15% 222.8 $546,700 17.26% - - - - - - 231.6 $603,100 4.84% 232.7 $669,300 4.54% 234.1 $515,700 2.45% 203.6 $370,700 1.80% 214.5 $388,800 10.74% 248.4 $569,400 15.97% 259.1 $590,500 15.46% 243.0 $455,400 16.10% - - - - - - 248.4 $569,400 15.97% 259.1 $590,500 15.46% 243.0 $455,400 16.10% - - - - - - 244.0 $547,800 8.25% 238.6 $554,700 7.72% 251.4 $471,100 11.58% - - - - - - 221.4 $666,200 3.89% 221.4 $667,800 3.94% - - - - - - - - - 255.6 $622,900 6.68% 240.4 $657,600 6.75% 264.7 $550,100 10.02% - - - - - - 245.8 $469,600 10.77% 241.9 $482,400 7.18% 255.2 $397,400 17.28% - - - - - - 251.9 $487,600 8.07% 251.5 $486,100 7.89% 255.8 $391,100 13.24% - - - - - - 223.9 $532,000 10.51% 218.7 $554,300 8.86% 227.4 $412,100 9.22% - - - - - -
- 26. Toronto Real Estate Board Market Watch, November 2017 FOCUS ON THE MLS HOME PRICE INDEX INDEX AND BENCHMARK PRICE, NOVEMBER 2017 CITY OF TORONTO 26 Composite Single-Family Detached Single-Family Attached Townhouse Apartment Index Benchmark Yr./Yr. % Chg. Index Benchmark Yr./Yr. % Chg. Index Benchmark Yr./Yr. % Chg. Index Benchmark Yr./Yr. % Chg. Index Benchmark Yr./Yr. % Chg. TREB Total City of Toronto Toronto W01 Toronto W02 Toronto W03 Toronto W04 Toronto W05 Toronto W06 Toronto W07 Toronto W08 Toronto W09 Toronto W10 Toronto C01 Toronto C02 Toronto C03 Toronto C04 Toronto C06 Toronto C07 Toronto C08 Toronto C09 Toronto C10 Toronto C11 Toronto C12 Toronto C13 Toronto C14 Toronto C15 Toronto E01 Toronto E02 Toronto E03 Toronto E04 Toronto E05 Toronto E06 Toronto E07 Toronto E08 Toronto E09 Toronto E10 Toronto E11 245.0 $744,700 8.41% 247.2 $915,600 4.04% 250.1 $703,500 4.51% 245.4 $544,400 11.70% 232.3 $464,000 21.62% 244.1 $791,300 12.33% 248.0 $1,088,200 2.86% 255.1 $850,400 5.72% 248.3 $599,100 13.53% 236.8 $486,200 23.53% 225.4 $908,400 12.98% 223.1 $1,164,100 1.87% 243.0 $937,000 1.93% 233.0 $493,100 11.11% 221.4 $500,600 24.52% 256.1 $910,900 6.62% 248.1 $1,049,500 0.36% 287.8 $882,100 4.20% 234.4 $552,300 3.35% 243.9 $523,000 27.83% 267.2 $689,700 10.23% 272.2 $740,000 9.49% 263.9 $675,900 6.71% 229.9 $469,000 9.84% 242.4 $417,300 25.21% 240.9 $617,000 13.85% 244.6 $770,400 8.23% 226.9 $656,100 2.95% 213.0 $503,300 14.64% 241.2 $353,300 31.23% 219.3 $520,500 13.74% 234.2 $776,700 6.65% 214.1 $625,200 5.42% 220.3 $400,000 22.80% 211.6 $278,000 29.82% 194.1 $568,500 7.53% 259.8 $829,500 2.89% 213.3 $646,400 2.20% 261.6 $778,000 14.39% 159.5 $404,100 19.65% 221.2 $948,200 3.66% 234.6 $1,016,800 2.31% 208.5 $854,900 0.72% 0.0 $0 -100.00% 138.1 $560,000 14.13% 200.7 $800,200 10.40% 204.0 $1,066,300 2.15% 203.0 $752,000 0.94% 211.2 $508,000 15.73% 197.4 $411,000 19.20% 222.6 $560,300 12.14% 219.5 $818,600 3.10% 195.3 $561,600 2.74% 246.4 $641,100 16.39% 222.0 $284,700 28.92% 225.5 $519,400 13.09% 228.5 $685,500 3.30% 231.8 $593,200 6.18% 206.5 $439,800 12.53% 226.8 $315,000 30.95% 264.0 $654,000 19.84% 283.6 $1,074,000 13.94% 273.3 $956,700 10.56% 249.9 $710,500 10.23% 262.8 $547,100 21.78% 248.2 $1,187,200 9.58% 222.3 $1,776,100 5.96% 257.1 $1,348,400 8.34% 253.1 $1,130,200 3.64% 245.0 $698,000 13.01% 279.1 $1,459,300 13.32% 262.5 $1,613,200 8.52% 280.4 $1,039,800 11.14% - - - 305.7 $804,100 24.57% 242.3 $1,495,300 7.40% 245.2 $1,727,600 3.77% 249.3 $1,167,100 3.70% 293.0 $1,077,100 36.92% 222.9 $515,500 27.37% 260.8 $1,015,600 6.36% 262.8 $1,122,500 -5.47% 211.2 $781,300 -3.07% 227.9 $611,200 14.93% 261.6 $578,500 24.87% 248.1 $858,300 9.15% 292.6 $1,338,500 -3.05% 210.0 $751,400 -5.06% 225.2 $634,700 14.55% 224.5 $548,200 25.35% 238.4 $623,600 14.56% 256.0 $1,493,600 8.57% 254.9 $1,216,000 5.29% 243.0 $634,600 7.62% 236.8 $511,900 16.25% 162.3 $1,148,800 11.78% 130.4 $1,638,000 0.46% 143.6 $1,168,500 -0.28% 250.3 $1,370,900 15.35% 182.1 $603,300 20.28% 254.5 $993,600 12.46% 257.4 $1,589,200 5.02% 246.9 $1,219,700 4.13% 238.0 $694,700 10.13% 256.4 $612,300 17.56% 238.9 $845,400 12.53% 196.4 $1,337,900 -0.10% 222.3 $984,300 -0.45% 209.6 $363,100 8.32% 274.0 $397,800 20.60% 211.9 $1,807,900 5.53% 197.2 $2,113,500 -2.42% 256.8 $1,074,900 -3.31% 211.7 $847,000 9.52% 252.3 $791,000 28.01% 233.9 $846,900 7.99% 249.7 $1,331,600 -3.74% 223.7 $713,800 -6.83% 237.9 $687,800 13.83% 218.4 $439,800 26.98% 254.5 $832,200 14.90% 295.2 $1,597,000 -3.66% 230.9 $1,124,300 -7.90% 305.4 $822,400 21.19% 237.4 $597,800 25.94% 248.1 $805,200 10.61% 315.2 $1,480,000 -0.32% 261.6 $850,500 -3.68% 283.1 $677,600 20.06% 208.6 $485,100 28.05% 300.8 $939,400 13.34% 298.5 $1,053,300 10.84% 306.6 $967,200 10.97% 345.9 $632,300 18.38% 271.9 $644,900 23.70% 265.9 $998,100 12.81% 230.7 $1,051,100 12.04% 278.9 $934,000 13.24% 291.5 $875,200 16.97% 252.6 $690,600 11.47% 246.1 $757,100 3.93% 254.2 $857,000 1.32% 237.0 $776,100 5.52% - - - 218.9 $319,800 19.75% 245.4 $606,100 12.52% 240.5 $709,100 4.57% 250.7 $604,100 8.06% 233.8 $506,800 13.44% 260.0 $398,900 31.85% 246.2 $646,000 9.52% 257.8 $907,900 0.78% 249.5 $687,500 -2.54% 251.4 $546,700 7.94% 229.4 $450,600 27.80% 255.4 $712,200 7.00% 257.1 $734,300 5.89% 264.4 $628,900 8.54% 254.5 $629,400 16.10% 237.0 $501,200 19.04% 256.9 $629,700 11.89% 268.2 $879,100 1.25% 258.6 $676,200 2.42% 257.5 $557,800 5.75% 247.1 $423,200 27.57% 251.0 $605,700 15.88% 246.6 $768,700 5.34% 225.2 $583,700 8.32% 243.2 $496,400 19.86% 261.9 $417,800 37.77% 239.3 $572,200 14.99% 244.2 $693,400 4.63% 232.1 $567,700 6.47% 269.9 $501,600 16.29% 231.4 $434,000 28.06% 257.6 $722,000 9.43% 247.0 $791,400 5.56% 238.6 $618,700 6.80% 310.6 $542,300 21.04% 247.8 $399,500 40.40% 251.5 $550,100 17.25% 257.3 $715,700 7.70% 250.3 $566,900 7.29% 195.1 $382,900 7.26% 287.0 $428,300 51.21%
- 27. Toronto Real Estate Board Market Watch, November 2017 HISTORIC ANNUAL STATISTICS 27 Year Sales Average Price 2005 2006 2007 2008 2009 2010 2011 2012 2013 2014 2015 84,145 $335,907 83,084 $351,941 93,193 $376,236 74,552 $379,347 87,308 $395,460 85,545 $431,276 89,096 $465,014 85,496 $497,130 87,049 $522,958 92,782 $566,624 101,213 $622,121 2016 MONTHLY STATISTICS NOTES 1 - Sales, dollar volume, average sale prices and median sale prices are based on firm transactions entered into the TREB MLS® system between the first and last day of the month/period being reported. 2 - New listings entered into the TREB MLS® system between the first and last day of the month/period being reported. 3 - Active listings at the end of the last day of the month/period being reported. 4 - Ratio of the average selling price to the average listing price for firm transactions entered into the TREB MLS® system between the first and last day of the month/period being reported. 5 - Average number of days on the market for firm transactions entered into the TREB MLS® system between the first and last day of the month/period being reported. 6 - Due to past changes to TREB's service area, caution should be exercised when making historical comparisons. 7 - Past monthly and year-to-date figures are revised on a monthly basis. 8 - SNLR = Sales-to-New Listings Ratio. Calculated using a 12-month moving average (sales/new listings). 9 - Mos. Inv. = Months of Inventory. Calculated using a 12-month moving average (active listings/sales). 2017 MONTHLY STATISTICS *For historic annual sales and average price data over a longer time frame go to: January February March April May June July August September October November December Year to Date 5,155 $768,351 7,955 $876,348 11,960 $915,575 11,470 $918,138 10,070 $862,628 7,898 $791,881 5,872 $745,882 6,315 $731,391 6,347 $774,809 7,097 $780,410 7,374 $761,757 - - 87,513 $811,561 January February March April May June July August September October November December Annual 4,640 $630,193 7,582 $685,628 10,260 $688,011 12,016 $739,762 12,789 $752,068 12,725 $747,018 9,929 $710,471 9,748 $710,978 9,828 $756,104 9,715 $762,691 8,503 $777,091 5,305 $730,124 113,040 $729,837 1,6,7 1,7 1,7 http://www.torontorealestateboard.com/market_news/market_watch/historic_stats/p df/TREB_historic_statistics.pdf Copyright® 2017 Toronto Real Estate Board $827,60887,513