SlideShare una empresa de Scribd logo
1 de 27
Descargar para leer sin conexión
Sales
New Listings
Active Listings
Average Price
Avg. LDOM
Avg. PDOM
8,728 9,017 3.3%
11,556 10,036 -13.2%
13,798 6,086 -55.9%
$955,889 $1,163,323 21.7%
19 13 -31.6%
28 18 -35.7%
2020 2021 % Chg.
Year
Market Watch
NOVEMBER 2021
Economic Indicators
November 2021
GTA REALTORS®
RELEASE NOVEMBER STATS
TORONTO, ONTARIO, December 3, 2021 – Home sales reached a new record for the month of November and the
average selling price also reached a new all-time high. New listings were down substantially compared to last year for all
market segments – further highlighting the inherent supply issue across all home types in the Greater Toronto Area (GTA).
GTA REALTORS® reported 9,017 home sales through TRREB’s MLS® System in November 2021 – 3.3 per cent above
the November 2020 result, setting a new record. In contrast, new listings were down by 13.2 per cent year-over-year, with
double-digit declines for low-rise home types, and condominium apartments.
“Governments at all levels must take coordinated action to increase supply in the immediate term to begin addressing the
supply challenges of today, and to work towards satisfying growing demand in the future. The GTA remains the primary
destination for new immigrants, and is at the centre of the Canadian economy. For far too long governments have focused
on short term bandaid policies to artificially suppress demand. Current market activity highlights decisively that these
policies do not work, and unless governments work together to cut red tape, streamline the approval processes, and
incentivize mid-density housing ongoing housing affordability challenges will escalate. On this point, we commend the City
of Toronto for moving forward with initiatives to facilitate the creation of more mid-density home types, including their
current consultations on options to encourage more multiplex development across the city,” said TRREB President Kevin
Crigger.
The MLS® Home Price Index composite benchmark was up by 28.3 per cent year-over-year in November 2021. The
average selling price for all home types combined was $1,163,323 – up by 21.7 per cent compared to November 2020.
“A key difference this year compared to last is how the condo segment continues to tighten and experience an acceleration
in price growth, particularly in suburban areas. This speaks to the broadening of economic recovery, with first-time buyers
moving back into the market in a big way this year. The condo and townhouse segments, with lower price points on
average, will remain popular as population growth picks up over the next two years,” said TRREB Chief Market Analyst
Jason Mercer.
Sources and Notes:
i - Statistics Canada, Quarter-over-quarter
growth, annualized
ii - Statistics Canada, Year-over-year
growth for the most recently reported
month
iii - Bank of Canada, Rate from most
recent Bank of Canada announcement
iv - Bank of Canada, Rates for most
recently completed month
For All TRREB Member Inquiries:
For All Media/Public Inquiries:
(416) 443-8152
(416) 443-8158
November 2020
November 2021
9,017 8,728
Detached
Semi-Detached
Townhouse
Condo Apt
918 2,939 3,857 1,807,983 1,492,821 1,567,832
283 472 755 1,431,988 1,070,530 1,206,016
381 1,068 1,449 981,759 955,010 962,044
1,981 887 2,868 745,951 646,211 715,104
Sales Average Price
416 905 Total 416 905 Total
Home Type
Year-Over-Year Per Cent Change
November 2020
November 2021
$1,163,323
$955,889
Detached
Semi-Detached
Townhouse
Condo Apt
-1.2% -10.2% -8.2% 22.3% 32.7% 30.3%
-15.8% -14.0% -14.7% 23.4% 31.1% 27.3%
5.5% -7.9% -4.7% 19.7% 31.0% 28.1%
44.3% 36.0% 41.6% 16.5% 21.1% 18.0%
TRREB MLS®
Sales Activity1,7
TRREB MLS®
Average Price1,7
Sales & Average Price By Major Home Type1,7
Year-Over-Year Summary1,7
November 2021 0.25%
November 2021 2.45%
1 Year 2.79%
3 Year 3.49%
5 Year 4.79%
October 2021 4.7%
October 2021 8.4%
October 2021 6.1%
Q3 2021 5.3%
Real GDP Growth
Toronto Employment Growth
Toronto Unemployment Rate (SA)
Inflation (Yr./Yr. CPI Growth)
Bank of Canada Overnight Rate
Prime Rate
1
Market Watch, November 2021
Copyright®
2021 Toronto Regional Real Estate Board
November 2021
Mortgage Rates
2
3
1
5
5
Toronto Regional Real Estate Board
YEAR-TO-DATE, 2021
$0 to $99,999
$100,000 to $199,999
$200,000 to $299,999
$300,000 to $399,999
$400,000 to $499,999
$500,000 to $599,999
$600,000 to $699,999
$700,000 to $799,999
$800,000 to $899,999
$900,000 to $999,999
$1,000,000 to $1,249,999
$1,250,000 to $1,499,999
$1,500,000 to $1,749,999
$1,750,000 to $1,999,999
$2,000,000+
0 0 0 0 0 0 0 0 0 0
0 0 0 0 3 0 0 0 0 3
0 0 0 0 9 0 0 0 0 9
2 1 2 1 30 0 2 0 2 40
7 0 2 14 238 0 4 0 2 267
20 0 1 47 783 0 1 0 2 854
46 11 4 127 782 1 1 0 0 972
121 31 30 168 464 6 0 2 2 824
161 62 103 176 257 10 0 2 0 771
265 125 190 90 92 10 0 1 0 773
757 314 233 56 99 13 2 2 0 1,476
937 122 121 28 47 19 0 0 0 1,274
585 40 29 8 16 3 1 0 0 682
322 26 5 3 17 0 0 0 0 373
634 23 10 1 31 0 0 0 0 699
Detached Semi-Detached Att/Row/Twnhouse Condo Townhouse Condo Apt Link Co-Op Apt Det Condo Co-Ownership Apt Total
Name
$0 to $99,999
$100,000 to $199,999
$200,000 to $299,999
$300,000 to $399,999
$400,000 to $499,999
$500,000 to $599,999
$600,000 to $699,999
$700,000 to $799,999
$800,000 to $899,999
$900,000 to $999,999
$1,000,000 to $1,249,999
$1,250,000 to $1,499,999
$1,500,000 to $1,749,999
$1,750,000 to $1,999,999
$2,000,000+
0 0 0 0 4 0 0 0 0 4
2 0 0 0 31 0 2 0 0 35
22 0 0 3 90 0 11 0 2 128
56 2 9 27 490 0 24 1 20 629
152 8 6 310 3,984 0 17 0 13 4,490
496 60 37 1,026 9,710 3 12 4 14 11,362
1,090 408 520 2,331 8,036 31 21 25 6 12,468
2,353 760 1,714 2,576 3,879 95 4 20 3 11,404
3,919 1,905 2,617 1,628 2,274 153 4 18 4 12,522
5,224 2,638 2,278 598 1,174 144 4 17 1 12,078
11,591 2,845 2,234 455 1,028 235 6 13 0 18,407
11,043 978 845 193 458 126 6 7 0 13,656
6,229 508 238 72 198 12 2 3 0 7,262
3,470 225 68 32 128 1 3 1 0 3,928
6,688 251 100 37 255 0 1 3 0 7,335
Detached Semi-Detached Att/Row/Twnhouse Condo Townhouse Condo Apt Link Co-Op Apt Det Condo Co-Ownership Apt Total
Name
NOVEMBER 2021
SALES BY PRICE RANGE AND HOUSE TYPE 1,7
Total Sales
Share of Total Sales (%)
Average Price ($)
3,857 755 730 719 2,868 62 11 7 8 9,017
42.8% 8.4% 8.1% 8.0% 31.8% 0.7% 0.1% 0.1% 0.1% 100.0%
$1,567,832 $1,206,017 $1,095,570 $826,475 $715,104 $1,115,305 $683,302 $908,286 $508,813 $1,163,323
52,338 10,592 10,667 9,288 31,739 800 117 112 63 115,716
45.2% 9.2% 9.2% 8.0% 27.4% 0.7% 0.1% 0.1% 0.1% 100.0%
$1,431,448 $1,073,127 $974,267 $767,385 $679,212 $1,015,955 $648,133 $924,222 $495,062 $1,092,212
Total Sales
Share of Total Sales (%)
Average Price ($)
TRREB Total 9,017 $10,489,684,676 $1,163,323 $999,999 10,036 73.5% 6,086 0.9 108% 13 18
Halton Region 798 $1,082,559,634 $1,356,591 $1,200,000 815 79.5% 346 0.7 108% 10 13
Burlington 224 $257,723,024 $1,150,549 $1,074,000 238 81.6% 94 0.6 109% 10 12
Halton Hills 67 $89,991,388 $1,343,155 $1,179,000 71 82.0% 39 0.6 109% 11 14
Milton 193 $232,644,542 $1,205,412 $1,105,000 193 77.8% 64 0.5 110% 8 11
Oakville 314 $502,200,680 $1,599,365 $1,397,000 313 78.5% 149 0.8 106% 11 14
Peel Region 1,716 $1,911,860,974 $1,114,138 $1,030,000 1,810 75.4% 748 0.7 109% 10 13
Brampton 821 $936,055,201 $1,140,140 $1,092,000 862 75.4% 235 0.6 110% 7 10
Caledon 84 $132,846,500 $1,581,506 $1,421,000 101 70.3% 92 1.0 103% 14 23
Mississauga 811 $842,959,273 $1,039,407 $920,000 847 76.1% 421 0.8 108% 13 16
City of Toronto 3,587 $3,933,993,086 $1,096,736 $840,000 4,249 69.2% 3,342 1.2 106% 17 23
Toronto West 883 $893,499,903 $1,011,891 $900,000 1,024 71.0% 718 1.0 108% 16 22
Toronto Central 1,852 $2,168,182,494 $1,170,725 $775,000 2,306 66.0% 2,160 1.4 102% 19 27
Toronto East 852 $872,310,689 $1,023,839 $999,500 919 74.6% 464 0.7 112% 12 16
York Region 1,583 $2,207,831,407 $1,394,713 $1,315,000 1,796 71.9% 1,127 1.0 109% 13 18
Aurora 86 $123,591,555 $1,437,111 $1,336,500 104 73.3% 66 0.9 107% 15 18
East Gwillimbury 59 $80,148,927 $1,358,456 $1,402,000 77 75.3% 43 0.8 112% 10 12
Georgina 79 $82,912,924 $1,049,531 $1,030,000 105 74.3% 64 0.8 111% 10 11
King 35 $73,897,600 $2,111,360 $2,058,000 54 64.2% 62 2.1 100% 19 25
Markham 413 $572,654,659 $1,386,573 $1,360,800 458 73.2% 253 0.9 112% 11 16
Newmarket 143 $173,670,437 $1,214,479 $1,150,000 128 77.9% 34 0.6 111% 9 15
Richmond Hill 324 $476,930,962 $1,472,009 $1,365,000 343 68.1% 254 1.2 108% 17 21
Vaughan 376 $524,644,614 $1,395,331 $1,300,000 447 70.6% 296 1.1 107% 15 19
Whitchurch-Stouffville 68 $99,379,729 $1,461,467 $1,437,500 80 74.4% 55 1.0 107% 17 19
Durham Region 1,013 $1,011,575,833 $998,594 $960,000 1,044 80.7% 364 0.5 119% 8 10
Ajax 142 $152,501,661 $1,073,955 $1,072,750 147 79.7% 46 0.4 119% 6 7
Brock 14 $10,843,000 $774,500 $712,500 17 77.9% 17 0.8 110% 6 15
Clarington 170 $160,645,640 $944,974 $935,500 172 83.4% 62 0.5 122% 8 9
Oshawa 324 $279,336,795 $862,151 $827,500 304 81.0% 90 0.5 121% 9 11
Pickering 118 $137,685,823 $1,166,829 $1,080,000 136 77.7% 49 0.6 115% 9 11
Scugog 34 $32,826,765 $965,493 $838,000 39 79.4% 24 0.9 116% 11 11
Uxbridge 18 $24,824,002 $1,379,111 $1,415,501 21 78.7% 21 0.9 105% 11 16
Whitby 193 $212,912,147 $1,103,172 $1,050,000 208 81.3% 55 0.4 120% 7 8
Dufferin County 51 $43,991,344 $862,575 $850,000 44 86.1% 11 0.5 106% 9 12
Orangeville 51 $43,991,344 $862,575 $850,000 44 86.1% 11 0.5 106% 9 12
Simcoe County 269 $297,872,398 $1,107,332 $960,100 278 77.6% 148 0.8 106% 16 20
Adjala-Tosorontio 19 $21,938,300 $1,154,647 $1,000,000 19 75.6% 13 1.1 102% 14 24
Bradford West Gwillimbury 62 $71,330,947 $1,150,499 $1,125,000 68 75.7% 32 0.7 112% 10 11
Essa 36 $34,083,125 $946,753 $837,500 28 86.1% 9 0.5 104% 14 18
Innisfil 84 $96,750,019 $1,151,786 $948,000 95 73.9% 66 1.0 104% 21 25
New Tecumseth 68 $73,770,007 $1,084,853 $932,500 68 81.1% 28 0.7 104% 16 20
Sub_Municipality # of Sales Dollar Volume Average Price Median Price New Listings SNLR (Trend) Active Listings Mos Inv (Trend) Avg. SP/LP Avg. LDOM Avg. PDOM
Toronto Regional Real Estate Board
SUMMARY OF EXISTING HOME TRANSACTIONS
ALL TRREB AREAS
ALL HOME TYPES, NOVEMBER 2021
1 1 1 2 8 3 9 4 5
3
Market Watch, November 2021
Copyright® 2021 Toronto Regional Real Estate Board
5
TRREB Total 9,017 $10,489,684,676 $1,163,323 $999,999 10,036 73.5% 6,086 0.9 108% 13 18
City of Toronto Total 3,587 $3,933,993,086 $1,096,736 $840,000 4,249 69.2% 3,342 1.2 106% 17 23
Toronto West 883 $893,499,903 $1,011,891 $900,000 1,024 71.0% 718 1.0 108% 16 22
Toronto W01 46 $52,687,392 $1,145,378 $757,500 52 72.6% 41 0.8 108% 13 22
Toronto W02 77 $99,438,500 $1,291,409 $1,250,000 116 70.7% 60 0.7 113% 11 15
Toronto W03 62 $62,996,952 $1,016,080 $995,450 72 66.4% 46 1.0 112% 11 28
Toronto W04 99 $90,079,300 $909,892 $878,000 119 66.6% 98 1.3 106% 18 24
Toronto W05 112 $95,959,805 $856,784 $922,500 139 71.1% 102 1.1 107% 18 23
Toronto W06 139 $129,179,280 $929,347 $800,000 168 67.9% 166 1.2 105% 17 25
Toronto W07 29 $48,161,420 $1,660,739 $1,700,000 36 71.1% 19 1.0 105% 14 16
Toronto W08 181 $193,050,066 $1,066,575 $708,000 176 76.9% 101 1.0 105% 17 21
Toronto W09 56 $59,658,027 $1,065,322 $1,227,500 65 69.7% 44 1.1 110% 17 22
Toronto W10 82 $62,289,161 $759,624 $600,000 81 74.3% 41 0.9 107% 18 22
Toronto Central 1,852 $2,168,182,494 $1,170,725 $775,000 2,306 66.0% 2,160 1.4 102% 19 27
Toronto C01 533 $506,350,170 $950,000 $748,000 739 68.1% 665 1.3 102% 19 27
Toronto C02 92 $166,242,850 $1,806,988 $1,271,090 132 55.5% 176 2.3 99% 22 30
Toronto C03 67 $115,720,726 $1,727,175 $1,200,000 75 59.4% 66 1.5 103% 22 27
Toronto C04 90 $173,048,544 $1,922,762 $1,845,056 97 66.9% 71 1.2 105% 16 23
Toronto C06 48 $55,199,300 $1,149,985 $1,057,500 46 65.6% 33 1.2 101% 16 23
Toronto C07 120 $149,960,187 $1,249,668 $841,000 133 66.9% 108 1.5 104% 18 29
Toronto C08 292 $247,502,210 $847,610 $720,000 367 64.0% 358 1.5 102% 22 32
Toronto C09 37 $107,996,890 $2,918,835 $1,680,000 48 63.0% 54 1.9 97% 25 36
Toronto C10 97 $102,322,422 $1,054,870 $789,000 103 69.1% 91 1.3 106% 16 25
Toronto C11 40 $47,947,690 $1,198,692 $652,400 47 66.0% 36 1.2 103% 19 25
Toronto C12 26 $96,450,550 $3,709,637 $2,825,000 45 51.8% 93 3.2 97% 19 26
Toronto C13 78 $84,931,754 $1,088,869 $855,000 107 67.5% 81 1.2 106% 19 26
Toronto C14 160 $162,516,243 $1,015,727 $691,500 169 68.1% 155 1.4 103% 17 24
Toronto C15 172 $151,992,958 $883,680 $691,250 198 70.1% 173 1.2 106% 17 22
Toronto East 852 $872,310,689 $1,023,839 $999,500 919 74.6% 464 0.7 112% 12 16
Toronto E01 65 $79,041,792 $1,216,028 $1,075,000 75 72.9% 29 0.7 112% 10 11
Toronto E02 69 $93,559,128 $1,355,929 $1,212,000 76 72.0% 41 0.7 110% 10 16
Toronto E03 90 $106,212,648 $1,180,141 $1,200,000 100 66.7% 77 0.9 110% 18 27
Toronto E04 107 $100,783,465 $941,902 $1,055,000 119 75.1% 52 0.7 116% 11 14
Toronto E05 91 $82,458,590 $906,138 $805,000 87 75.6% 48 0.9 113% 13 16
Toronto E06 34 $37,618,429 $1,106,424 $894,000 48 66.2% 40 1.0 107% 11 14
Toronto E07 98 $89,096,287 $909,146 $758,000 96 78.7% 28 0.7 116% 11 14
Toronto E08 62 $60,323,436 $972,959 $948,650 73 73.9% 42 0.9 110% 13 17
Toronto E09 128 $110,123,496 $860,340 $753,000 116 83.1% 40 0.6 113% 13 16
Toronto E10 53 $62,517,539 $1,179,576 $1,092,000 69 74.2% 36 0.8 113% 12 13
Toronto E11 55 $50,575,879 $919,561 $927,000 60 77.9% 31 0.7 111% 12 13
Municipality # of Sales Dollar Volume Average Price Median Price New Listings SNLR (Trend) Active Listings Mos Inv (Trend) Avg. SP/LP Avg. LDOM Avg. PDOM
Toronto Regional Real Estate Board
ALL HOME TYPES, NOVEMBER 2021
SUMMARY OF EXISTING HOME TRANSACTIONS
CITY OF TORONTO MUNICIPAL BREAKDOWN
1 1 1 2 8 3 9 4 5
4
Market Watch, November 2021
Copyright® 2021 Toronto Regional Real Estate Board
5
TRREB Total 115,716 $126,386,437,441 $1,092,212 $940,000 161,409 106% 13 18
Halton Region 11,310 $13,890,632,953 $1,228,173 $1,085,000 14,481 105% 11 14
Burlington 3,276 $3,531,831,840 $1,078,093 $977,359 4,068 106% 12 14
Halton Hills 1,076 $1,222,068,861 $1,135,752 $1,005,000 1,334 107% 10 12
Milton 2,795 $2,977,645,172 $1,065,347 $981,000 3,658 106% 9 12
Oakville 4,163 $6,159,087,080 $1,479,483 $1,300,000 5,421 104% 12 17
Peel Region 23,432 $24,489,625,216 $1,045,136 $950,000 31,800 105% 11 15
Brampton 11,387 $11,748,763,039 $1,031,770 $955,600 15,465 105% 9 13
Caledon 1,278 $1,853,086,261 $1,449,989 $1,300,000 1,876 103% 12 18
Mississauga 10,767 $10,887,775,916 $1,011,217 $890,000 14,459 105% 13 18
City of Toronto 41,133 $43,544,373,240 $1,058,624 $835,000 61,091 105% 16 22
Toronto West 10,346 $10,363,139,701 $1,001,657 $880,000 14,958 106% 15 20
Toronto Central 20,586 $23,008,903,611 $1,117,697 $765,000 32,063 103% 18 26
Toronto East 10,201 $10,172,329,928 $997,189 $950,000 14,070 111% 12 15
York Region 21,308 $27,374,117,965 $1,284,687 $1,184,995 30,468 106% 14 20
Aurora 1,335 $1,724,134,553 $1,291,487 $1,180,000 1,856 105% 14 18
East Gwillimbury 857 $1,083,033,376 $1,263,750 $1,198,000 1,157 107% 13 16
Georgina 1,223 $1,078,601,195 $881,931 $820,000 1,688 107% 14 17
King 536 $1,097,081,732 $2,046,794 $1,879,400 863 99% 27 37
Markham 5,407 $6,951,036,574 $1,285,563 $1,228,000 7,551 109% 13 18
Newmarket 1,821 $2,012,888,094 $1,105,375 $1,051,000 2,399 107% 10 13
Richmond Hill 3,856 $5,237,709,825 $1,358,327 $1,260,000 5,889 105% 16 22
Vaughan 5,254 $6,827,555,875 $1,299,497 $1,200,995 7,658 104% 15 21
Whitchurch-Stouffville 1,019 $1,362,076,741 $1,336,680 $1,200,000 1,407 105% 16 21
Durham Region 14,052 $12,936,983,133 $920,651 $857,839 17,743 113% 9 11
Ajax 2,047 $1,991,838,260 $973,052 $921,000 2,619 113% 8 10
Brock 293 $231,705,908 $790,805 $740,000 385 105% 13 17
Clarington 2,515 $2,218,304,923 $882,030 $825,000 3,073 115% 9 10
Oshawa 4,170 $3,306,114,727 $792,833 $760,000 5,226 115% 9 11
Pickering 1,753 $1,804,720,770 $1,029,504 $930,000 2,311 110% 10 12
Scugog 370 $364,867,271 $986,128 $897,893 482 108% 15 17
Uxbridge 350 $449,288,253 $1,283,681 $1,173,052 450 106% 15 18
Whitby 2,554 $2,570,143,021 $1,006,321 $951,000 3,197 114% 7 9
Dufferin County 693 $552,307,416 $796,980 $776,000 812 106% 10 12
Orangeville 693 $552,307,416 $796,980 $776,000 812 106% 10 12
Simcoe County 3,788 $3,598,397,518 $949,947 $870,750 5,014 104% 14 17
Adjala-Tosorontio 212 $249,488,691 $1,176,833 $1,049,000 283 102% 18 21
Bradford West Gwillimbury 886 $945,431,816 $1,067,079 $999,000 1,217 106% 11 14
Essa 473 $396,453,200 $838,167 $760,000 565 104% 12 14
Innisfil 1,226 $1,128,698,810 $920,635 $840,500 1,702 103% 16 20
New Tecumseth 991 $878,325,001 $886,302 $827,000 1,247 104% 13 16
Sub_Municipality Number of Sales Dollar Volume Average Price Median Price New Listings Avg. SP/LP Avg. LDOM Avg. PDOM
Toronto Regional Real Estate Board
SUMMARY OF EXISTING HOME TRANSACTIONS
ALL TRREB AREAS
ALL HOME TYPES, YEAR-TO-DATE 2021
1 1 1 2 4 5
5
Market Watch, November 2021
Copyright® 2021 Toronto Regional Real Estate Board
5
TRREB Total 115,716 $126,386,437,441 $1,092,212 $940,000 161,409 106% 13 18
City of Toronto Total 41,133 $43,544,373,240 $1,058,624 $835,000 61,091 105% 16 22
Toronto West 10,346 $10,363,139,701 $1,001,657 $880,000 14,958 106% 15 20
Toronto W01 625 $800,203,979 $1,280,326 $975,000 890 109% 12 16
Toronto W02 992 $1,238,493,526 $1,248,481 $1,200,000 1,436 112% 10 14
Toronto W03 733 $739,336,791 $1,008,645 $980,000 1,123 110% 14 20
Toronto W04 1,033 $904,079,476 $875,198 $815,000 1,606 106% 17 23
Toronto W05 1,399 $1,160,457,365 $829,491 $860,000 1,988 105% 16 21
Toronto W06 1,858 $1,699,159,989 $914,510 $800,000 2,819 104% 16 23
Toronto W07 290 $464,822,214 $1,602,835 $1,460,000 421 107% 13 19
Toronto W08 2,004 $2,185,413,503 $1,090,526 $720,000 2,671 104% 16 21
Toronto W09 539 $523,002,590 $970,320 $985,000 793 106% 16 22
Toronto W10 873 $648,170,268 $742,463 $620,000 1,211 105% 15 20
Toronto Central 20,586 $23,008,903,611 $1,117,697 $765,000 32,063 103% 18 26
Toronto C01 6,526 $5,647,897,700 $865,446 $723,000 9,852 103% 18 26
Toronto C02 1,003 $1,648,042,503 $1,643,113 $1,220,000 1,847 101% 22 32
Toronto C03 615 $1,026,918,784 $1,669,787 $1,279,000 1,064 104% 16 22
Toronto C04 992 $2,169,076,039 $2,186,569 $2,000,000 1,492 103% 15 21
Toronto C06 440 $493,308,908 $1,121,157 $807,500 696 103% 15 22
Toronto C07 1,332 $1,507,757,713 $1,131,950 $796,500 2,060 103% 19 27
Toronto C08 3,040 $2,426,580,850 $798,217 $692,500 4,925 103% 19 27
Toronto C09 353 $854,227,110 $2,419,907 $1,680,000 559 100% 24 32
Toronto C10 1,004 $1,016,192,255 $1,012,144 $766,850 1,476 104% 18 26
Toronto C11 515 $596,188,276 $1,157,647 $660,000 797 104% 15 23
Toronto C12 359 $1,214,437,562 $3,382,834 $2,850,000 714 98% 24 35
Toronto C13 811 $998,722,468 $1,231,470 $925,000 1,252 104% 17 22
Toronto C14 1,636 $1,660,994,382 $1,015,278 $709,190 2,447 102% 18 25
Toronto C15 1,960 $1,748,559,061 $892,122 $685,000 2,882 104% 17 23
Toronto East 10,201 $10,172,329,928 $997,189 $950,000 14,070 111% 12 15
Toronto E01 989 $1,232,149,209 $1,245,854 $1,232,500 1,409 115% 9 12
Toronto E02 797 $1,110,549,878 $1,393,413 $1,290,000 1,142 111% 10 14
Toronto E03 1,137 $1,370,500,322 $1,205,365 $1,185,000 1,740 111% 12 16
Toronto E04 1,167 $1,015,406,063 $870,099 $885,000 1,611 109% 12 16
Toronto E05 1,017 $915,768,458 $900,461 $800,000 1,380 111% 13 15
Toronto E06 429 $482,627,796 $1,125,007 $999,999 681 107% 11 15
Toronto E07 1,096 $930,562,303 $849,053 $770,050 1,433 111% 13 16
Toronto E08 708 $695,433,952 $982,251 $952,500 982 107% 13 18
Toronto E09 1,260 $989,900,891 $785,636 $686,500 1,535 110% 13 17
Toronto E10 698 $725,790,780 $1,039,815 $1,015,000 971 109% 12 15
Toronto E11 903 $703,640,276 $779,225 $780,000 1,186 108% 13 15
Municipality Number of Sales Dollar Volume Average Price Median Price New Listings Avg. SP/LP Avg. LDOM Avg. PDOM
Toronto Regional Real Estate Board
SUMMARY OF EXISTING HOME TRANSACTIONS
CITY OF TORONTO MUNICIPAL BREAKDOWN
ALL HOME TYPES, YEAR-TO-DATE 2021
1 1 1 2 4 5
6
Market Watch, November 2021
Copyright® 2021 Toronto Regional Real Estate Board
5
TRREB Total 3,857 $6,047,129,227 $1,567,832 $1,380,000 4,384 2,499 109% 12
Halton Region 411 $725,914,437 $1,766,215 $1,500,000 416 196 107% 11
Burlington 113 $167,382,019 $1,481,257 $1,350,000 121 52 109% 10
Halton Hills 55 $79,808,888 $1,451,071 $1,350,000 56 32 109% 13
Milton 83 $129,997,389 $1,566,234 $1,377,000 74 28 108% 10
Oakville 160 $348,726,141 $2,179,538 $1,768,500 165 84 105% 11
Peel Region 745 $1,108,657,942 $1,488,131 $1,390,999 847 400 108% 9
Brampton 426 $584,973,415 $1,373,177 $1,308,900 467 141 110% 7
Caledon 65 $114,122,500 $1,755,731 $1,625,000 78 84 102% 17
Mississauga 254 $409,562,027 $1,612,449 $1,480,000 302 175 108% 10
City of Toronto 918 $1,659,728,228 $1,807,983 $1,422,556 1,136 756 108% 13
Toronto West 288 $433,031,769 $1,503,583 $1,344,944 344 203 110% 12
Toronto Central 277 $746,516,355 $2,695,005 $2,227,000 385 384 102% 16
Toronto East 353 $480,180,104 $1,360,284 $1,262,000 407 169 114% 11
York Region 863 $1,522,397,637 $1,764,076 $1,630,000 1,033 759 108% 15
Aurora 52 $92,152,568 $1,772,165 $1,605,000 67 49 105% 17
East Gwillimbury 51 $72,164,777 $1,414,996 $1,450,000 66 39 113% 11
Georgina 74 $79,012,424 $1,067,735 $1,062,500 97 52 111% 10
King 29 $68,656,600 $2,367,469 $2,300,000 48 61 100% 18
Markham 178 $335,422,751 $1,884,397 $1,696,500 217 154 112% 11
Newmarket 87 $120,015,111 $1,379,484 $1,350,000 78 23 112% 8
Richmond Hill 172 $337,058,693 $1,959,644 $1,782,500 199 187 106% 21
Vaughan 171 $335,508,284 $1,962,037 $1,760,000 204 147 106% 17
Whitchurch-Stouffville 49 $82,406,429 $1,681,764 $1,562,000 57 47 105% 19
Durham Region 677 $750,453,037 $1,108,498 $1,071,000 701 248 119% 8
Ajax 94 $109,487,671 $1,164,762 $1,150,000 98 29 119% 6
Brock 14 $10,843,000 $774,500 $712,500 17 17 110% 6
Clarington 122 $125,264,560 $1,026,759 $995,000 123 45 122% 8
Oshawa 213 $205,352,608 $964,097 $930,000 206 58 121% 8
Pickering 65 $95,814,480 $1,474,069 $1,358,000 72 24 115% 11
Scugog 30 $29,829,765 $994,326 $917,633 36 19 116% 11
Uxbridge 17 $23,534,002 $1,384,353 $1,531,000 16 17 106% 11
Whitby 122 $150,326,951 $1,232,188 $1,189,000 133 39 119% 8
Dufferin County 33 $31,935,844 $967,753 $899,000 32 10 106% 7
Orangeville 33 $31,935,844 $967,753 $899,000 32 10 106% 7
Simcoe County 210 $248,042,102 $1,181,153 $1,071,500 219 130 105% 17
Adjala-Tosorontio 19 $21,938,300 $1,154,647 $1,000,000 19 13 102% 14
Bradford West Gwillimbury 45 $55,634,949 $1,236,332 $1,270,000 52 28 112% 10
Essa 30 $29,668,125 $988,938 $862,500 20 8 103% 16
Innisfil 73 $86,579,920 $1,186,026 $1,025,000 80 57 104% 21
New Tecumseth 43 $54,220,808 $1,260,949 $1,130,000 48 24 103% 18
Municipality Number of Sales Dollar Volume Average Price Median Price New Listings Active Listings Avg. SP/LP Avg. LDOM
DETACHED, NOVEMBER 2021
Toronto Regional Real Estate Board
SUMMARY OF EXISTING HOME TRANSACTIONS
ALL TRREB AREAS
1 1 2 4 5
1 1 3
7
Market Watch, November 2021
Copyright® 2021 Toronto Regional Real Estate Board
TRREB Total 3,857 $6,047,129,227 $1,567,832 $1,380,000 4,384 2,499 109% 12
City of Toronto 918 $1,659,728,228 $1,807,983 $1,422,556 1,136 756 108% 13
Toronto West 288 $433,031,769 $1,503,583 $1,344,944 344 203 110% 12
Toronto W01 10 $22,533,484 $2,253,348 $2,200,000 10 12 111% 11
Toronto W02 24 $41,908,000 $1,746,167 $1,733,000 40 27 119% 11
Toronto W03 35 $35,809,852 $1,023,139 $956,000 37 23 111% 10
Toronto W04 42 $52,611,500 $1,252,655 $1,195,000 51 42 110% 16
Toronto W05 28 $34,766,990 $1,241,678 $1,188,500 35 18 110% 12
Toronto W06 27 $39,896,840 $1,477,661 $1,488,000 32 17 111% 11
Toronto W07 18 $37,297,420 $2,072,079 $1,805,000 25 12 104% 14
Toronto W08 50 $99,444,130 $1,988,883 $1,540,150 54 29 106% 12
Toronto W09 29 $41,398,042 $1,427,519 $1,350,000 35 14 113% 12
Toronto W10 25 $27,365,511 $1,094,620 $1,120,000 25 9 110% 10
Toronto Central 277 $746,516,355 $2,695,005 $2,227,000 385 384 102% 16
Toronto C01 15 $34,502,000 $2,300,133 $2,227,000 13 7 103% 24
Toronto C02 8 $29,670,000 $3,708,750 $3,075,000 14 18 98% 15
Toronto C03 27 $70,321,488 $2,604,500 $1,801,888 36 28 103% 17
Toronto C04 51 $136,203,499 $2,670,657 $2,350,000 59 36 105% 13
Toronto C06 23 $39,250,900 $1,706,561 $1,589,900 24 14 101% 14
Toronto C07 40 $88,918,000 $2,222,950 $1,922,500 59 39 105% 10
Toronto C08 0 $0 $0 - 3 4 - -
Toronto C09 11 $56,815,000 $5,165,000 $5,500,000 11 9 96% 30
Toronto C10 10 $27,455,000 $2,745,500 $2,642,500 17 11 109% 11
Toronto C11 10 $28,575,680 $2,857,568 $2,539,090 13 6 103% 11
Toronto C12 19 $86,040,300 $4,528,437 $4,350,000 28 74 96% 21
Toronto C13 19 $39,989,000 $2,104,684 $1,800,000 36 35 105% 12
Toronto C14 26 $67,251,888 $2,586,611 $2,110,000 44 77 103% 22
Toronto C15 18 $41,523,600 $2,306,867 $2,016,000 28 26 106% 20
Toronto East 353 $480,180,104 $1,360,284 $1,262,000 407 169 114% 11
Toronto E01 12 $20,785,000 $1,732,083 $1,725,000 14 2 107% 9
Toronto E02 23 $42,516,443 $1,848,541 $1,670,500 24 11 115% 9
Toronto E03 47 $65,054,088 $1,384,130 $1,298,000 55 34 108% 21
Toronto E04 56 $66,061,307 $1,179,666 $1,158,000 74 29 121% 7
Toronto E05 26 $37,228,491 $1,431,865 $1,397,500 28 10 116% 10
Toronto E06 20 $26,701,900 $1,335,095 $1,177,500 27 13 107% 9
Toronto E07 29 $41,459,400 $1,429,634 $1,350,000 32 10 120% 7
Toronto E08 29 $40,189,736 $1,385,853 $1,340,000 40 22 112% 10
Toronto E09 58 $68,377,521 $1,178,923 $1,170,050 63 17 119% 7
Toronto E10 30 $44,524,839 $1,484,161 $1,396,944 29 14 113% 16
Toronto E11 23 $27,281,379 $1,186,147 $1,240,000 21 7 113% 12
Municipality Number of Sales Dollar Volume Average Price Median Price New Listings Active Listings Avg. SP/LP Avg. LDOM
DETACHED, NOVEMBER 2021
Toronto Regional Real Estate Board
SUMMARY OF EXISTING HOME TRANSACTIONS
CITY OF TORONTO MUNICIPAL BREAKDOWN
1 1 2 4 5
1 1 3
8
Market Watch, November 2021
Copyright® 2021 Toronto Regional Real Estate Board
TRREB Total 755 $910,542,450 $1,206,016 $1,120,111 805 250 113% 8
Halton Region 38 $43,300,664 $1,139,491 $1,140,500 35 6 118% 4
Burlington 7 $7,156,245 $1,022,321 $999,995 6 1 118% 6
Halton Hills 3 $2,716,500 $905,500 $925,000 2 0 121% 3
Milton 18 $20,647,919 $1,147,107 $1,140,500 19 4 116% 4
Oakville 10 $12,780,000 $1,278,000 $1,253,000 8 1 122% 4
Peel Region 239 $256,027,699 $1,071,246 $1,065,000 251 50 113% 6
Brampton 142 $148,497,854 $1,045,760 $1,047,500 156 32 113% 5
Caledon 2 $1,968,000 $984,000 $984,000 3 1 107% 3
Mississauga 95 $105,561,845 $1,111,177 $1,120,111 92 17 114% 7
City of Toronto 283 $405,252,470 $1,431,988 $1,215,000 307 146 110% 11
Toronto West 91 $108,873,973 $1,196,417 $1,150,000 97 37 111% 11
Toronto Central 101 $187,397,824 $1,855,424 $1,542,000 114 71 108% 12
Toronto East 91 $108,980,673 $1,197,590 $1,125,000 96 38 115% 9
York Region 108 $132,636,451 $1,228,115 $1,246,400 118 26 118% 6
Aurora 5 $6,543,000 $1,308,600 $1,336,000 8 4 129% 7
East Gwillimbury 2 $2,440,000 $1,220,000 $1,220,000 4 2 102% 3
Georgina 0 $0 $0 - 0 0 - -
King 0 $0 $0 - 2 1 - -
Markham 29 $38,063,600 $1,312,538 $1,305,000 28 3 120% 6
Newmarket 21 $21,236,200 $1,011,248 $950,000 21 4 112% 6
Richmond Hill 14 $17,246,500 $1,231,893 $1,272,500 13 5 112% 9
Vaughan 35 $44,714,151 $1,277,547 $1,275,000 40 6 121% 5
Whitchurch-Stouffville 2 $2,393,000 $1,196,500 $1,196,500 2 1 126% 5
Durham Region 67 $56,606,169 $844,868 $825,000 75 19 125% 7
Ajax 11 $11,253,500 $1,023,045 $1,050,000 12 2 125% 4
Brock 0 $0 $0 - 0 0 - -
Clarington 6 $4,911,500 $818,583 $825,750 7 2 131% 7
Oshawa 35 $26,635,069 $761,002 $777,000 36 9 125% 8
Pickering 6 $5,779,800 $963,300 $962,250 9 4 120% 5
Scugog 2 $1,492,000 $746,000 $746,000 1 0 121% 7
Uxbridge 0 $0 $0 - 0 0 - -
Whitby 7 $6,534,300 $933,471 $907,500 10 2 121% 4
Dufferin County 5 $3,575,000 $715,000 $700,000 3 0 103% 8
Orangeville 5 $3,575,000 $715,000 $700,000 3 0 103% 8
Simcoe County 15 $13,143,997 $876,266 $925,000 16 3 108% 9
Adjala-Tosorontio 0 $0 $0 - 0 0 - -
Bradford West Gwillimbury 8 $7,282,998 $910,375 $922,500 8 2 107% 9
Essa 0 $0 $0 - 1 1 - -
Innisfil 1 $940,000 $940,000 $940,000 2 0 111% 5
New Tecumseth 6 $4,920,999 $820,167 $847,500 5 0 108% 10
Municipality Number of Sales Dollar Volume Average Price Median Price New Listings Active Listings Avg. SP/LP Avg. LDOM
SEMI-DETACHED, NOVEMBER 2021
Toronto Regional Real Estate Board
SUMMARY OF EXISTING HOME TRANSACTIONS
ALL TRREB AREAS
1 1 2 4 5
1 1 3
9
Market Watch, November 2021
Copyright® 2021 Toronto Regional Real Estate Board
TRREB Total 755 $910,542,450 $1,206,016 $1,120,111 805 250 113% 8
City of Toronto 283 $405,252,470 $1,431,988 $1,215,000 307 146 110% 11
Toronto West 91 $108,873,973 $1,196,417 $1,150,000 97 37 111% 11
Toronto W01 5 $8,222,008 $1,644,402 $1,775,000 10 5 116% 11
Toronto W02 19 $25,861,210 $1,361,116 $1,411,000 23 7 107% 9
Toronto W03 20 $22,517,100 $1,125,855 $1,117,500 20 8 118% 10
Toronto W04 6 $7,644,000 $1,274,000 $1,090,000 3 1 103% 16
Toronto W05 27 $27,784,906 $1,029,071 $1,002,005 30 12 109% 14
Toronto W06 7 $8,701,000 $1,243,000 $1,215,000 6 2 113% 6
Toronto W07 0 $0 $0 - 0 0 - -
Toronto W08 1 $1,285,000 $1,285,000 $1,285,000 1 1 122% 5
Toronto W09 3 $3,647,699 $1,215,900 $1,265,000 1 0 108% 26
Toronto W10 3 $3,211,050 $1,070,350 $1,055,000 3 1 107% 6
Toronto Central 101 $187,397,824 $1,855,424 $1,542,000 114 71 108% 12
Toronto C01 23 $41,481,500 $1,803,543 $1,820,000 28 23 106% 17
Toronto C02 14 $47,868,000 $3,419,143 $3,072,500 16 13 102% 15
Toronto C03 8 $10,472,050 $1,309,006 $1,413,500 10 6 116% 9
Toronto C04 5 $8,110,100 $1,622,020 $1,450,000 6 3 122% 4
Toronto C06 0 $0 $0 - 0 1 - -
Toronto C07 4 $4,465,000 $1,116,250 $1,140,000 3 3 105% 14
Toronto C08 6 $10,948,887 $1,824,815 $1,842,500 7 7 102% 17
Toronto C09 4 $17,639,000 $4,409,750 $3,324,500 2 1 101% 26
Toronto C10 10 $16,783,000 $1,678,300 $1,605,000 12 8 123% 5
Toronto C11 1 $1,485,000 $1,485,000 $1,485,000 0 0 93% 61
Toronto C12 0 $0 $0 - 0 0 - -
Toronto C13 13 $13,358,999 $1,027,615 $1,006,000 12 1 114% 5
Toronto C14 1 $1,120,000 $1,120,000 $1,120,000 1 0 113% 13
Toronto C15 12 $13,666,288 $1,138,857 $1,135,000 17 5 114% 7
Toronto East 91 $108,980,673 $1,197,590 $1,125,000 96 38 115% 9
Toronto E01 16 $19,846,367 $1,240,398 $1,180,000 16 7 114% 7
Toronto E02 20 $28,419,385 $1,420,969 $1,427,753 18 8 111% 8
Toronto E03 24 $29,760,410 $1,240,017 $1,307,500 21 7 119% 11
Toronto E04 6 $5,754,000 $959,000 $923,000 6 4 108% 10
Toronto E05 4 $4,506,000 $1,126,500 $1,137,500 5 2 127% 6
Toronto E06 5 $4,270,500 $854,100 $851,400 6 2 114% 8
Toronto E07 6 $6,538,000 $1,089,667 $1,093,000 8 1 125% 3
Toronto E08 1 $905,800 $905,800 $905,800 2 1 121% 9
Toronto E09 2 $2,216,000 $1,108,000 $1,108,000 5 3 117% 5
Toronto E10 3 $2,744,000 $914,667 $995,000 4 1 108% 8
Toronto E11 4 $4,020,211 $1,005,053 $966,106 5 2 110% 18
Municipality Number of Sales Dollar Volume Average Price Median Price New Listings Active Listings Avg. SP/LP Avg. LDOM
SEMI-DETACHED, NOVEMBER 2021
Toronto Regional Real Estate Board
SUMMARY OF EXISTING HOME TRANSACTIONS
CITY OF TORONTO MUNICIPAL BREAKDOWN
1 1 2 4 5
1 1 3
10
Market Watch, November 2021
Copyright® 2021 Toronto Regional Real Estate Board
TRREB Total 730 $799,765,816 $1,095,570 $1,022,500 783 266 114% 8
Halton Region 133 $152,973,632 $1,150,178 $1,075,000 139 32 113% 6
Burlington 18 $19,368,230 $1,076,013 $1,024,500 14 3 118% 5
Halton Hills 5 $4,807,000 $961,400 $975,000 5 2 111% 7
Milton 54 $55,423,428 $1,026,360 $1,000,000 69 19 114% 4
Oakville 56 $73,374,974 $1,310,267 $1,230,000 51 8 111% 9
Peel Region 149 $145,061,498 $973,567 $970,000 154 32 113% 6
Brampton 112 $106,496,910 $950,865 $951,056 119 25 113% 5
Caledon 14 $14,174,999 $1,012,500 $1,031,000 14 3 113% 4
Mississauga 23 $24,389,589 $1,060,417 $1,050,000 21 4 111% 8
City of Toronto 116 $148,422,512 $1,279,504 $1,191,444 131 81 112% 13
Toronto West 38 $45,036,839 $1,185,180 $1,210,000 39 18 110% 11
Toronto Central 39 $60,301,680 $1,546,197 $1,371,180 55 49 108% 19
Toronto East 39 $43,083,993 $1,104,718 $1,030,500 37 14 121% 9
York Region 185 $223,270,875 $1,206,870 $1,201,000 215 80 116% 9
Aurora 7 $7,677,000 $1,096,714 $1,125,000 9 3 114% 6
East Gwillimbury 5 $5,067,900 $1,013,580 $947,900 6 1 111% 3
Georgina 2 $1,659,500 $829,750 $829,750 2 1 103% 6
King 3 $3,403,000 $1,134,333 $885,000 2 0 114% 10
Markham 52 $68,877,841 $1,324,574 $1,321,444 65 28 118% 13
Newmarket 21 $21,841,609 $1,040,077 $1,030,110 15 5 110% 15
Richmond Hill 45 $55,671,405 $1,237,142 $1,252,000 46 15 121% 6
Vaughan 42 $50,864,820 $1,211,067 $1,200,500 58 24 112% 7
Whitchurch-Stouffville 8 $8,207,800 $1,025,975 $1,057,900 12 3 120% 4
Durham Region 111 $99,056,899 $892,404 $910,000 113 37 120% 6
Ajax 21 $19,646,980 $935,570 $950,000 22 10 115% 6
Brock 0 $0 $0 - 0 0 - -
Clarington 15 $12,686,700 $845,780 $845,000 18 7 129% 5
Oshawa 22 $16,634,680 $756,122 $827,278 19 6 121% 6
Pickering 13 $12,229,043 $940,696 $945,000 9 1 118% 6
Scugog 0 $0 $0 - 2 5 - -
Uxbridge 0 $0 $0 - 2 1 - -
Whitby 40 $37,859,496 $946,487 $954,000 41 7 120% 6
Dufferin County 6 $4,749,000 $791,500 $782,000 5 0 106% 9
Orangeville 6 $4,749,000 $791,500 $782,000 5 0 106% 9
Simcoe County 30 $26,231,400 $874,380 $860,100 26 4 112% 7
Adjala-Tosorontio 0 $0 $0 - 0 0 - -
Bradford West Gwillimbury 7 $6,816,000 $973,714 $999,000 6 1 116% 10
Essa 4 $2,827,000 $706,750 $745,500 5 0 110% 4
Innisfil 7 $6,735,200 $962,171 $910,000 7 2 110% 7
New Tecumseth 12 $9,853,200 $821,100 $840,000 8 1 111% 7
Municipality Number of Sales Dollar Volume Average Price Median Price New Listings Active Listings Avg. SP/LP Avg. LDOM
ATT/ROW/TWNHOUSE, NOVEMBER 2021
Toronto Regional Real Estate Board
SUMMARY OF EXISTING HOME TRANSACTIONS
ALL TRREB AREAS
1 1 2 4 5
1 1 3
11
Market Watch, November 2021
Copyright® 2021 Toronto Regional Real Estate Board
TRREB Total 730 $799,765,816 $1,095,570 $1,022,500 783 266 114% 8
City of Toronto 116 $148,422,512 $1,279,504 $1,191,444 131 81 112% 13
Toronto West 38 $45,036,839 $1,185,180 $1,210,000 39 18 110% 11
Toronto W01 2 $2,700,000 $1,350,000 $1,350,000 4 3 111% 8
Toronto W02 8 $10,126,751 $1,265,844 $1,215,750 11 4 116% 10
Toronto W03 1 $678,000 $678,000 $678,000 1 2 97% 51
Toronto W04 1 $1,090,000 $1,090,000 $1,090,000 1 1 99% 0
Toronto W05 9 $8,551,088 $950,121 $935,000 7 4 107% 12
Toronto W06 3 $3,762,500 $1,254,167 $1,275,500 4 1 112% 5
Toronto W07 4 $5,500,000 $1,375,000 $1,355,000 3 1 118% 10
Toronto W08 7 $9,183,000 $1,311,857 $1,310,000 5 1 107% 15
Toronto W09 1 $1,250,000 $1,250,000 $1,250,000 1 1 98% 5
Toronto W10 2 $2,195,500 $1,097,750 $1,097,750 2 0 107% 4
Toronto Central 39 $60,301,680 $1,546,197 $1,371,180 55 49 108% 19
Toronto C01 12 $18,788,180 $1,565,682 $1,465,000 20 21 108% 14
Toronto C02 6 $9,834,000 $1,639,000 $1,314,000 5 6 104% 16
Toronto C03 1 $2,925,000 $2,925,000 $2,925,000 1 2 98% 66
Toronto C04 2 $2,636,000 $1,318,000 $1,318,000 0 2 98% 22
Toronto C06 1 $1,275,000 $1,275,000 $1,275,000 1 0 116% 6
Toronto C07 1 $1,005,500 $1,005,500 $1,005,500 3 2 113% 2
Toronto C08 10 $16,112,000 $1,611,200 $1,530,000 11 9 110% 16
Toronto C09 0 $0 $0 - 1 1 - -
Toronto C10 0 $0 $0 - 0 0 - -
Toronto C11 1 $1,347,000 $1,347,000 $1,347,000 1 0 135% 6
Toronto C12 0 $0 $0 - 0 0 - -
Toronto C13 2 $2,322,000 $1,161,000 $1,161,000 4 1 119% 20
Toronto C14 3 $4,057,000 $1,352,333 $1,340,000 8 5 105% 47
Toronto C15 0 $0 $0 - 0 0 - -
Toronto East 39 $43,083,993 $1,104,718 $1,030,500 37 14 121% 9
Toronto E01 12 $16,180,575 $1,348,381 $1,348,750 14 7 128% 7
Toronto E02 2 $2,240,000 $1,120,000 $1,120,000 3 1 119% 5
Toronto E03 1 $980,000 $980,000 $980,000 1 0 115% 2
Toronto E04 6 $6,161,788 $1,026,965 $1,032,450 6 2 111% 14
Toronto E05 0 $0 $0 - 2 2 - -
Toronto E06 1 $875,030 $875,030 $875,030 1 0 113% 13
Toronto E07 4 $4,488,600 $1,122,150 $1,114,300 3 1 132% 9
Toronto E08 0 $0 $0 - 0 0 - -
Toronto E09 1 $940,000 $940,000 $940,000 1 0 118% 8
Toronto E10 5 $4,721,000 $944,200 $945,000 2 0 112% 9
Toronto E11 7 $6,497,000 $928,143 $928,000 4 1 117% 9
Municipality Number of Sales Dollar Volume Average Price Median Price New Listings Active Listings Avg. SP/LP Avg. LDOM
ATT/ROW/TWNHOUSE, NOVEMBER 2021
Toronto Regional Real Estate Board
SUMMARY OF EXISTING HOME TRANSACTIONS
CITY OF TORONTO MUNICIPAL BREAKDOWN
1 1 2 4 5
1 1 3
12
Market Watch, November 2021
Copyright® 2021 Toronto Regional Real Estate Board
TRREB Total 719 $594,235,456 $826,475 $800,000 714 329 110% 13
Halton Region 80 $63,986,360 $799,830 $760,250 79 21 110% 7
Burlington 37 $29,647,409 $801,281 $730,000 34 6 109% 7
Halton Hills 2 $1,391,000 $695,500 $695,500 2 1 118% 6
Milton 12 $9,345,906 $778,826 $783,550 11 4 109% 5
Oakville 29 $23,602,045 $813,864 $760,000 32 10 111% 7
Peel Region 211 $173,735,244 $823,390 $820,000 194 60 110% 14
Brampton 70 $54,474,422 $778,206 $781,500 60 11 112% 11
Caledon 1 $852,001 $852,001 $852,001 1 1 105% 5
Mississauga 140 $118,408,821 $845,777 $830,503 133 48 109% 15
City of Toronto 265 $225,627,635 $851,425 $812,000 285 188 108% 16
Toronto West 85 $66,714,426 $784,876 $706,500 110 75 107% 18
Toronto Central 92 $90,288,638 $981,398 $888,750 104 84 106% 18
Toronto East 88 $68,624,571 $779,825 $800,000 71 29 111% 12
York Region 82 $73,705,579 $898,849 $861,000 83 41 110% 14
Aurora 13 $10,586,999 $814,385 $788,000 9 5 107% 21
East Gwillimbury 0 $0 $0 - 1 1 - -
Georgina 1 $665,000 $665,000 $665,000 2 1 111% 6
King 0 $0 $0 - 0 0 - -
Markham 29 $27,581,493 $951,086 $915,000 33 13 111% 10
Newmarket 9 $7,716,517 $857,391 $862,000 10 1 114% 9
Richmond Hill 9 $9,127,000 $1,014,111 $893,000 10 11 113% 10
Vaughan 19 $16,686,570 $878,241 $850,000 16 8 108% 19
Whitchurch-Stouffville 2 $1,342,000 $671,000 $671,000 2 1 104% 7
Durham Region 75 $53,505,238 $713,403 $696,000 69 18 120% 7
Ajax 8 $6,212,500 $776,563 $780,000 5 1 122% 12
Brock 0 $0 $0 - 0 0 - -
Clarington 7 $5,005,900 $715,129 $625,000 4 0 124% 7
Oshawa 31 $20,335,338 $655,979 $670,000 28 6 124% 6
Pickering 19 $14,259,500 $750,500 $751,500 22 5 115% 7
Scugog 1 $826,000 $826,000 $826,000 0 0 127% 6
Uxbridge 1 $1,290,000 $1,290,000 $1,290,000 2 2 99% 18
Whitby 8 $5,576,000 $697,000 $685,000 8 4 120% 8
Dufferin County 4 $2,282,500 $570,625 $570,000 3 1 105% 11
Orangeville 4 $2,282,500 $570,625 $570,000 3 1 105% 11
Simcoe County 2 $1,392,900 $696,450 $696,450 1 0 109% 64
Adjala-Tosorontio 0 $0 $0 - 0 0 - -
Bradford West Gwillimbury 1 $707,000 $707,000 $707,000 1 0 118% 2
Essa 0 $0 $0 - 0 0 - -
Innisfil 1 $685,900 $685,900 $685,900 0 0 101% 126
New Tecumseth 0 $0 $0 - 0 0 - -
Municipality Number of Sales Dollar Volume Average Price Median Price New Listings Active Listings Avg. SP/LP Avg. LDOM
CONDO TOWNHOUSE, NOVEMBER 2021
Toronto Regional Real Estate Board
SUMMARY OF EXISTING HOME TRANSACTIONS
ALL TRREB AREAS
1 1 2 4 5
1 1 3
13
Market Watch, November 2021
Copyright® 2021 Toronto Regional Real Estate Board
TRREB Total 719 $594,235,456 $826,475 $800,000 714 329 110% 13
City of Toronto 265 $225,627,635 $851,425 $812,000 285 188 108% 16
Toronto West 85 $66,714,426 $784,876 $706,500 110 75 107% 18
Toronto W01 3 $1,876,000 $625,333 $689,000 3 1 101% 15
Toronto W02 6 $6,360,750 $1,060,125 $1,065,250 12 7 118% 5
Toronto W03 1 $760,000 $760,000 $760,000 5 4 96% 7
Toronto W04 11 $7,569,100 $688,100 $705,000 13 10 102% 23
Toronto W05 18 $11,492,900 $638,494 $649,500 25 22 105% 19
Toronto W06 10 $8,646,888 $864,689 $915,500 17 16 107% 10
Toronto W07 0 $0 $0 - 0 0 - -
Toronto W08 21 $18,928,888 $901,376 $905,000 21 10 108% 22
Toronto W09 6 $5,449,000 $908,167 $915,000 5 1 110% 15
Toronto W10 9 $5,630,900 $625,656 $600,000 9 4 109% 18
Toronto Central 92 $90,288,638 $981,398 $888,750 104 84 106% 18
Toronto C01 20 $19,438,000 $971,900 $965,000 20 17 105% 15
Toronto C02 1 $1,365,000 $1,365,000 $1,365,000 3 10 99% 53
Toronto C03 3 $3,812,000 $1,270,667 $1,355,000 0 0 95% 52
Toronto C04 0 $0 $0 - 0 0 - -
Toronto C06 1 $910,000 $910,000 $910,000 0 0 107% 31
Toronto C07 11 $9,913,000 $901,182 $855,000 7 6 106% 20
Toronto C08 5 $7,049,000 $1,409,800 $1,440,000 12 14 95% 29
Toronto C09 2 $3,454,900 $1,727,450 $1,727,450 1 2 115% 39
Toronto C10 2 $2,469,000 $1,234,500 $1,234,500 4 4 97% 40
Toronto C11 3 $2,203,000 $734,333 $815,000 1 2 102% 25
Toronto C12 4 $5,110,250 $1,277,563 $1,290,125 7 3 110% 8
Toronto C13 5 $4,414,000 $882,800 $861,000 5 1 114% 9
Toronto C14 13 $10,653,800 $819,523 $695,000 12 10 102% 14
Toronto C15 22 $19,496,688 $886,213 $822,500 32 15 113% 11
Toronto East 88 $68,624,571 $779,825 $800,000 71 29 111% 12
Toronto E01 3 $3,217,551 $1,072,517 $1,061,000 5 3 107% 7
Toronto E02 4 $4,437,500 $1,109,375 $1,023,750 4 2 100% 6
Toronto E03 1 $599,999 $599,999 $599,999 1 2 97% 97
Toronto E04 6 $5,154,800 $859,133 $843,000 5 1 114% 8
Toronto E05 27 $21,627,533 $801,020 $810,000 16 2 112% 9
Toronto E06 0 $0 $0 - 5 5 - -
Toronto E07 8 $6,705,500 $838,188 $854,750 7 0 115% 14
Toronto E08 8 $5,304,000 $663,000 $647,500 6 4 109% 21
Toronto E09 12 $7,554,999 $629,583 $642,500 5 3 110% 14
Toronto E10 10 $7,697,300 $769,730 $768,000 13 4 119% 5
Toronto E11 9 $6,325,389 $702,821 $690,000 4 3 110% 9
Municipality Number of Sales Dollar Volume Average Price Median Price New Listings Active Listings Avg. SP/LP Avg. LDOM
CONDO TOWNHOUSE, NOVEMBER 2021
Toronto Regional Real Estate Board
SUMMARY OF EXISTING HOME TRANSACTIONS
CITY OF TORONTO MUNICIPAL BREAKDOWN
1 1 2 4 5
1 1 3
14
Market Watch, November 2021
Copyright® 2021 Toronto Regional Real Estate Board
TRREB Total 2,868 $2,050,917,972 $715,104 $636,250 3,245 2,689 102% 18
Halton Region 129 $88,815,102 $688,489 $645,000 140 90 102% 15
Burlington 44 $29,530,122 $671,139 $597,278 60 32 103% 14
Halton Hills 2 $1,268,000 $634,000 $634,000 6 4 106% 3
Milton 26 $17,229,900 $662,688 $650,450 20 9 103% 15
Oakville 57 $40,787,080 $715,563 $645,000 54 45 101% 17
Peel Region 365 $221,178,491 $605,968 $582,900 353 199 103% 15
Brampton 66 $36,302,500 $550,038 $535,000 51 22 103% 14
Caledon 1 $779,000 $779,000 $779,000 4 3 100% 4
Mississauga 298 $184,096,991 $617,775 $590,750 298 174 103% 15
City of Toronto 1,981 $1,477,728,423 $745,951 $648,000 2,356 2,136 102% 20
Toronto West 372 $234,612,596 $630,679 $598,444 425 375 102% 20
Toronto Central 1,333 $1,076,321,479 $807,443 $690,000 1,631 1,550 101% 20
Toronto East 276 $166,794,348 $604,327 $565,000 300 211 104% 16
York Region 320 $222,665,977 $695,831 $662,750 318 214 104% 16
Aurora 9 $6,631,988 $736,888 $738,000 11 5 103% 9
East Gwillimbury 1 $476,250 $476,250 $476,250 0 0 100% 34
Georgina 1 $386,000 $386,000 $386,000 3 10 102% 11
King 3 $1,838,000 $612,667 $620,000 2 0 101% 32
Markham 106 $77,197,086 $728,274 $685,500 93 50 105% 14
Newmarket 5 $2,861,000 $572,200 $605,000 4 1 103% 11
Richmond Hill 81 $53,727,364 $663,301 $642,500 72 35 104% 16
Vaughan 107 $74,517,789 $696,428 $670,000 126 110 102% 17
Whitchurch-Stouffville 7 $5,030,500 $718,643 $650,000 7 3 103% 20
Durham Region 65 $35,719,980 $549,538 $560,000 69 40 109% 17
Ajax 5 $3,084,900 $616,980 $560,000 8 4 106% 10
Brock 0 $0 $0 - 0 0 - -
Clarington 15 $8,732,980 $582,199 $552,000 14 7 109% 16
Oshawa 19 $7,254,100 $381,795 $420,000 11 11 105% 30
Pickering 15 $9,603,000 $640,200 $620,000 23 15 108% 11
Scugog 1 $679,000 $679,000 $679,000 0 0 99% 34
Uxbridge 0 $0 $0 - 0 0 - -
Whitby 10 $6,366,000 $636,600 $620,000 13 3 117% 8
Dufferin County 3 $1,449,000 $483,000 $395,000 1 0 100% 23
Orangeville 3 $1,449,000 $483,000 $395,000 1 0 100% 23
Simcoe County 5 $3,360,999 $672,200 $590,000 8 10 98% 35
Adjala-Tosorontio 0 $0 $0 - 0 0 - -
Bradford West Gwillimbury 0 $0 $0 - 0 1 - -
Essa 0 $0 $0 - 0 0 - -
Innisfil 2 $1,808,999 $904,500 $904,500 6 7 98% 22
New Tecumseth 3 $1,552,000 $517,333 $537,000 2 2 99% 44
Municipality Number of Sales Dollar Volume Average Price Median Price New Listings Active Listings Avg. SP/LP Avg. LDOM
CONDO APT, NOVEMBER 2021
Toronto Regional Real Estate Board
SUMMARY OF EXISTING HOME TRANSACTIONS
ALL TRREB AREAS
1 1 2 4 5
1 1 3
15
Market Watch, November 2021
Copyright® 2021 Toronto Regional Real Estate Board
TRREB Total 2,868 $2,050,917,972 $715,104 $636,250 3,245 2,689 102% 18
City of Toronto 1,981 $1,477,728,423 $745,951 $648,000 2,356 2,136 102% 20
Toronto West 372 $234,612,596 $630,679 $598,444 425 375 102% 20
Toronto W01 25 $16,625,900 $665,036 $645,000 25 20 103% 14
Toronto W02 20 $15,181,789 $759,089 $660,000 29 14 106% 14
Toronto W03 5 $3,232,000 $646,400 $737,000 9 9 105% 14
Toronto W04 39 $21,164,700 $542,685 $540,000 51 44 102% 21
Toronto W05 29 $12,997,921 $448,204 $444,000 42 46 101% 30
Toronto W06 90 $67,348,152 $748,313 $703,000 105 125 101% 20
Toronto W07 6 $4,815,000 $802,500 $724,500 8 6 104% 11
Toronto W08 101 $63,737,648 $631,066 $610,000 94 57 103% 18
Toronto W09 16 $7,498,286 $468,643 $435,393 22 27 98% 22
Toronto W10 41 $22,011,200 $536,859 $539,800 40 27 101% 25
Toronto Central 1,333 $1,076,321,479 $807,443 $690,000 1,631 1,550 101% 20
Toronto C01 463 $392,140,490 $846,956 $728,000 657 595 102% 19
Toronto C02 62 $77,075,850 $1,243,159 $877,500 93 127 98% 24
Toronto C03 28 $28,190,188 $1,006,792 $730,000 25 26 99% 25
Toronto C04 29 $24,476,927 $844,032 $720,800 28 27 102% 25
Toronto C06 23 $13,763,400 $598,409 $576,000 21 18 100% 18
Toronto C07 64 $45,658,687 $713,417 $649,000 61 58 102% 24
Toronto C08 270 $212,867,823 $788,399 $699,500 333 321 101% 22
Toronto C09 16 $25,637,990 $1,602,374 $802,500 26 34 97% 20
Toronto C10 75 $55,615,422 $741,539 $720,000 70 68 101% 17
Toronto C11 25 $14,337,010 $573,480 $550,000 32 28 102% 20
Toronto C12 3 $5,300,000 $1,766,667 $1,950,000 10 16 91% 27
Toronto C13 39 $24,847,755 $637,122 $608,000 50 42 101% 28
Toronto C14 116 $79,103,555 $681,927 $660,000 104 63 103% 16
Toronto C15 120 $77,306,382 $644,220 $611,250 121 127 104% 19
Toronto East 276 $166,794,348 $604,327 $565,000 300 211 104% 16
Toronto E01 22 $19,012,299 $864,195 $761,500 26 10 107% 14
Toronto E02 20 $15,945,800 $797,290 $724,500 25 17 101% 13
Toronto E03 17 $9,818,151 $577,538 $475,000 22 34 100% 19
Toronto E04 32 $17,201,570 $537,549 $549,000 28 16 105% 17
Toronto E05 34 $19,096,566 $561,664 $579,995 36 32 104% 19
Toronto E06 8 $5,770,999 $721,375 $700,500 9 20 101% 20
Toronto E07 48 $26,606,787 $554,308 $549,500 42 15 106% 14
Toronto E08 24 $13,923,900 $580,163 $529,950 24 15 105% 14
Toronto E09 55 $31,034,976 $564,272 $550,000 42 17 103% 18
Toronto E10 5 $2,830,400 $566,080 $565,000 21 17 103% 8
Toronto E11 11 $5,552,900 $504,809 $520,000 25 18 101% 17
Municipality Number of Sales Dollar Volume Average Price Median Price New Listings Active Listings Avg. SP/LP Avg. LDOM
CONDO APT, NOVEMBER 2021
Toronto Regional Real Estate Board
SUMMARY OF EXISTING HOME TRANSACTIONS
CITY OF TORONTO MUNICIPAL BREAKDOWN
1 1 2 4 5
1 1 3
16
Market Watch, November 2021
Copyright® 2021 Toronto Regional Real Estate Board
TRREB Total 62 $69,148,937 $1,115,305 $1,100,000 70 12 119% 6
Halton Region 5 $6,286,439 $1,257,288 $1,366,000 5 1 122% 5
Burlington 3 $3,355,999 $1,118,666 $999,999 2 0 127% 3
Halton Hills 0 $0 $0 - 0 0 - -
Milton 0 $0 $0 - 0 0 - -
Oakville 2 $2,930,440 $1,465,220 $1,465,220 3 1 117% 7
Peel Region 7 $7,200,100 $1,028,586 $999,900 9 3 112% 4
Brampton 5 $5,310,100 $1,062,020 $1,115,100 8 3 115% 3
Caledon 1 $950,000 $950,000 $950,000 1 0 107% 1
Mississauga 1 $940,000 $940,000 $940,000 0 0 104% 12
City of Toronto 5 $5,173,000 $1,034,600 $1,025,000 7 1 115% 8
Toronto West 2 $1,875,000 $937,500 $937,500 2 0 121% 9
Toronto Central 0 $0 $0 - 0 0 - -
Toronto East 3 $3,298,000 $1,099,333 $1,100,000 5 1 112% 7
York Region 23 $30,999,888 $1,347,821 $1,386,000 27 5 121% 7
Aurora 0 $0 $0 - 0 0 - -
East Gwillimbury 0 $0 $0 - 0 0 - -
Georgina 1 $1,190,000 $1,190,000 $1,190,000 1 0 119% 12
King 0 $0 $0 - 0 0 - -
Markham 17 $23,356,888 $1,373,935 $1,386,000 20 3 123% 6
Newmarket 0 $0 $0 - 0 0 - -
Richmond Hill 3 $4,100,000 $1,366,667 $1,412,000 3 1 114% 7
Vaughan 2 $2,353,000 $1,176,500 $1,176,500 3 1 112% 9
Whitchurch-Stouffville 0 $0 $0 - 0 0 - -
Durham Region 18 $16,234,510 $901,917 $857,500 16 2 120% 6
Ajax 3 $2,816,110 $938,703 $986,000 2 0 115% 7
Brock 0 $0 $0 - 0 0 - -
Clarington 5 $4,044,000 $808,800 $840,000 6 1 125% 8
Oshawa 4 $3,125,000 $781,250 $775,000 4 0 112% 5
Pickering 0 $0 $0 - 0 0 - -
Scugog 0 $0 $0 - 0 0 - -
Uxbridge 0 $0 $0 - 1 1 - -
Whitby 6 $6,249,400 $1,041,567 $1,085,500 3 0 125% 6
Dufferin County 0 $0 $0 - 0 0 - -
Orangeville 0 $0 $0 - 0 0 - -
Simcoe County 4 $3,255,000 $813,750 $833,500 6 0 109% 3
Adjala-Tosorontio 0 $0 $0 - 0 0 - -
Bradford West Gwillimbury 1 $890,000 $890,000 $890,000 1 0 115% 3
Essa 2 $1,588,000 $794,000 $794,000 2 0 106% 4
Innisfil 0 $0 $0 - 0 0 - -
New Tecumseth 1 $777,000 $777,000 $777,000 3 0 111% 1
Municipality Number of Sales Dollar Volume Average Price Median Price New Listings Active Listings Avg. SP/LP Avg. LDOM
LINK, NOVEMBER 2021
Toronto Regional Real Estate Board
SUMMARY OF EXISTING HOME TRANSACTIONS
ALL TRREB AREAS
1 1 2 4 5
1 1 3
17
Market Watch, November 2021
Copyright®
2021 Toronto Regional Real Estate Board
TRREB Total 62 $69,148,937 $1,115,305 $1,100,000 70 12 119% 6
City of Toronto 5 $5,173,000 $1,034,600 $1,025,000 7 1 115% 8
Toronto West 2 $1,875,000 $937,500 $937,500 2 0 121% 9
Toronto W01 0 $0 $0 - 0 0 - -
Toronto W02 0 $0 $0 - 0 0 - -
Toronto W03 0 $0 $0 - 0 0 - -
Toronto W04 0 $0 $0 - 0 0 - -
Toronto W05 0 $0 $0 - 0 0 - -
Toronto W06 0 $0 $0 - 0 0 - -
Toronto W07 0 $0 $0 - 0 0 - -
Toronto W08 0 $0 $0 - 0 0 - -
Toronto W09 0 $0 $0 - 0 0 - -
Toronto W10 2 $1,875,000 $937,500 $937,500 2 0 121% 9
Toronto Central 0 $0 $0 - 0 0 - -
Toronto C01 0 $0 $0 - 0 0 - -
Toronto C02 0 $0 $0 - 0 0 - -
Toronto C03 0 $0 $0 - 0 0 - -
Toronto C04 0 $0 $0 - 0 0 - -
Toronto C06 0 $0 $0 - 0 0 - -
Toronto C07 0 $0 $0 - 0 0 - -
Toronto C08 0 $0 $0 - 0 0 - -
Toronto C09 0 $0 $0 - 0 0 - -
Toronto C10 0 $0 $0 - 0 0 - -
Toronto C11 0 $0 $0 - 0 0 - -
Toronto C12 0 $0 $0 - 0 0 - -
Toronto C13 0 $0 $0 - 0 0 - -
Toronto C14 0 $0 $0 - 0 0 - -
Toronto C15 0 $0 $0 - 0 0 - -
Toronto East 3 $3,298,000 $1,099,333 $1,100,000 5 1 112% 7
Toronto E01 0 $0 $0 - 0 0 - -
Toronto E02 0 $0 $0 - 0 0 - -
Toronto E03 0 $0 $0 - 0 0 - -
Toronto E04 0 $0 $0 - 0 0 - -
Toronto E05 0 $0 $0 - 0 0 - -
Toronto E06 0 $0 $0 - 0 0 - -
Toronto E07 3 $3,298,000 $1,099,333 $1,100,000 4 1 112% 7
Toronto E08 0 $0 $0 - 1 0 - -
Toronto E09 0 $0 $0 - 0 0 - -
Toronto E10 0 $0 $0 - 0 0 - -
Toronto E11 0 $0 $0 - 0 0 - -
Municipality Number of Sales Dollar Volume Average Price Median Price New Listings Active Listings Avg. SP/LP Avg. LDOM
LINK, NOVEMBER 2021
Toronto Regional Real Estate Board
SUMMARY OF EXISTING HOME TRANSACTIONS
CITY OF TORONTO MUNICIPAL BREAKDOWN
1 1 2 4 5
1 1 3
18
Market Watch, November 2021
Copyright®
2021 Toronto Regional Real Estate Board
TRREB Total 11 $7,516,318 $683,302 $499,900 15 19 98% 28
Halton Region 1 $425,000 $425,000 $425,000 0 0 92% 27
Burlington 1 $425,000 $425,000 $425,000 0 0 92% 27
Halton Hills 0 $0 $0 - 0 0 - -
Milton 0 $0 $0 - 0 0 - -
Oakville 0 $0 $0 - 0 0 - -
Peel Region 0 $0 $0 - 1 2 - -
Brampton 0 $0 $0 - 0 0 - -
Caledon 0 $0 $0 - 0 0 - -
Mississauga 0 $0 $0 - 1 2 - -
City of Toronto 10 $7,091,318 $709,132 $524,450 14 17 98% 28
Toronto West 4 $1,844,300 $461,075 $485,650 6 9 100% 30
Toronto Central 5 $4,797,018 $959,404 $1,135,000 8 8 98% 22
Toronto East 1 $450,000 $450,000 $450,000 0 0 92% 50
York Region 0 $0 $0 - 0 0 - -
Aurora 0 $0 $0 - 0 0 - -
East Gwillimbury 0 $0 $0 - 0 0 - -
Georgina 0 $0 $0 - 0 0 - -
King 0 $0 $0 - 0 0 - -
Markham 0 $0 $0 - 0 0 - -
Newmarket 0 $0 $0 - 0 0 - -
Richmond Hill 0 $0 $0 - 0 0 - -
Vaughan 0 $0 $0 - 0 0 - -
Whitchurch-Stouffville 0 $0 $0 - 0 0 - -
Durham Region 0 $0 $0 - 0 0 - -
Ajax 0 $0 $0 - 0 0 - -
Brock 0 $0 $0 - 0 0 - -
Clarington 0 $0 $0 - 0 0 - -
Oshawa 0 $0 $0 - 0 0 - -
Pickering 0 $0 $0 - 0 0 - -
Scugog 0 $0 $0 - 0 0 - -
Uxbridge 0 $0 $0 - 0 0 - -
Whitby 0 $0 $0 - 0 0 - -
Dufferin County 0 $0 $0 - 0 0 - -
Orangeville 0 $0 $0 - 0 0 - -
Simcoe County 0 $0 $0 - 0 0 - -
Adjala-Tosorontio 0 $0 $0 - 0 0 - -
Bradford West Gwillimbury 0 $0 $0 - 0 0 - -
Essa 0 $0 $0 - 0 0 - -
Innisfil 0 $0 $0 - 0 0 - -
New Tecumseth 0 $0 $0 - 0 0 - -
Municipality Number of Sales Dollar Volume Average Price Median Price New Listings Active Listings Avg. SP/LP Avg. LDOM
CO-OP APT, NOVEMBER 2021
Toronto Regional Real Estate Board
SUMMARY OF EXISTING HOME TRANSACTIONS
ALL TRREB AREAS
1 1 2 4 5
1 1 3
19
Market Watch, November 2021
Copyright®
2021 Toronto Regional Real Estate Board
TRREB Total 11 $7,516,318 $683,302 $499,900 15 19 98% 28
City of Toronto 10 $7,091,318 $709,132 $524,450 14 17 98% 28
Toronto West 4 $1,844,300 $461,075 $485,650 6 9 100% 30
Toronto W01 0 $0 $0 - 0 0 - -
Toronto W02 0 $0 $0 - 0 0 - -
Toronto W03 0 $0 $0 - 0 0 - -
Toronto W04 0 $0 $0 - 0 0 - -
Toronto W05 0 $0 $0 - 0 0 - -
Toronto W06 2 $823,900 $411,950 $411,950 4 5 99% 32
Toronto W07 1 $549,000 $549,000 $549,000 0 0 100% 52
Toronto W08 1 $471,400 $471,400 $471,400 1 3 101% 3
Toronto W09 0 $0 $0 - 1 1 - -
Toronto W10 0 $0 $0 - 0 0 - -
Toronto Central 5 $4,797,018 $959,404 $1,135,000 8 8 98% 22
Toronto C01 0 $0 $0 - 0 0 - -
Toronto C02 0 $0 $0 - 1 1 - -
Toronto C03 0 $0 $0 - 0 0 - -
Toronto C04 1 $347,018 $347,018 $347,018 0 0 97% 10
Toronto C06 0 $0 $0 - 0 0 - -
Toronto C07 0 $0 $0 - 0 0 - -
Toronto C08 0 $0 $0 - 0 0 - -
Toronto C09 4 $4,450,000 $1,112,500 $1,157,500 7 7 98% 25
Toronto C10 0 $0 $0 - 0 0 - -
Toronto C11 0 $0 $0 - 0 0 - -
Toronto C12 0 $0 $0 - 0 0 - -
Toronto C13 0 $0 $0 - 0 0 - -
Toronto C14 0 $0 $0 - 0 0 - -
Toronto C15 0 $0 $0 - 0 0 - -
Toronto East 1 $450,000 $450,000 $450,000 0 0 92% 50
Toronto E01 0 $0 $0 - 0 0 - -
Toronto E02 0 $0 $0 - 0 0 - -
Toronto E03 0 $0 $0 - 0 0 - -
Toronto E04 1 $450,000 $450,000 $450,000 0 0 92% 50
Toronto E05 0 $0 $0 - 0 0 - -
Toronto E06 0 $0 $0 - 0 0 - -
Toronto E07 0 $0 $0 - 0 0 - -
Toronto E08 0 $0 $0 - 0 0 - -
Toronto E09 0 $0 $0 - 0 0 - -
Toronto E10 0 $0 $0 - 0 0 - -
Toronto E11 0 $0 $0 - 0 0 - -
Municipality Number of Sales Dollar Volume Average Price Median Price New Listings Active Listings Avg. SP/LP Avg. LDOM
CO-OP APT, NOVEMBER 2021
Toronto Regional Real Estate Board
SUMMARY OF EXISTING HOME TRANSACTIONS
CITY OF TORONTO MUNICIPAL BREAKDOWN
1 1 2 4 5
1 1 3
20
Market Watch, November 2021
Copyright® 2021 Toronto Regional Real Estate Board
TRREB Total 7 $6,358,000 $908,286 $899,000 8 5 102% 9
Halton Region 1 $858,000 $858,000 $858,000 1 0 114% 8
Burlington 1 $858,000 $858,000 $858,000 1 0 114% 8
Halton Hills 0 $0 $0 - 0 0 - -
Milton 0 $0 $0 - 0 0 - -
Oakville 0 $0 $0 - 0 0 - -
Peel Region 0 $0 $0 - 1 2 - -
Brampton 0 $0 $0 - 1 1 - -
Caledon 0 $0 $0 - 0 0 - -
Mississauga 0 $0 $0 - 0 1 - -
City of Toronto 1 $899,000 $899,000 $899,000 1 0 112% 10
Toronto West 0 $0 $0 - 0 0 - -
Toronto Central 0 $0 $0 - 0 0 - -
Toronto East 1 $899,000 $899,000 $899,000 1 0 112% 10
York Region 2 $2,155,000 $1,077,500 $1,077,500 2 2 94% 12
Aurora 0 $0 $0 - 0 0 - -
East Gwillimbury 0 $0 $0 - 0 0 - -
Georgina 0 $0 $0 - 0 0 - -
King 0 $0 $0 - 0 0 - -
Markham 2 $2,155,000 $1,077,500 $1,077,500 2 2 94% 12
Newmarket 0 $0 $0 - 0 0 - -
Richmond Hill 0 $0 $0 - 0 0 - -
Vaughan 0 $0 $0 - 0 0 - -
Whitchurch-Stouffville 0 $0 $0 - 0 0 - -
Durham Region 0 $0 $0 - 1 0 - -
Ajax 0 $0 $0 - 0 0 - -
Brock 0 $0 $0 - 0 0 - -
Clarington 0 $0 $0 - 0 0 - -
Oshawa 0 $0 $0 - 0 0 - -
Pickering 0 $0 $0 - 1 0 - -
Scugog 0 $0 $0 - 0 0 - -
Uxbridge 0 $0 $0 - 0 0 - -
Whitby 0 $0 $0 - 0 0 - -
Dufferin County 0 $0 $0 - 0 0 - -
Orangeville 0 $0 $0 - 0 0 - -
Simcoe County 3 $2,446,000 $815,333 $757,000 2 1 102% 7
Adjala-Tosorontio 0 $0 $0 - 0 0 - -
Bradford West Gwillimbury 0 $0 $0 - 0 0 - -
Essa 0 $0 $0 - 0 0 - -
Innisfil 0 $0 $0 - 0 0 - -
New Tecumseth 3 $2,446,000 $815,333 $757,000 2 1 102% 7
Municipality Number of Sales Dollar Volume Average Price Median Price New Listings Active Listings Avg. SP/LP Avg. LDOM
DET CONDO, NOVEMBER 2021
Toronto Regional Real Estate Board
SUMMARY OF EXISTING HOME TRANSACTIONS
ALL TRREB AREAS
1 1 2 4 5
1 1 3
21
Market Watch, November 2021
Copyright® 2021 Toronto Regional Real Estate Board
TRREB Total 7 $6,358,000 $908,286 $899,000 8 5 102% 9
City of Toronto 1 $899,000 $899,000 $899,000 1 0 112% 10
Toronto West 0 $0 $0 - 0 0 - -
Toronto W01 0 $0 $0 - 0 0 - -
Toronto W02 0 $0 $0 - 0 0 - -
Toronto W03 0 $0 $0 - 0 0 - -
Toronto W04 0 $0 $0 - 0 0 - -
Toronto W05 0 $0 $0 - 0 0 - -
Toronto W06 0 $0 $0 - 0 0 - -
Toronto W07 0 $0 $0 - 0 0 - -
Toronto W08 0 $0 $0 - 0 0 - -
Toronto W09 0 $0 $0 - 0 0 - -
Toronto W10 0 $0 $0 - 0 0 - -
Toronto Central 0 $0 $0 - 0 0 - -
Toronto C01 0 $0 $0 - 0 0 - -
Toronto C02 0 $0 $0 - 0 0 - -
Toronto C03 0 $0 $0 - 0 0 - -
Toronto C04 0 $0 $0 - 0 0 - -
Toronto C06 0 $0 $0 - 0 0 - -
Toronto C07 0 $0 $0 - 0 0 - -
Toronto C08 0 $0 $0 - 0 0 - -
Toronto C09 0 $0 $0 - 0 0 - -
Toronto C10 0 $0 $0 - 0 0 - -
Toronto C11 0 $0 $0 - 0 0 - -
Toronto C12 0 $0 $0 - 0 0 - -
Toronto C13 0 $0 $0 - 0 0 - -
Toronto C14 0 $0 $0 - 0 0 - -
Toronto C15 0 $0 $0 - 0 0 - -
Toronto East 1 $899,000 $899,000 $899,000 1 0 112% 10
Toronto E01 0 $0 $0 - 0 0 - -
Toronto E02 0 $0 $0 - 0 0 - -
Toronto E03 0 $0 $0 - 0 0 - -
Toronto E04 0 $0 $0 - 0 0 - -
Toronto E05 0 $0 $0 - 0 0 - -
Toronto E06 0 $0 $0 - 0 0 - -
Toronto E07 0 $0 $0 - 0 0 - -
Toronto E08 0 $0 $0 - 0 0 - -
Toronto E09 0 $0 $0 - 0 0 - -
Toronto E10 0 $0 $0 - 0 0 - -
Toronto E11 1 $899,000 $899,000 $899,000 1 0 112% 10
Municipality Number of Sales Dollar Volume Average Price Median Price New Listings Active Listings Avg. SP/LP Avg. LDOM
DET CONDO, NOVEMBER 2021
Toronto Regional Real Estate Board
SUMMARY OF EXISTING HOME TRANSACTIONS
CITY OF TORONTO MUNICIPAL BREAKDOWN
1 1 2 4 5
1 1 3
22
Market Watch, November 2021
Copyright® 2021 Toronto Regional Real Estate Board
TRREB Total 8 $4,070,500 $508,813 $477,250 12 17 98% 35
Halton Region 0 $0 $0 - 0 0 - -
Burlington 0 $0 $0 - 0 0 - -
Halton Hills 0 $0 $0 - 0 0 - -
Milton 0 $0 $0 - 0 0 - -
Oakville 0 $0 $0 - 0 0 - -
Peel Region 0 $0 $0 - 0 0 - -
Brampton 0 $0 $0 - 0 0 - -
Caledon 0 $0 $0 - 0 0 - -
Mississauga 0 $0 $0 - 0 0 - -
City of Toronto 8 $4,070,500 $508,813 $477,250 12 17 98% 35
Toronto West 3 $1,511,000 $503,667 $415,000 1 1 95% 50
Toronto Central 5 $2,559,500 $511,900 $524,500 9 14 100% 27
Toronto East 0 $0 $0 - 2 2 - -
York Region 0 $0 $0 - 0 0 - -
Aurora 0 $0 $0 - 0 0 - -
East Gwillimbury 0 $0 $0 - 0 0 - -
Georgina 0 $0 $0 - 0 0 - -
King 0 $0 $0 - 0 0 - -
Markham 0 $0 $0 - 0 0 - -
Newmarket 0 $0 $0 - 0 0 - -
Richmond Hill 0 $0 $0 - 0 0 - -
Vaughan 0 $0 $0 - 0 0 - -
Whitchurch-Stouffville 0 $0 $0 - 0 0 - -
Durham Region 0 $0 $0 - 0 0 - -
Ajax 0 $0 $0 - 0 0 - -
Brock 0 $0 $0 - 0 0 - -
Clarington 0 $0 $0 - 0 0 - -
Oshawa 0 $0 $0 - 0 0 - -
Pickering 0 $0 $0 - 0 0 - -
Scugog 0 $0 $0 - 0 0 - -
Uxbridge 0 $0 $0 - 0 0 - -
Whitby 0 $0 $0 - 0 0 - -
Dufferin County 0 $0 $0 - 0 0 - -
Orangeville 0 $0 $0 - 0 0 - -
Simcoe County 0 $0 $0 - 0 0 - -
Adjala-Tosorontio 0 $0 $0 - 0 0 - -
Bradford West Gwillimbury 0 $0 $0 - 0 0 - -
Essa 0 $0 $0 - 0 0 - -
Innisfil 0 $0 $0 - 0 0 - -
New Tecumseth 0 $0 $0 - 0 0 - -
Municipality Number of Sales Dollar Volume Average Price Median Price New Listings Active Listings Avg. SP/LP Avg. LDOM
CO-OWNERSHIP APT, NOVEMBER 2021
Toronto Regional Real Estate Board
SUMMARY OF EXISTING HOME TRANSACTIONS
ALL TRREB AREAS
1 1 2 4 5
1 1 3
23
Market Watch, November 2021
Copyright® 2021 Toronto Regional Real Estate Board
TRREB Total 8 $4,070,500 $508,813 $477,250 12 17 98% 35
City of Toronto 8 $4,070,500 $508,813 $477,250 12 17 98% 35
Toronto West 3 $1,511,000 $503,667 $415,000 1 1 95% 50
Toronto W01 1 $730,000 $730,000 $730,000 0 0 97% 11
Toronto W02 0 $0 $0 - 1 1 - -
Toronto W03 0 $0 $0 - 0 0 - -
Toronto W04 0 $0 $0 - 0 0 - -
Toronto W05 1 $366,000 $366,000 $366,000 0 0 92% 43
Toronto W06 0 $0 $0 - 0 0 - -
Toronto W07 0 $0 $0 - 0 0 - -
Toronto W08 0 $0 $0 - 0 0 - -
Toronto W09 1 $415,000 $415,000 $415,000 0 0 97% 96
Toronto W10 0 $0 $0 - 0 0 - -
Toronto Central 5 $2,559,500 $511,900 $524,500 9 14 100% 27
Toronto C01 0 $0 $0 - 1 2 - -
Toronto C02 1 $430,000 $430,000 $430,000 0 1 99% 34
Toronto C03 0 $0 $0 - 3 4 - -
Toronto C04 2 $1,275,000 $637,500 $637,500 4 3 102% 10
Toronto C06 0 $0 $0 - 0 0 - -
Toronto C07 0 $0 $0 - 0 0 - -
Toronto C08 1 $524,500 $524,500 $524,500 1 3 96% 72
Toronto C09 0 $0 $0 - 0 0 - -
Toronto C10 0 $0 $0 - 0 0 - -
Toronto C11 0 $0 $0 - 0 0 - -
Toronto C12 0 $0 $0 - 0 0 - -
Toronto C13 0 $0 $0 - 0 1 - -
Toronto C14 1 $330,000 $330,000 $330,000 0 0 99% 8
Toronto C15 0 $0 $0 - 0 0 - -
Toronto East 0 $0 $0 - 2 2 - -
Toronto E01 0 $0 $0 - 0 0 - -
Toronto E02 0 $0 $0 - 2 2 - -
Toronto E03 0 $0 $0 - 0 0 - -
Toronto E04 0 $0 $0 - 0 0 - -
Toronto E05 0 $0 $0 - 0 0 - -
Toronto E06 0 $0 $0 - 0 0 - -
Toronto E07 0 $0 $0 - 0 0 - -
Toronto E08 0 $0 $0 - 0 0 - -
Toronto E09 0 $0 $0 - 0 0 - -
Toronto E10 0 $0 $0 - 0 0 - -
Toronto E11 0 $0 $0 - 0 0 - -
Municipality Number of Sales Dollar Volume Average Price Median Price New Listings Active Listings Avg. SP/LP Avg. LDOM
CO-OWNERSHIP APT, NOVEMBER 2021
Toronto Regional Real Estate Board
SUMMARY OF EXISTING HOME TRANSACTIONS
CITY OF TORONTO MUNICIPAL BREAKDOWN
1 1 2 4 5
1 1 3
24
Market Watch, November 2021
Copyright® 2021 Toronto Regional Real Estate Board
383.9 $1,172,900 28.31% 391.6 $1,465,000 32.12% 406.1 $1,143,900 31.85% 375.9 $809,200 24.26% 351.1 $695,300 20.08%
424.2 $1,306,600 33.73% 427.7 $1,560,800 35.18% 457.2 $1,157,200 39.26% 416.6 $802,700 27.91% 367.2 $694,900 21.23%
424.5 $1,224,800 30.90% 438.3 $1,508,500 34.04% 479.6 $1,169,300 37.22% 423.6 $791,600 28.68% 375.3 $619,600 21.50%
421.0 $1,241,800 36.25% 412.1 $1,344,100 36.77% 448.5 $999,400 39.94% 445.5 $709,300 31.80% 372.1 $568,200 22.81%
432.6 $1,316,700 42.07% 431.4 $1,589,000 41.67% 453.4 $1,093,000 42.89% 400.3 $686,600 27.28% 348.6 $717,200 21.80%
419.9 $1,418,000 31.51% 423.1 $1,715,600 32.88% 452.0 $1,260,000 36.56% 405.9 $921,800 26.88% 362.5 $724,100 20.59%
382.5 $1,084,000 29.31% 382.9 $1,356,000 33.14% 399.5 $1,020,900 33.52% 372.4 $787,400 24.34% 358.8 $613,500 17.37%
398.8 $1,015,800 33.56% 392.6 $1,156,700 35.38% 411.3 $960,600 35.61% 382.4 $691,400 25.62% 357.7 $527,600 20.28%
357.2 $1,305,400 35.00% 362.7 $1,378,700 35.89% 387.9 $958,300 31.27% 337.6 $730,800 31.36% - - -
369.5 $1,090,900 24.70% 373.4 $1,491,400 29.29% 378.9 $1,044,900 29.58% 368.2 $813,800 23.60% 359.0 $630,300 16.82%
361.0 $1,190,300 19.97% 366.9 $1,657,800 22.30% 382.6 $1,292,600 19.60% 352.6 $836,400 15.68% 351.8 $717,800 19.34%
383.1 $1,305,300 32.19% 394.0 $1,523,200 32.79% 395.2 $1,142,200 35.11% 339.9 $879,600 28.90% 323.2 $701,700 25.81%
370.9 $1,226,700 29.10% 375.0 $1,408,900 29.40% 394.7 $1,017,800 32.67% 330.7 $895,900 32.92% 322.6 $692,200 23.37%
378.7 $1,295,800 41.41% 380.3 $1,356,900 40.02% 407.2 $851,800 45.01% - - - - - -
413.7 $802,800 41.29% 423.3 $816,600 41.48% 401.1 $790,600 36.99% - - - - - -
381.3 $1,774,700 29.43% 386.4 $1,811,000 29.32% 382.4 $1,172,800 37.95% - - - 301.2 $744,600 23.85%
390.7 $1,373,300 33.21% 410.9 $1,720,300 31.83% 412.3 $1,227,400 37.85% 333.8 $900,900 32.15% 331.8 $764,200 28.06%
361.9 $1,065,700 34.94% 364.9 $1,229,900 35.15% 369.7 $870,700 37.84% 364.4 $754,100 30.38% 323.5 $553,600 24.61%
391.3 $1,405,900 29.61% 419.0 $1,789,700 30.98% 391.9 $1,191,500 32.98% 309.2 $783,900 18.65% 326.7 $661,000 24.22%
368.1 $1,343,500 29.07% 365.7 $1,553,800 29.04% 384.4 $1,167,000 31.96% 355.4 $982,800 26.16% 312.4 $721,500 25.61%
412.3 $1,436,300 36.52% 410.3 $1,513,400 36.77% 423.0 $1,055,400 40.02% 412.4 $732,000 31.30% 321.7 $643,700 21.40%
414.8 $968,500 40.14% 404.7 $1,056,100 40.42% 436.3 $870,200 41.70% 423.7 $666,600 38.51% 381.6 $633,200 29.40%
405.5 $1,000,100 39.20% 403.9 $1,083,500 39.56% 424.6 $916,200 41.20% 376.4 $707,300 30.20% 343.6 $551,800 28.45%
384.2 $648,000 38.35% 384.0 $654,100 38.33% 399.7 $806,200 50.66% - - - - - -
429.4 $906,900 44.38% 417.4 $1,005,300 44.63% 443.6 $847,400 46.69% 419.4 $677,400 41.93% 328.9 $484,700 28.98%
430.4 $818,500 40.24% 413.3 $882,000 40.05% 468.9 $784,800 41.15% 465.1 $589,500 43.82% 382.9 $433,200 26.54%
404.4 $1,078,600 35.52% 385.7 $1,201,600 37.26% 410.6 $958,100 35.92% 402.3 $686,400 31.17% 486.7 $916,800 32.26%
376.9 $967,700 34.18% 372.5 $987,400 35.31% 373.8 $694,900 29.84% - - - - - -
365.3 $1,217,200 35.75% 367.7 $1,270,000 35.58% 357.1 $828,100 33.25% 351.2 $639,500 37.89% 297.0 $709,200 27.63%
407.8 $1,059,500 41.06% 406.1 $1,168,000 40.91% 426.4 $939,300 41.71% 403.1 $677,300 38.71% 305.7 $567,600 28.18%
409.4 $903,500 31.39% 428.7 $977,000 31.46% 409.4 $767,200 31.30% 394.5 $521,500 39.70% 360.0 $528,100 12.08%
409.4 $903,500 31.39% 428.7 $977,000 31.46% 409.4 $767,200 31.30% 394.5 $521,500 39.70% 360.0 $528,100 12.08%
384.2 $839,300 34.81% 375.9 $862,400 38.25% 423.3 $790,600 35.07% 347.4 $548,500 34.08% 350.1 $553,700 27.73%
371.7 $993,800 38.28% 372.1 $996,300 38.17% - - - - - - - - -
398.2 $996,800 33.89% 373.8 $1,066,500 30.20% 435.4 $917,400 35.22% 394.6 $640,800 35.00% 322.2 $543,600 24.31%
408.8 $818,400 34.83% 397.5 $841,100 42.42% 434.0 $684,900 41.28% 359.5 $573,400 21.53% - - -
382.0 $753,400 34.79% 379.9 $772,400 38.50% 439.5 $672,000 34.82% 339.8 $285,800 48.58% 329.4 $647,300 23.79%
- - - - - - - - - - - - - - -
361.3 $848,700 34.86% 354.2 $922,200 34.93% 395.0 $719,200 32.33% 341.3 $689,800 32.54% 375.9 $586,300 32.87%
Composite Single Family Detached Single Family Attached Townhouse Apartment
Index Benchmark Yr./Yr. % Chg. Index Benchmark Yr./Yr. % Chg. Index Benchmark Yr./Yr. % Chg. Index Benchmark Yr./Yr. % Chg. Index Benchmark Yr./Yr. % Chg.
Toronto Regional Real Estate Board
FOCUS ON THE MLS HOME PRICE INDEX
ALL TRREB AREAS
INDEX AND BENCHMARK PRICE, NOVEMBER 2021
TRREB Total
Halton Region
Burlington
Halton Hills
Milton
Oakville
Peel Region
Brampton
Caledon
Mississauga
City of Toronto
York Region
Aurora
East Gwillimbury
Georgina
King
Markham
Newmarket
Richmond Hill
Vaughan
Whitchurch-Stouffville
Durham Region
Ajax
Brock
Clarington
Oshawa
Pickering
Scugog
Uxbridge
Whitby
Dufferin County
Orangeville
Simcoe County
Adjala-Tosorontio
Bradford West Gwillimbury
Essa
Innisfil
Barrie
New Tecumseth
25
Market Watch, November 2021
Copyright® 2021 Toronto Regional Real Estate Board
383.9 $1,172,900 28.31% 391.6 $1,465,000 32.12% 406.1 $1,143,900 31.85% 375.9 $809,200 24.26% 351.1 $695,300 20.08%
361.0 $1,190,300 19.97% 366.9 $1,657,800 22.30% 382.6 $1,292,600 19.60% 352.6 $836,400 15.68% 351.8 $717,800 19.34%
337.5 $1,440,700 16.98% 363.1 $2,022,500 20.63% 379.5 $1,508,400 19.98% 289.4 $870,700 8.84% 322.3 $728,700 15.44%
399.5 $1,423,400 16.71% 376.5 $1,645,700 16.38% 424.3 $1,261,700 16.47% 422.6 $822,900 14.43% 385.5 $827,500 17.57%
392.5 $1,012,100 18.12% 399.4 $1,081,000 18.41% 401.5 $1,028,500 17.98% 302.8 $742,500 12.11% 381.4 $651,700 19.82%
365.6 $938,400 14.61% 348.2 $1,101,900 18.19% 338.9 $963,200 15.59% 310.8 $715,400 11.88% 399.1 $588,800 11.98%
341.2 $810,500 19.22% 348.2 $1,167,700 21.58% 335.9 $975,700 23.22% 325.5 $591,100 14.57% 355.0 $469,000 16.39%
315.5 $924,100 21.58% 402.7 $1,272,500 21.04% 365.0 $1,229,100 22.03% 372.7 $1,105,100 14.75% 264.8 $664,200 24.32%
325.6 $1,439,800 17.93% 351.3 $1,611,100 20.27% 343.6 $1,428,300 22.45% 255.7 $940,000 13.59% 186.2 $755,000 6.22%
312.6 $1,325,000 18.90% 326.7 $1,831,700 22.18% 356.1 $1,339,100 22.79% 359.5 $864,600 14.53% 293.8 $611,800 16.73%
335.1 $874,300 18.79% 351.6 $1,363,500 24.15% 386.6 $1,066,400 29.43% 266.4 $739,900 9.49% 327.0 $430,800 12.95%
387.9 $886,100 20.77% 361.7 $1,085,100 21.83% 356.5 $912,300 17.77% 425.3 $765,600 17.10% 408.8 $582,400 20.88%
379.3 $951,600 18.94% 448.7 $1,757,900 16.24% 444.7 $1,625,000 16.81% 349.8 $997,100 13.76% 374.0 $778,600 19.53%
347.0 $1,748,300 16.44% 328.6 $2,773,500 17.23% 341.9 $1,916,200 16.02% 328.7 $1,652,800 4.92% 349.1 $994,600 16.99%
398.6 $2,309,700 17.72% 380.5 $2,579,600 18.79% 393.0 $1,516,500 20.40% - - - 428.5 $1,120,900 15.10%
324.2 $2,090,900 19.94% 334.6 $2,449,400 20.66% 349.5 $1,634,500 27.37% - - - 279.1 $746,600 15.09%
351.2 $1,415,100 24.06% 354.7 $1,579,300 24.59% 343.7 $1,266,900 25.81% 312.8 $838,900 10.61% 350.3 $753,400 24.31%
368.0 $1,257,800 23.08% 392.6 $1,869,100 20.65% 324.2 $1,222,600 26.54% 313.8 $884,500 10.22% 362.9 $756,200 25.61%
338.4 $878,700 21.25% 349.5 $2,046,400 13.29% 361.6 $1,725,000 15.86% 339.9 $879,000 10.14% 336.9 $721,600 22.33%
283.8 $2,036,000 13.93% 285.8 $3,684,800 18.69% 287.1 $2,717,400 16.42% 315.7 $1,864,500 10.08% 274.7 $910,100 11.08%
347.8 $1,374,700 17.62% 325.2 $2,007,800 16.89% 322.2 $1,591,800 19.64% 307.4 $1,030,400 8.93% 359.4 $858,200 17.84%
386.4 $1,401,700 14.76% 350.7 $2,525,000 15.93% 380.7 $1,765,300 14.26% 328.0 $568,200 21.17% 407.3 $591,400 13.36%
309.5 $2,673,800 19.50% 304.5 $3,301,500 21.75% 358.7 $1,474,800 20.21% 263.5 $1,054,300 14.81% 351.0 $1,100,500 19.43%
347.9 $1,302,800 19.80% 342.1 $1,904,500 18.05% 334.8 $1,044,100 23.54% 321.9 $930,600 17.65% 351.3 $717,700 20.64%
346.9 $1,177,500 19.09% 397.0 $2,388,300 22.23% 325.8 $1,682,100 30.74% 366.5 $987,000 15.58% 331.7 $835,300 17.87%
359.6 $1,164,500 23.79% 359.8 $1,689,300 21.06% 310.9 $1,010,800 27.42% 355.9 $851,900 18.63% 364.1 $838,200 25.51%
427.7 $1,331,200 16.67% 437.9 $1,542,600 15.69% 445.4 $1,404,700 16.38% 503.1 $920,200 16.03% 337.4 $754,700 18.76%
384.3 $1,434,700 18.54% 339.7 $1,537,300 20.21% 404.3 $1,353,000 17.56% 395.5 $1,139,100 15.24% 355.0 $1,008,700 19.77%
374.3 $1,164,400 17.34% 377.8 $1,284,200 17.04% 357.9 $1,194,600 16.43% - - - 378.2 $565,300 21.76%
377.7 $931,500 20.10% 371.1 $1,094,000 27.57% 379.1 $913,600 22.45% 325.9 $692,900 14.59% 410.3 $625,700 11.40%
337.9 $897,800 23.41% 369.1 $1,299,800 26.71% 359.9 $991,800 26.55% 352.5 $766,600 20.02% 294.1 $603,700 18.40%
384.5 $1,069,300 24.59% 393.0 $1,122,600 25.52% 389.0 $925,200 23.61% 351.5 $776,800 17.95% 348.5 $717,400 22.54%
373.8 $916,300 22.76% 386.5 $1,266,800 27.52% 369.6 $966,400 25.59% 356.0 $771,200 18.90% 367.7 $629,700 19.38%
377.7 $870,700 23.43% 374.1 $1,166,100 27.51% 335.9 $870,800 28.06% 343.0 $628,900 22.50% 393.3 $536,600 16.78%
379.9 $907,100 27.14% 385.5 $1,094,600 32.29% 365.0 $892,700 27.18% 405.1 $729,300 25.03% 371.5 $696,800 22.32%
396.8 $1,112,800 28.87% 384.0 $1,230,300 32.46% 386.4 $1,002,000 31.21% 450.1 $734,200 23.42% 353.8 $570,800 16.31%
393.1 $838,300 22.42% 390.2 $1,085,300 25.18% 398.9 $903,600 25.60% 306.5 $601,500 19.77% 472.7 $599,200 21.83%
Composite Single Family Detached Single Family Attached Townhouse Apartment
Index Benchmark Yr./Yr. % Chg. Index Benchmark Yr./Yr. % Chg. Index Benchmark Yr./Yr. % Chg. Index Benchmark Yr./Yr. % Chg. Index Benchmark Yr./Yr. % Chg.
Toronto Regional Real Estate Board
FOCUS ON THE MLS HOME PRICE INDEX
CITY OF TORONTO
INDEX AND BENCHMARK PRICE, NOVEMBER 2021
TRREB Total
City of Toronto
Toronto W01
Toronto W02
Toronto W03
Toronto W04
Toronto W05
Toronto W06
Toronto W07
Toronto W08
Toronto W09
Toronto W10
Toronto C01
Toronto C02
Toronto C03
Toronto C04
Toronto C06
Toronto C07
Toronto C08
Toronto C09
Toronto C10
Toronto C11
Toronto C12
Toronto C13
Toronto C14
Toronto C15
Toronto E01
Toronto E02
Toronto E03
Toronto E04
Toronto E05
Toronto E06
Toronto E07
Toronto E08
Toronto E09
Toronto E10
Toronto E11
26
Market Watch, November 2021
Copyright® 2021 Toronto Regional Real Estate Board
2009 86,980 $395,234
2010 85,860 $431,262
2011 89,110 $464,989
2012 85,488 $497,073
2013 87,047 $522,951
2014 92,776 $566,611
2015 101,213 $622,118
2016 113,040 $729,821
2017 92,340 $822,496
2018 78,017 $787,800
2019 87,747 $819,043
Year Sales Average Price
Toronto Regional Real Estate Board
January 4,546 838,087
February 7,193 910,068
March 7,942 902,788
April 2,957 820,226
May 4,594 863,563
June 8,645 931,131
July 11,033 943,594
August 10,738 951,219
September 11,033 960,613
October 10,503 968,535
November 8,728 955,889
December 7,154 932,297
January 6,888 $966,068
February 10,931 $1,044,933
March 15,628 $1,097,351
April 13,616 $1,090,522
May 11,904 $1,108,109
June 11,060 $1,089,135
July 9,340 $1,062,071
August 8,556 $1,070,093
September 9,017 $1,135,011
October 9,759 $1,155,423
November 9,017 $1,163,323
December - -
Annual 95,066 $929,636
HISTORIC ANNUAL STATISTICS1,6,7
Year to Date 115,716 $1,092,212
NOTES
*For historic annual sales and average price data over a longer time frame go to:
http://www.torontorealestateboard.com/market_news/market_watch/historic_stats/
pdf/TREB_historic_statistics.pdf
Ajax
Aurora
Bradford West
Gwillimbury
Brampton
Brock
Burlington
C01
C02
C03
C04
C06
C07
C08
C10 C11
C12 C13
C14
C15
Caledon
Clarington
E01
E02
E03
E04
E06
E07
E08
E09
E10
E11
East Gwillimbury
Essa
Georgina
Halton Hills
Innisfil
King
Markham
Milton
Mississauga
New Tecumseth
Newmarket
Oakville
Oshawa
Pickering
Richmond
Hill
Scugog
Uxbridge
Vaughan
W02
W03
W04
W05
W06
W07
W08
W09
W10
Whitchurch-Stouffville
Adjala-Tosorontio
Orangeville
Whitby
Dufferin
Durham
Halton
Peel
Simcoe
Toronto
York
27
Market Watch, November 2021
Copyright® 2021 Toronto Regional Real Estate Board
1 - Sales, dollar volume, average sale prices and median sale prices are based on firm transactions entered into the TRREB
MLS® system between the first and last day of the month/period being reported.
2 - New listings entered into the TRREB MLS® system between the first and last day of the month/period being reported.
3 - Active listings at the end of the last day of the month/period being reported.
4 - Ratio of the average selling price to the average listing price for firm transactions entered into the TRREB MLS® system
between the first and last day of the month/period being reported.
5 - Average Listing Days on Market (Avg. LDOM) refers to the average number of days sold listings were on the market.
Average Property Days on Market (Avg. PDOM) refers to the average number of days a property was on the market before
selling irrespective of whether the property was listed more than once by the same combination of seller and brokerage during
the original listing contract period.
6 - Active listings at the end of the last day of the month/period being reported.
7 - Past monthly and year-to-date figures are revised on a monthly basis.
8 - SNLR = Sales-to-New Listings Ratio. Calculated using a 12-month moving average (sales/new listings).
9 - Mos. Inv. = Months of Inventory. Calculated using a 12-month moving average (active listings/sales).
2021 MONTHLY STATISTICS1,7
2020 MONTHLY STATISTICS1,7

Más contenido relacionado

La actualidad más candente

Rebgv stats-pkg-october-2018 .pdf
Rebgv stats-pkg-october-2018 .pdf Rebgv stats-pkg-october-2018 .pdf
Rebgv stats-pkg-october-2018 .pdf Kathryn Huang
 
Real Estate Board of Greater Vancouver Statistics Package January 2021
Real Estate Board of Greater Vancouver Statistics Package January 2021 Real Estate Board of Greater Vancouver Statistics Package January 2021
Real Estate Board of Greater Vancouver Statistics Package January 2021 Vicky Aulakh
 
Rebgv stats-pkg-january-2019
Rebgv stats-pkg-january-2019Rebgv stats-pkg-january-2019
Rebgv stats-pkg-january-2019Kathryn Huang
 
The Okanagan Valley Real Estate Statistics Package September 2021
The Okanagan Valley Real Estate Statistics Package September 2021 The Okanagan Valley Real Estate Statistics Package September 2021
The Okanagan Valley Real Estate Statistics Package September 2021 VickyAulakh1
 
Central Okanagan April 2021 Statistics Package
Central Okanagan April 2021 Statistics PackageCentral Okanagan April 2021 Statistics Package
Central Okanagan April 2021 Statistics PackageVicky Aulakh
 
Rebgv stats-pkg-september-2018
Rebgv stats-pkg-september-2018Rebgv stats-pkg-september-2018
Rebgv stats-pkg-september-2018Kathryn Huang
 
April 2021 - TRREB Market Report
April 2021 - TRREB Market Report April 2021 - TRREB Market Report
April 2021 - TRREB Market Report Michelle Makos
 
Rebgv Stats Package September 2020
Rebgv Stats Package September 2020Rebgv Stats Package September 2020
Rebgv Stats Package September 2020Vicky Aulakh
 
Rebgv stats-pkg-august-2018
Rebgv stats-pkg-august-2018Rebgv stats-pkg-august-2018
Rebgv stats-pkg-august-2018Kathryn Huang
 
Central Okanagan Statistics Package October 2021
Central Okanagan Statistics Package October 2021 Central Okanagan Statistics Package October 2021
Central Okanagan Statistics Package October 2021 VickyAulakh1
 
August 2013 Mid Month Housing Report
August 2013 Mid Month Housing ReportAugust 2013 Mid Month Housing Report
August 2013 Mid Month Housing ReportMichelle Makos
 
Metro Vancouver - Stats Centre Reports - August 2021
Metro Vancouver - Stats Centre Reports - August 2021Metro Vancouver - Stats Centre Reports - August 2021
Metro Vancouver - Stats Centre Reports - August 2021Vicky Aulakh
 
Rebgv stats-pkg-may-2019
Rebgv stats-pkg-may-2019Rebgv stats-pkg-may-2019
Rebgv stats-pkg-may-2019Kathryn Huang
 
Real Estate Board of Greater Vancouver Statistics Package - November 2021
Real Estate Board of Greater Vancouver Statistics Package - November 2021Real Estate Board of Greater Vancouver Statistics Package - November 2021
Real Estate Board of Greater Vancouver Statistics Package - November 2021VickyAulakh1
 
Rebgv stats-pkg-august-2019
Rebgv stats-pkg-august-2019Rebgv stats-pkg-august-2019
Rebgv stats-pkg-august-2019Vicky Aulakh
 
REBGV Statistics package July 2020
REBGV Statistics package July 2020REBGV Statistics package July 2020
REBGV Statistics package July 2020Vicky Aulakh
 
Okanagan Real Estate June 2021 Statistics
Okanagan Real Estate June 2021 Statistics Okanagan Real Estate June 2021 Statistics
Okanagan Real Estate June 2021 Statistics Vicky Aulakh
 
REBGV Statistics Package August 2020
REBGV Statistics Package August 2020REBGV Statistics Package August 2020
REBGV Statistics Package August 2020Vicky Aulakh
 
December 2021 Fraser Valley Real Estate Board Statistics
December 2021 Fraser Valley Real Estate Board StatisticsDecember 2021 Fraser Valley Real Estate Board Statistics
December 2021 Fraser Valley Real Estate Board StatisticsVickyAulakh1
 

La actualidad más candente (20)

Rebgv stats-pkg-october-2018 .pdf
Rebgv stats-pkg-october-2018 .pdf Rebgv stats-pkg-october-2018 .pdf
Rebgv stats-pkg-october-2018 .pdf
 
Real Estate Board of Greater Vancouver Statistics Package January 2021
Real Estate Board of Greater Vancouver Statistics Package January 2021 Real Estate Board of Greater Vancouver Statistics Package January 2021
Real Estate Board of Greater Vancouver Statistics Package January 2021
 
May Market Watch 2021
May Market Watch 2021May Market Watch 2021
May Market Watch 2021
 
Rebgv stats-pkg-january-2019
Rebgv stats-pkg-january-2019Rebgv stats-pkg-january-2019
Rebgv stats-pkg-january-2019
 
The Okanagan Valley Real Estate Statistics Package September 2021
The Okanagan Valley Real Estate Statistics Package September 2021 The Okanagan Valley Real Estate Statistics Package September 2021
The Okanagan Valley Real Estate Statistics Package September 2021
 
Central Okanagan April 2021 Statistics Package
Central Okanagan April 2021 Statistics PackageCentral Okanagan April 2021 Statistics Package
Central Okanagan April 2021 Statistics Package
 
Rebgv stats-pkg-september-2018
Rebgv stats-pkg-september-2018Rebgv stats-pkg-september-2018
Rebgv stats-pkg-september-2018
 
April 2021 - TRREB Market Report
April 2021 - TRREB Market Report April 2021 - TRREB Market Report
April 2021 - TRREB Market Report
 
Rebgv Stats Package September 2020
Rebgv Stats Package September 2020Rebgv Stats Package September 2020
Rebgv Stats Package September 2020
 
Rebgv stats-pkg-august-2018
Rebgv stats-pkg-august-2018Rebgv stats-pkg-august-2018
Rebgv stats-pkg-august-2018
 
Central Okanagan Statistics Package October 2021
Central Okanagan Statistics Package October 2021 Central Okanagan Statistics Package October 2021
Central Okanagan Statistics Package October 2021
 
August 2013 Mid Month Housing Report
August 2013 Mid Month Housing ReportAugust 2013 Mid Month Housing Report
August 2013 Mid Month Housing Report
 
Metro Vancouver - Stats Centre Reports - August 2021
Metro Vancouver - Stats Centre Reports - August 2021Metro Vancouver - Stats Centre Reports - August 2021
Metro Vancouver - Stats Centre Reports - August 2021
 
Rebgv stats-pkg-may-2019
Rebgv stats-pkg-may-2019Rebgv stats-pkg-may-2019
Rebgv stats-pkg-may-2019
 
Real Estate Board of Greater Vancouver Statistics Package - November 2021
Real Estate Board of Greater Vancouver Statistics Package - November 2021Real Estate Board of Greater Vancouver Statistics Package - November 2021
Real Estate Board of Greater Vancouver Statistics Package - November 2021
 
Rebgv stats-pkg-august-2019
Rebgv stats-pkg-august-2019Rebgv stats-pkg-august-2019
Rebgv stats-pkg-august-2019
 
REBGV Statistics package July 2020
REBGV Statistics package July 2020REBGV Statistics package July 2020
REBGV Statistics package July 2020
 
Okanagan Real Estate June 2021 Statistics
Okanagan Real Estate June 2021 Statistics Okanagan Real Estate June 2021 Statistics
Okanagan Real Estate June 2021 Statistics
 
REBGV Statistics Package August 2020
REBGV Statistics Package August 2020REBGV Statistics Package August 2020
REBGV Statistics Package August 2020
 
December 2021 Fraser Valley Real Estate Board Statistics
December 2021 Fraser Valley Real Estate Board StatisticsDecember 2021 Fraser Valley Real Estate Board Statistics
December 2021 Fraser Valley Real Estate Board Statistics
 

Similar a November 2021 Market Watch

September 2020 - Market Report - Toronto & GTA Housing Sales
September 2020 - Market Report - Toronto & GTA Housing SalesSeptember 2020 - Market Report - Toronto & GTA Housing Sales
September 2020 - Market Report - Toronto & GTA Housing SalesMichelle Makos
 
Full Market April Market Watch 2022
Full Market April Market Watch 2022Full Market April Market Watch 2022
Full Market April Market Watch 2022Michelle Makos
 
Market Watch APRIL 2015
Market Watch APRIL 2015Market Watch APRIL 2015
Market Watch APRIL 2015Chaba Tamasi
 
June Market Report 2014
June Market Report 2014June Market Report 2014
June Market Report 2014Michelle Makos
 
TREB MARKET WATCH 2017
TREB MARKET WATCH 2017TREB MARKET WATCH 2017
TREB MARKET WATCH 2017Michelle Makos
 
October Market Watch is Here !
October Market Watch is Here !October Market Watch is Here !
October Market Watch is Here !Michelle Makos
 
TREB January 2017 Market Watch
TREB January 2017 Market WatchTREB January 2017 Market Watch
TREB January 2017 Market WatchMichelle Makos
 
Toronto Real Estate Board's MARKET WATCH - JANUARY 2017
Toronto Real Estate Board's MARKET WATCH - JANUARY 2017Toronto Real Estate Board's MARKET WATCH - JANUARY 2017
Toronto Real Estate Board's MARKET WATCH - JANUARY 2017Shawn Venasse
 
Toronto Real Estate Board's MARKET WATCH - JANUARY 2017
Toronto Real Estate Board's MARKET WATCH - JANUARY 2017Toronto Real Estate Board's MARKET WATCH - JANUARY 2017
Toronto Real Estate Board's MARKET WATCH - JANUARY 2017Shawn Venasse
 
Market Report for August 2017 - Residential Resale
Market Report for August 2017 - Residential ResaleMarket Report for August 2017 - Residential Resale
Market Report for August 2017 - Residential ResaleMichelle Makos
 
Treb Market Watch - January 2016
Treb Market Watch - January 2016Treb Market Watch - January 2016
Treb Market Watch - January 2016Michelle Makos
 
2013 04 market watch
2013 04 market watch2013 04 market watch
2013 04 market watchChaba Tamasi
 
February 2017 Market Watch - JUST RELEASED
February 2017 Market Watch - JUST RELEASEDFebruary 2017 Market Watch - JUST RELEASED
February 2017 Market Watch - JUST RELEASEDMichelle Makos
 
Market Report for October 2017 - Residential Resale
Market Report for October 2017 - Residential ResaleMarket Report for October 2017 - Residential Resale
Market Report for October 2017 - Residential ResaleMichelle Makos
 
Q2 2017 CONDO MARKET REPORT
Q2 2017 CONDO MARKET REPORTQ2 2017 CONDO MARKET REPORT
Q2 2017 CONDO MARKET REPORTMichelle Makos
 
TREB Market Watch - August 2016
TREB Market Watch - August 2016TREB Market Watch - August 2016
TREB Market Watch - August 2016Michelle Makos
 
Toronto Market Watch AUGUST 2016
Toronto Market Watch AUGUST 2016Toronto Market Watch AUGUST 2016
Toronto Market Watch AUGUST 2016Chaba Tamasi
 
Market Watch TORONTO 2015 SEPTEMBER
Market Watch TORONTO 2015 SEPTEMBERMarket Watch TORONTO 2015 SEPTEMBER
Market Watch TORONTO 2015 SEPTEMBERChaba Tamasi
 
Market watch jan 2019 frank yu oakville
Market watch jan 2019 frank yu oakvilleMarket watch jan 2019 frank yu oakville
Market watch jan 2019 frank yu oakvilleFrank Yu
 
January 2018 TREB Market Report
January 2018 TREB Market ReportJanuary 2018 TREB Market Report
January 2018 TREB Market ReportMichelle Makos
 

Similar a November 2021 Market Watch (20)

September 2020 - Market Report - Toronto & GTA Housing Sales
September 2020 - Market Report - Toronto & GTA Housing SalesSeptember 2020 - Market Report - Toronto & GTA Housing Sales
September 2020 - Market Report - Toronto & GTA Housing Sales
 
Full Market April Market Watch 2022
Full Market April Market Watch 2022Full Market April Market Watch 2022
Full Market April Market Watch 2022
 
Market Watch APRIL 2015
Market Watch APRIL 2015Market Watch APRIL 2015
Market Watch APRIL 2015
 
June Market Report 2014
June Market Report 2014June Market Report 2014
June Market Report 2014
 
TREB MARKET WATCH 2017
TREB MARKET WATCH 2017TREB MARKET WATCH 2017
TREB MARKET WATCH 2017
 
October Market Watch is Here !
October Market Watch is Here !October Market Watch is Here !
October Market Watch is Here !
 
TREB January 2017 Market Watch
TREB January 2017 Market WatchTREB January 2017 Market Watch
TREB January 2017 Market Watch
 
Toronto Real Estate Board's MARKET WATCH - JANUARY 2017
Toronto Real Estate Board's MARKET WATCH - JANUARY 2017Toronto Real Estate Board's MARKET WATCH - JANUARY 2017
Toronto Real Estate Board's MARKET WATCH - JANUARY 2017
 
Toronto Real Estate Board's MARKET WATCH - JANUARY 2017
Toronto Real Estate Board's MARKET WATCH - JANUARY 2017Toronto Real Estate Board's MARKET WATCH - JANUARY 2017
Toronto Real Estate Board's MARKET WATCH - JANUARY 2017
 
Market Report for August 2017 - Residential Resale
Market Report for August 2017 - Residential ResaleMarket Report for August 2017 - Residential Resale
Market Report for August 2017 - Residential Resale
 
Treb Market Watch - January 2016
Treb Market Watch - January 2016Treb Market Watch - January 2016
Treb Market Watch - January 2016
 
2013 04 market watch
2013 04 market watch2013 04 market watch
2013 04 market watch
 
February 2017 Market Watch - JUST RELEASED
February 2017 Market Watch - JUST RELEASEDFebruary 2017 Market Watch - JUST RELEASED
February 2017 Market Watch - JUST RELEASED
 
Market Report for October 2017 - Residential Resale
Market Report for October 2017 - Residential ResaleMarket Report for October 2017 - Residential Resale
Market Report for October 2017 - Residential Resale
 
Q2 2017 CONDO MARKET REPORT
Q2 2017 CONDO MARKET REPORTQ2 2017 CONDO MARKET REPORT
Q2 2017 CONDO MARKET REPORT
 
TREB Market Watch - August 2016
TREB Market Watch - August 2016TREB Market Watch - August 2016
TREB Market Watch - August 2016
 
Toronto Market Watch AUGUST 2016
Toronto Market Watch AUGUST 2016Toronto Market Watch AUGUST 2016
Toronto Market Watch AUGUST 2016
 
Market Watch TORONTO 2015 SEPTEMBER
Market Watch TORONTO 2015 SEPTEMBERMarket Watch TORONTO 2015 SEPTEMBER
Market Watch TORONTO 2015 SEPTEMBER
 
Market watch jan 2019 frank yu oakville
Market watch jan 2019 frank yu oakvilleMarket watch jan 2019 frank yu oakville
Market watch jan 2019 frank yu oakville
 
January 2018 TREB Market Report
January 2018 TREB Market ReportJanuary 2018 TREB Market Report
January 2018 TREB Market Report
 

Más de Michelle Makos

March 2023 Market Watch
March 2023 Market WatchMarch 2023 Market Watch
March 2023 Market WatchMichelle Makos
 
February 2022 Market Watch
February 2022 Market WatchFebruary 2022 Market Watch
February 2022 Market WatchMichelle Makos
 
January 2023 Market Report
January 2023 Market ReportJanuary 2023 Market Report
January 2023 Market ReportMichelle Makos
 
August Market Watch 2022
August Market Watch 2022August Market Watch 2022
August Market Watch 2022Michelle Makos
 
2020 TREB Year in Review
2020  TREB Year in Review2020  TREB Year in Review
2020 TREB Year in ReviewMichelle Makos
 
Market Watch - September 2019
Market Watch - September 2019Market Watch - September 2019
Market Watch - September 2019Michelle Makos
 
Market Watch July 2017
Market Watch July 2017Market Watch July 2017
Market Watch July 2017Michelle Makos
 
Mid Month Stats from TREB for July 2017
Mid Month Stats from TREB for July 2017Mid Month Stats from TREB for July 2017
Mid Month Stats from TREB for July 2017Michelle Makos
 
MAY 2017 - MARKET STATS
MAY 2017 - MARKET STATSMAY 2017 - MARKET STATS
MAY 2017 - MARKET STATSMichelle Makos
 
March 2017 - TREB Market
March 2017 - TREB MarketMarch 2017 - TREB Market
March 2017 - TREB MarketMichelle Makos
 
2017 Market - Year in Review
2017 Market - Year in Review2017 Market - Year in Review
2017 Market - Year in ReviewMichelle Makos
 
December 2016 Market Watch
December 2016 Market WatchDecember 2016 Market Watch
December 2016 Market WatchMichelle Makos
 

Más de Michelle Makos (13)

October Stats.pdf
October Stats.pdfOctober Stats.pdf
October Stats.pdf
 
March 2023 Market Watch
March 2023 Market WatchMarch 2023 Market Watch
March 2023 Market Watch
 
February 2022 Market Watch
February 2022 Market WatchFebruary 2022 Market Watch
February 2022 Market Watch
 
January 2023 Market Report
January 2023 Market ReportJanuary 2023 Market Report
January 2023 Market Report
 
August Market Watch 2022
August Market Watch 2022August Market Watch 2022
August Market Watch 2022
 
2020 TREB Year in Review
2020  TREB Year in Review2020  TREB Year in Review
2020 TREB Year in Review
 
Market Watch - September 2019
Market Watch - September 2019Market Watch - September 2019
Market Watch - September 2019
 
Market Watch July 2017
Market Watch July 2017Market Watch July 2017
Market Watch July 2017
 
Mid Month Stats from TREB for July 2017
Mid Month Stats from TREB for July 2017Mid Month Stats from TREB for July 2017
Mid Month Stats from TREB for July 2017
 
MAY 2017 - MARKET STATS
MAY 2017 - MARKET STATSMAY 2017 - MARKET STATS
MAY 2017 - MARKET STATS
 
March 2017 - TREB Market
March 2017 - TREB MarketMarch 2017 - TREB Market
March 2017 - TREB Market
 
2017 Market - Year in Review
2017 Market - Year in Review2017 Market - Year in Review
2017 Market - Year in Review
 
December 2016 Market Watch
December 2016 Market WatchDecember 2016 Market Watch
December 2016 Market Watch
 

Último

How to Navigate the Eviction Process in Pennsylvania: A Landlord's Guide
How to Navigate the Eviction Process in Pennsylvania: A Landlord's GuideHow to Navigate the Eviction Process in Pennsylvania: A Landlord's Guide
How to Navigate the Eviction Process in Pennsylvania: A Landlord's GuideezLandlordForms
 
Partner With the Golden Life Community for Single Women Over 55
Partner With the Golden Life Community for Single Women Over 55Partner With the Golden Life Community for Single Women Over 55
Partner With the Golden Life Community for Single Women Over 55Ron Surz
 
Affordable and Quality Construction SVTN's Signature Blend of Cost-Efficiency...
Affordable and Quality Construction SVTN's Signature Blend of Cost-Efficiency...Affordable and Quality Construction SVTN's Signature Blend of Cost-Efficiency...
Affordable and Quality Construction SVTN's Signature Blend of Cost-Efficiency...AditiAlishetty
 
The Importance of Parks and Recreation Areas in Reliaable Developers Plot Dev...
The Importance of Parks and Recreation Areas in Reliaable Developers Plot Dev...The Importance of Parks and Recreation Areas in Reliaable Developers Plot Dev...
The Importance of Parks and Recreation Areas in Reliaable Developers Plot Dev...Reliaable Developers
 
What Is Biophilic Design .pdf
What Is Biophilic Design            .pdfWhat Is Biophilic Design            .pdf
What Is Biophilic Design .pdfyamunaNMH
 
A Brief History of Intangibles in Ad Valorem Taxation.pdf
A Brief History of Intangibles in Ad Valorem Taxation.pdfA Brief History of Intangibles in Ad Valorem Taxation.pdf
A Brief History of Intangibles in Ad Valorem Taxation.pdfTim Wilmath
 
Eco-Efficient Living: Redefining Sustainability through Leech's Green Design ...
Eco-Efficient Living: Redefining Sustainability through Leech's Green Design ...Eco-Efficient Living: Redefining Sustainability through Leech's Green Design ...
Eco-Efficient Living: Redefining Sustainability through Leech's Green Design ...Newman George Leech
 
The Role of Mortgage Brokers in Retirement Housing: Key Considerations
The Role of Mortgage Brokers in Retirement Housing: Key ConsiderationsThe Role of Mortgage Brokers in Retirement Housing: Key Considerations
The Role of Mortgage Brokers in Retirement Housing: Key Considerationssunlite Mortgage
 
Brigade Neopolis Kokapet, Hyderabad E- Brochure
Brigade Neopolis Kokapet, Hyderabad E- BrochureBrigade Neopolis Kokapet, Hyderabad E- Brochure
Brigade Neopolis Kokapet, Hyderabad E- Brochurefaheemali990101
 
8 Key Elements for Comfortable Farmland Living
8 Key Elements for Comfortable Farmland Living 8 Key Elements for Comfortable Farmland Living
8 Key Elements for Comfortable Farmland Living Farmland Bazaar
 
Provident Solitaire Park Square Kanakapura Road, Bangalore E- Brochure.pdf
Provident Solitaire Park Square Kanakapura Road, Bangalore E- Brochure.pdfProvident Solitaire Park Square Kanakapura Road, Bangalore E- Brochure.pdf
Provident Solitaire Park Square Kanakapura Road, Bangalore E- Brochure.pdffaheemali990101
 
Managed Farmland Brochures to get more in
Managed Farmland Brochures to get more inManaged Farmland Brochures to get more in
Managed Farmland Brochures to get more inknoxdigital1
 
DLF Plots Sriperumbudur in Chennai E Brochure Pdf
DLF Plots Sriperumbudur in Chennai E Brochure PdfDLF Plots Sriperumbudur in Chennai E Brochure Pdf
DLF Plots Sriperumbudur in Chennai E Brochure Pdfashiyadav24
 
Prestige Rainbow Waters Raidurgam, Gachibowli Hyderabad E- Brochure.pdf
Prestige Rainbow Waters Raidurgam, Gachibowli Hyderabad E- Brochure.pdfPrestige Rainbow Waters Raidurgam, Gachibowli Hyderabad E- Brochure.pdf
Prestige Rainbow Waters Raidurgam, Gachibowli Hyderabad E- Brochure.pdffaheemali990101
 
Dynamic Netsoft A leader In Property management Software
Dynamic Netsoft A leader In Property management SoftwareDynamic Netsoft A leader In Property management Software
Dynamic Netsoft A leader In Property management SoftwareDynamic Netsoft
 
Anandtara Iris Residences Mundhwa Pune Brochure.pdf
Anandtara Iris Residences Mundhwa Pune Brochure.pdfAnandtara Iris Residences Mundhwa Pune Brochure.pdf
Anandtara Iris Residences Mundhwa Pune Brochure.pdfabbu831446
 
Ryan Mahoney - How Property Technology Is Altering the Real Estate Market
Ryan Mahoney - How Property Technology Is Altering the Real Estate MarketRyan Mahoney - How Property Technology Is Altering the Real Estate Market
Ryan Mahoney - How Property Technology Is Altering the Real Estate MarketRyan Mahoney
 

Último (20)

How to Navigate the Eviction Process in Pennsylvania: A Landlord's Guide
How to Navigate the Eviction Process in Pennsylvania: A Landlord's GuideHow to Navigate the Eviction Process in Pennsylvania: A Landlord's Guide
How to Navigate the Eviction Process in Pennsylvania: A Landlord's Guide
 
Partner With the Golden Life Community for Single Women Over 55
Partner With the Golden Life Community for Single Women Over 55Partner With the Golden Life Community for Single Women Over 55
Partner With the Golden Life Community for Single Women Over 55
 
Affordable and Quality Construction SVTN's Signature Blend of Cost-Efficiency...
Affordable and Quality Construction SVTN's Signature Blend of Cost-Efficiency...Affordable and Quality Construction SVTN's Signature Blend of Cost-Efficiency...
Affordable and Quality Construction SVTN's Signature Blend of Cost-Efficiency...
 
The Importance of Parks and Recreation Areas in Reliaable Developers Plot Dev...
The Importance of Parks and Recreation Areas in Reliaable Developers Plot Dev...The Importance of Parks and Recreation Areas in Reliaable Developers Plot Dev...
The Importance of Parks and Recreation Areas in Reliaable Developers Plot Dev...
 
What Is Biophilic Design .pdf
What Is Biophilic Design            .pdfWhat Is Biophilic Design            .pdf
What Is Biophilic Design .pdf
 
A Brief History of Intangibles in Ad Valorem Taxation.pdf
A Brief History of Intangibles in Ad Valorem Taxation.pdfA Brief History of Intangibles in Ad Valorem Taxation.pdf
A Brief History of Intangibles in Ad Valorem Taxation.pdf
 
Eco-Efficient Living: Redefining Sustainability through Leech's Green Design ...
Eco-Efficient Living: Redefining Sustainability through Leech's Green Design ...Eco-Efficient Living: Redefining Sustainability through Leech's Green Design ...
Eco-Efficient Living: Redefining Sustainability through Leech's Green Design ...
 
The Role of Mortgage Brokers in Retirement Housing: Key Considerations
The Role of Mortgage Brokers in Retirement Housing: Key ConsiderationsThe Role of Mortgage Brokers in Retirement Housing: Key Considerations
The Role of Mortgage Brokers in Retirement Housing: Key Considerations
 
Brigade Neopolis Kokapet, Hyderabad E- Brochure
Brigade Neopolis Kokapet, Hyderabad E- BrochureBrigade Neopolis Kokapet, Hyderabad E- Brochure
Brigade Neopolis Kokapet, Hyderabad E- Brochure
 
Call Girls in Mahavir Nagar whatsaap call US +919953056974
Call Girls in Mahavir Nagar  whatsaap call US  +919953056974Call Girls in Mahavir Nagar  whatsaap call US  +919953056974
Call Girls in Mahavir Nagar whatsaap call US +919953056974
 
8 Key Elements for Comfortable Farmland Living
8 Key Elements for Comfortable Farmland Living 8 Key Elements for Comfortable Farmland Living
8 Key Elements for Comfortable Farmland Living
 
Provident Solitaire Park Square Kanakapura Road, Bangalore E- Brochure.pdf
Provident Solitaire Park Square Kanakapura Road, Bangalore E- Brochure.pdfProvident Solitaire Park Square Kanakapura Road, Bangalore E- Brochure.pdf
Provident Solitaire Park Square Kanakapura Road, Bangalore E- Brochure.pdf
 
Managed Farmland Brochures to get more in
Managed Farmland Brochures to get more inManaged Farmland Brochures to get more in
Managed Farmland Brochures to get more in
 
9953056974 Low Rate Call Girls In Saket, Delhi NCR
9953056974 Low Rate Call Girls In Saket, Delhi NCR9953056974 Low Rate Call Girls In Saket, Delhi NCR
9953056974 Low Rate Call Girls In Saket, Delhi NCR
 
DLF Plots Sriperumbudur in Chennai E Brochure Pdf
DLF Plots Sriperumbudur in Chennai E Brochure PdfDLF Plots Sriperumbudur in Chennai E Brochure Pdf
DLF Plots Sriperumbudur in Chennai E Brochure Pdf
 
Prestige Rainbow Waters Raidurgam, Gachibowli Hyderabad E- Brochure.pdf
Prestige Rainbow Waters Raidurgam, Gachibowli Hyderabad E- Brochure.pdfPrestige Rainbow Waters Raidurgam, Gachibowli Hyderabad E- Brochure.pdf
Prestige Rainbow Waters Raidurgam, Gachibowli Hyderabad E- Brochure.pdf
 
Low Rate Call Girls in Triveni Complex Delhi Call 9873940964
Low Rate Call Girls in Triveni Complex Delhi Call 9873940964Low Rate Call Girls in Triveni Complex Delhi Call 9873940964
Low Rate Call Girls in Triveni Complex Delhi Call 9873940964
 
Dynamic Netsoft A leader In Property management Software
Dynamic Netsoft A leader In Property management SoftwareDynamic Netsoft A leader In Property management Software
Dynamic Netsoft A leader In Property management Software
 
Anandtara Iris Residences Mundhwa Pune Brochure.pdf
Anandtara Iris Residences Mundhwa Pune Brochure.pdfAnandtara Iris Residences Mundhwa Pune Brochure.pdf
Anandtara Iris Residences Mundhwa Pune Brochure.pdf
 
Ryan Mahoney - How Property Technology Is Altering the Real Estate Market
Ryan Mahoney - How Property Technology Is Altering the Real Estate MarketRyan Mahoney - How Property Technology Is Altering the Real Estate Market
Ryan Mahoney - How Property Technology Is Altering the Real Estate Market
 

November 2021 Market Watch

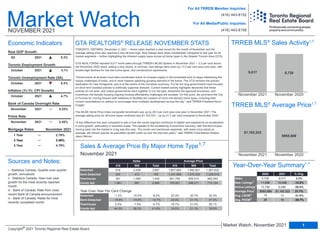
  • 1. Sales New Listings Active Listings Average Price Avg. LDOM Avg. PDOM 8,728 9,017 3.3% 11,556 10,036 -13.2% 13,798 6,086 -55.9% $955,889 $1,163,323 21.7% 19 13 -31.6% 28 18 -35.7% 2020 2021 % Chg. Year Market Watch NOVEMBER 2021 Economic Indicators November 2021 GTA REALTORS® RELEASE NOVEMBER STATS TORONTO, ONTARIO, December 3, 2021 – Home sales reached a new record for the month of November and the average selling price also reached a new all-time high. New listings were down substantially compared to last year for all market segments – further highlighting the inherent supply issue across all home types in the Greater Toronto Area (GTA). GTA REALTORS® reported 9,017 home sales through TRREB’s MLS® System in November 2021 – 3.3 per cent above the November 2020 result, setting a new record. In contrast, new listings were down by 13.2 per cent year-over-year, with double-digit declines for low-rise home types, and condominium apartments. “Governments at all levels must take coordinated action to increase supply in the immediate term to begin addressing the supply challenges of today, and to work towards satisfying growing demand in the future. The GTA remains the primary destination for new immigrants, and is at the centre of the Canadian economy. For far too long governments have focused on short term bandaid policies to artificially suppress demand. Current market activity highlights decisively that these policies do not work, and unless governments work together to cut red tape, streamline the approval processes, and incentivize mid-density housing ongoing housing affordability challenges will escalate. On this point, we commend the City of Toronto for moving forward with initiatives to facilitate the creation of more mid-density home types, including their current consultations on options to encourage more multiplex development across the city,” said TRREB President Kevin Crigger. The MLS® Home Price Index composite benchmark was up by 28.3 per cent year-over-year in November 2021. The average selling price for all home types combined was $1,163,323 – up by 21.7 per cent compared to November 2020. “A key difference this year compared to last is how the condo segment continues to tighten and experience an acceleration in price growth, particularly in suburban areas. This speaks to the broadening of economic recovery, with first-time buyers moving back into the market in a big way this year. The condo and townhouse segments, with lower price points on average, will remain popular as population growth picks up over the next two years,” said TRREB Chief Market Analyst Jason Mercer. Sources and Notes: i - Statistics Canada, Quarter-over-quarter growth, annualized ii - Statistics Canada, Year-over-year growth for the most recently reported month iii - Bank of Canada, Rate from most recent Bank of Canada announcement iv - Bank of Canada, Rates for most recently completed month For All TRREB Member Inquiries: For All Media/Public Inquiries: (416) 443-8152 (416) 443-8158 November 2020 November 2021 9,017 8,728 Detached Semi-Detached Townhouse Condo Apt 918 2,939 3,857 1,807,983 1,492,821 1,567,832 283 472 755 1,431,988 1,070,530 1,206,016 381 1,068 1,449 981,759 955,010 962,044 1,981 887 2,868 745,951 646,211 715,104 Sales Average Price 416 905 Total 416 905 Total Home Type Year-Over-Year Per Cent Change November 2020 November 2021 $1,163,323 $955,889 Detached Semi-Detached Townhouse Condo Apt -1.2% -10.2% -8.2% 22.3% 32.7% 30.3% -15.8% -14.0% -14.7% 23.4% 31.1% 27.3% 5.5% -7.9% -4.7% 19.7% 31.0% 28.1% 44.3% 36.0% 41.6% 16.5% 21.1% 18.0% TRREB MLS® Sales Activity1,7 TRREB MLS® Average Price1,7 Sales & Average Price By Major Home Type1,7 Year-Over-Year Summary1,7 November 2021 0.25% November 2021 2.45% 1 Year 2.79% 3 Year 3.49% 5 Year 4.79% October 2021 4.7% October 2021 8.4% October 2021 6.1% Q3 2021 5.3% Real GDP Growth Toronto Employment Growth Toronto Unemployment Rate (SA) Inflation (Yr./Yr. CPI Growth) Bank of Canada Overnight Rate Prime Rate 1 Market Watch, November 2021 Copyright® 2021 Toronto Regional Real Estate Board November 2021 Mortgage Rates 2 3 1 5 5
  • 2. Toronto Regional Real Estate Board YEAR-TO-DATE, 2021 $0 to $99,999 $100,000 to $199,999 $200,000 to $299,999 $300,000 to $399,999 $400,000 to $499,999 $500,000 to $599,999 $600,000 to $699,999 $700,000 to $799,999 $800,000 to $899,999 $900,000 to $999,999 $1,000,000 to $1,249,999 $1,250,000 to $1,499,999 $1,500,000 to $1,749,999 $1,750,000 to $1,999,999 $2,000,000+ 0 0 0 0 0 0 0 0 0 0 0 0 0 0 3 0 0 0 0 3 0 0 0 0 9 0 0 0 0 9 2 1 2 1 30 0 2 0 2 40 7 0 2 14 238 0 4 0 2 267 20 0 1 47 783 0 1 0 2 854 46 11 4 127 782 1 1 0 0 972 121 31 30 168 464 6 0 2 2 824 161 62 103 176 257 10 0 2 0 771 265 125 190 90 92 10 0 1 0 773 757 314 233 56 99 13 2 2 0 1,476 937 122 121 28 47 19 0 0 0 1,274 585 40 29 8 16 3 1 0 0 682 322 26 5 3 17 0 0 0 0 373 634 23 10 1 31 0 0 0 0 699 Detached Semi-Detached Att/Row/Twnhouse Condo Townhouse Condo Apt Link Co-Op Apt Det Condo Co-Ownership Apt Total Name $0 to $99,999 $100,000 to $199,999 $200,000 to $299,999 $300,000 to $399,999 $400,000 to $499,999 $500,000 to $599,999 $600,000 to $699,999 $700,000 to $799,999 $800,000 to $899,999 $900,000 to $999,999 $1,000,000 to $1,249,999 $1,250,000 to $1,499,999 $1,500,000 to $1,749,999 $1,750,000 to $1,999,999 $2,000,000+ 0 0 0 0 4 0 0 0 0 4 2 0 0 0 31 0 2 0 0 35 22 0 0 3 90 0 11 0 2 128 56 2 9 27 490 0 24 1 20 629 152 8 6 310 3,984 0 17 0 13 4,490 496 60 37 1,026 9,710 3 12 4 14 11,362 1,090 408 520 2,331 8,036 31 21 25 6 12,468 2,353 760 1,714 2,576 3,879 95 4 20 3 11,404 3,919 1,905 2,617 1,628 2,274 153 4 18 4 12,522 5,224 2,638 2,278 598 1,174 144 4 17 1 12,078 11,591 2,845 2,234 455 1,028 235 6 13 0 18,407 11,043 978 845 193 458 126 6 7 0 13,656 6,229 508 238 72 198 12 2 3 0 7,262 3,470 225 68 32 128 1 3 1 0 3,928 6,688 251 100 37 255 0 1 3 0 7,335 Detached Semi-Detached Att/Row/Twnhouse Condo Townhouse Condo Apt Link Co-Op Apt Det Condo Co-Ownership Apt Total Name NOVEMBER 2021 SALES BY PRICE RANGE AND HOUSE TYPE 1,7 SALES BY PRICE RANGE AND HOUSE TYPE 1,7 Total Sales Share of Total Sales (%) Average Price ($) 3,857 755 730 719 2,868 62 11 7 8 9,017 42.8% 8.4% 8.1% 8.0% 31.8% 0.7% 0.1% 0.1% 0.1% 100.0% $1,567,832 $1,206,017 $1,095,570 $826,475 $715,104 $1,115,305 $683,302 $908,286 $508,813 $1,163,323 52,338 10,592 10,667 9,288 31,739 800 117 112 63 115,716 45.2% 9.2% 9.2% 8.0% 27.4% 0.7% 0.1% 0.1% 0.1% 100.0% $1,431,448 $1,073,127 $974,267 $767,385 $679,212 $1,015,955 $648,133 $924,222 $495,062 $1,092,212 Total Sales Share of Total Sales (%) Average Price ($)
  • 3. TRREB Total 9,017 $10,489,684,676 $1,163,323 $999,999 10,036 73.5% 6,086 0.9 108% 13 18 Halton Region 798 $1,082,559,634 $1,356,591 $1,200,000 815 79.5% 346 0.7 108% 10 13 Burlington 224 $257,723,024 $1,150,549 $1,074,000 238 81.6% 94 0.6 109% 10 12 Halton Hills 67 $89,991,388 $1,343,155 $1,179,000 71 82.0% 39 0.6 109% 11 14 Milton 193 $232,644,542 $1,205,412 $1,105,000 193 77.8% 64 0.5 110% 8 11 Oakville 314 $502,200,680 $1,599,365 $1,397,000 313 78.5% 149 0.8 106% 11 14 Peel Region 1,716 $1,911,860,974 $1,114,138 $1,030,000 1,810 75.4% 748 0.7 109% 10 13 Brampton 821 $936,055,201 $1,140,140 $1,092,000 862 75.4% 235 0.6 110% 7 10 Caledon 84 $132,846,500 $1,581,506 $1,421,000 101 70.3% 92 1.0 103% 14 23 Mississauga 811 $842,959,273 $1,039,407 $920,000 847 76.1% 421 0.8 108% 13 16 City of Toronto 3,587 $3,933,993,086 $1,096,736 $840,000 4,249 69.2% 3,342 1.2 106% 17 23 Toronto West 883 $893,499,903 $1,011,891 $900,000 1,024 71.0% 718 1.0 108% 16 22 Toronto Central 1,852 $2,168,182,494 $1,170,725 $775,000 2,306 66.0% 2,160 1.4 102% 19 27 Toronto East 852 $872,310,689 $1,023,839 $999,500 919 74.6% 464 0.7 112% 12 16 York Region 1,583 $2,207,831,407 $1,394,713 $1,315,000 1,796 71.9% 1,127 1.0 109% 13 18 Aurora 86 $123,591,555 $1,437,111 $1,336,500 104 73.3% 66 0.9 107% 15 18 East Gwillimbury 59 $80,148,927 $1,358,456 $1,402,000 77 75.3% 43 0.8 112% 10 12 Georgina 79 $82,912,924 $1,049,531 $1,030,000 105 74.3% 64 0.8 111% 10 11 King 35 $73,897,600 $2,111,360 $2,058,000 54 64.2% 62 2.1 100% 19 25 Markham 413 $572,654,659 $1,386,573 $1,360,800 458 73.2% 253 0.9 112% 11 16 Newmarket 143 $173,670,437 $1,214,479 $1,150,000 128 77.9% 34 0.6 111% 9 15 Richmond Hill 324 $476,930,962 $1,472,009 $1,365,000 343 68.1% 254 1.2 108% 17 21 Vaughan 376 $524,644,614 $1,395,331 $1,300,000 447 70.6% 296 1.1 107% 15 19 Whitchurch-Stouffville 68 $99,379,729 $1,461,467 $1,437,500 80 74.4% 55 1.0 107% 17 19 Durham Region 1,013 $1,011,575,833 $998,594 $960,000 1,044 80.7% 364 0.5 119% 8 10 Ajax 142 $152,501,661 $1,073,955 $1,072,750 147 79.7% 46 0.4 119% 6 7 Brock 14 $10,843,000 $774,500 $712,500 17 77.9% 17 0.8 110% 6 15 Clarington 170 $160,645,640 $944,974 $935,500 172 83.4% 62 0.5 122% 8 9 Oshawa 324 $279,336,795 $862,151 $827,500 304 81.0% 90 0.5 121% 9 11 Pickering 118 $137,685,823 $1,166,829 $1,080,000 136 77.7% 49 0.6 115% 9 11 Scugog 34 $32,826,765 $965,493 $838,000 39 79.4% 24 0.9 116% 11 11 Uxbridge 18 $24,824,002 $1,379,111 $1,415,501 21 78.7% 21 0.9 105% 11 16 Whitby 193 $212,912,147 $1,103,172 $1,050,000 208 81.3% 55 0.4 120% 7 8 Dufferin County 51 $43,991,344 $862,575 $850,000 44 86.1% 11 0.5 106% 9 12 Orangeville 51 $43,991,344 $862,575 $850,000 44 86.1% 11 0.5 106% 9 12 Simcoe County 269 $297,872,398 $1,107,332 $960,100 278 77.6% 148 0.8 106% 16 20 Adjala-Tosorontio 19 $21,938,300 $1,154,647 $1,000,000 19 75.6% 13 1.1 102% 14 24 Bradford West Gwillimbury 62 $71,330,947 $1,150,499 $1,125,000 68 75.7% 32 0.7 112% 10 11 Essa 36 $34,083,125 $946,753 $837,500 28 86.1% 9 0.5 104% 14 18 Innisfil 84 $96,750,019 $1,151,786 $948,000 95 73.9% 66 1.0 104% 21 25 New Tecumseth 68 $73,770,007 $1,084,853 $932,500 68 81.1% 28 0.7 104% 16 20 Sub_Municipality # of Sales Dollar Volume Average Price Median Price New Listings SNLR (Trend) Active Listings Mos Inv (Trend) Avg. SP/LP Avg. LDOM Avg. PDOM Toronto Regional Real Estate Board SUMMARY OF EXISTING HOME TRANSACTIONS ALL TRREB AREAS ALL HOME TYPES, NOVEMBER 2021 1 1 1 2 8 3 9 4 5 3 Market Watch, November 2021 Copyright® 2021 Toronto Regional Real Estate Board 5
  • 4. TRREB Total 9,017 $10,489,684,676 $1,163,323 $999,999 10,036 73.5% 6,086 0.9 108% 13 18 City of Toronto Total 3,587 $3,933,993,086 $1,096,736 $840,000 4,249 69.2% 3,342 1.2 106% 17 23 Toronto West 883 $893,499,903 $1,011,891 $900,000 1,024 71.0% 718 1.0 108% 16 22 Toronto W01 46 $52,687,392 $1,145,378 $757,500 52 72.6% 41 0.8 108% 13 22 Toronto W02 77 $99,438,500 $1,291,409 $1,250,000 116 70.7% 60 0.7 113% 11 15 Toronto W03 62 $62,996,952 $1,016,080 $995,450 72 66.4% 46 1.0 112% 11 28 Toronto W04 99 $90,079,300 $909,892 $878,000 119 66.6% 98 1.3 106% 18 24 Toronto W05 112 $95,959,805 $856,784 $922,500 139 71.1% 102 1.1 107% 18 23 Toronto W06 139 $129,179,280 $929,347 $800,000 168 67.9% 166 1.2 105% 17 25 Toronto W07 29 $48,161,420 $1,660,739 $1,700,000 36 71.1% 19 1.0 105% 14 16 Toronto W08 181 $193,050,066 $1,066,575 $708,000 176 76.9% 101 1.0 105% 17 21 Toronto W09 56 $59,658,027 $1,065,322 $1,227,500 65 69.7% 44 1.1 110% 17 22 Toronto W10 82 $62,289,161 $759,624 $600,000 81 74.3% 41 0.9 107% 18 22 Toronto Central 1,852 $2,168,182,494 $1,170,725 $775,000 2,306 66.0% 2,160 1.4 102% 19 27 Toronto C01 533 $506,350,170 $950,000 $748,000 739 68.1% 665 1.3 102% 19 27 Toronto C02 92 $166,242,850 $1,806,988 $1,271,090 132 55.5% 176 2.3 99% 22 30 Toronto C03 67 $115,720,726 $1,727,175 $1,200,000 75 59.4% 66 1.5 103% 22 27 Toronto C04 90 $173,048,544 $1,922,762 $1,845,056 97 66.9% 71 1.2 105% 16 23 Toronto C06 48 $55,199,300 $1,149,985 $1,057,500 46 65.6% 33 1.2 101% 16 23 Toronto C07 120 $149,960,187 $1,249,668 $841,000 133 66.9% 108 1.5 104% 18 29 Toronto C08 292 $247,502,210 $847,610 $720,000 367 64.0% 358 1.5 102% 22 32 Toronto C09 37 $107,996,890 $2,918,835 $1,680,000 48 63.0% 54 1.9 97% 25 36 Toronto C10 97 $102,322,422 $1,054,870 $789,000 103 69.1% 91 1.3 106% 16 25 Toronto C11 40 $47,947,690 $1,198,692 $652,400 47 66.0% 36 1.2 103% 19 25 Toronto C12 26 $96,450,550 $3,709,637 $2,825,000 45 51.8% 93 3.2 97% 19 26 Toronto C13 78 $84,931,754 $1,088,869 $855,000 107 67.5% 81 1.2 106% 19 26 Toronto C14 160 $162,516,243 $1,015,727 $691,500 169 68.1% 155 1.4 103% 17 24 Toronto C15 172 $151,992,958 $883,680 $691,250 198 70.1% 173 1.2 106% 17 22 Toronto East 852 $872,310,689 $1,023,839 $999,500 919 74.6% 464 0.7 112% 12 16 Toronto E01 65 $79,041,792 $1,216,028 $1,075,000 75 72.9% 29 0.7 112% 10 11 Toronto E02 69 $93,559,128 $1,355,929 $1,212,000 76 72.0% 41 0.7 110% 10 16 Toronto E03 90 $106,212,648 $1,180,141 $1,200,000 100 66.7% 77 0.9 110% 18 27 Toronto E04 107 $100,783,465 $941,902 $1,055,000 119 75.1% 52 0.7 116% 11 14 Toronto E05 91 $82,458,590 $906,138 $805,000 87 75.6% 48 0.9 113% 13 16 Toronto E06 34 $37,618,429 $1,106,424 $894,000 48 66.2% 40 1.0 107% 11 14 Toronto E07 98 $89,096,287 $909,146 $758,000 96 78.7% 28 0.7 116% 11 14 Toronto E08 62 $60,323,436 $972,959 $948,650 73 73.9% 42 0.9 110% 13 17 Toronto E09 128 $110,123,496 $860,340 $753,000 116 83.1% 40 0.6 113% 13 16 Toronto E10 53 $62,517,539 $1,179,576 $1,092,000 69 74.2% 36 0.8 113% 12 13 Toronto E11 55 $50,575,879 $919,561 $927,000 60 77.9% 31 0.7 111% 12 13 Municipality # of Sales Dollar Volume Average Price Median Price New Listings SNLR (Trend) Active Listings Mos Inv (Trend) Avg. SP/LP Avg. LDOM Avg. PDOM Toronto Regional Real Estate Board ALL HOME TYPES, NOVEMBER 2021 SUMMARY OF EXISTING HOME TRANSACTIONS CITY OF TORONTO MUNICIPAL BREAKDOWN 1 1 1 2 8 3 9 4 5 4 Market Watch, November 2021 Copyright® 2021 Toronto Regional Real Estate Board 5
  • 5. TRREB Total 115,716 $126,386,437,441 $1,092,212 $940,000 161,409 106% 13 18 Halton Region 11,310 $13,890,632,953 $1,228,173 $1,085,000 14,481 105% 11 14 Burlington 3,276 $3,531,831,840 $1,078,093 $977,359 4,068 106% 12 14 Halton Hills 1,076 $1,222,068,861 $1,135,752 $1,005,000 1,334 107% 10 12 Milton 2,795 $2,977,645,172 $1,065,347 $981,000 3,658 106% 9 12 Oakville 4,163 $6,159,087,080 $1,479,483 $1,300,000 5,421 104% 12 17 Peel Region 23,432 $24,489,625,216 $1,045,136 $950,000 31,800 105% 11 15 Brampton 11,387 $11,748,763,039 $1,031,770 $955,600 15,465 105% 9 13 Caledon 1,278 $1,853,086,261 $1,449,989 $1,300,000 1,876 103% 12 18 Mississauga 10,767 $10,887,775,916 $1,011,217 $890,000 14,459 105% 13 18 City of Toronto 41,133 $43,544,373,240 $1,058,624 $835,000 61,091 105% 16 22 Toronto West 10,346 $10,363,139,701 $1,001,657 $880,000 14,958 106% 15 20 Toronto Central 20,586 $23,008,903,611 $1,117,697 $765,000 32,063 103% 18 26 Toronto East 10,201 $10,172,329,928 $997,189 $950,000 14,070 111% 12 15 York Region 21,308 $27,374,117,965 $1,284,687 $1,184,995 30,468 106% 14 20 Aurora 1,335 $1,724,134,553 $1,291,487 $1,180,000 1,856 105% 14 18 East Gwillimbury 857 $1,083,033,376 $1,263,750 $1,198,000 1,157 107% 13 16 Georgina 1,223 $1,078,601,195 $881,931 $820,000 1,688 107% 14 17 King 536 $1,097,081,732 $2,046,794 $1,879,400 863 99% 27 37 Markham 5,407 $6,951,036,574 $1,285,563 $1,228,000 7,551 109% 13 18 Newmarket 1,821 $2,012,888,094 $1,105,375 $1,051,000 2,399 107% 10 13 Richmond Hill 3,856 $5,237,709,825 $1,358,327 $1,260,000 5,889 105% 16 22 Vaughan 5,254 $6,827,555,875 $1,299,497 $1,200,995 7,658 104% 15 21 Whitchurch-Stouffville 1,019 $1,362,076,741 $1,336,680 $1,200,000 1,407 105% 16 21 Durham Region 14,052 $12,936,983,133 $920,651 $857,839 17,743 113% 9 11 Ajax 2,047 $1,991,838,260 $973,052 $921,000 2,619 113% 8 10 Brock 293 $231,705,908 $790,805 $740,000 385 105% 13 17 Clarington 2,515 $2,218,304,923 $882,030 $825,000 3,073 115% 9 10 Oshawa 4,170 $3,306,114,727 $792,833 $760,000 5,226 115% 9 11 Pickering 1,753 $1,804,720,770 $1,029,504 $930,000 2,311 110% 10 12 Scugog 370 $364,867,271 $986,128 $897,893 482 108% 15 17 Uxbridge 350 $449,288,253 $1,283,681 $1,173,052 450 106% 15 18 Whitby 2,554 $2,570,143,021 $1,006,321 $951,000 3,197 114% 7 9 Dufferin County 693 $552,307,416 $796,980 $776,000 812 106% 10 12 Orangeville 693 $552,307,416 $796,980 $776,000 812 106% 10 12 Simcoe County 3,788 $3,598,397,518 $949,947 $870,750 5,014 104% 14 17 Adjala-Tosorontio 212 $249,488,691 $1,176,833 $1,049,000 283 102% 18 21 Bradford West Gwillimbury 886 $945,431,816 $1,067,079 $999,000 1,217 106% 11 14 Essa 473 $396,453,200 $838,167 $760,000 565 104% 12 14 Innisfil 1,226 $1,128,698,810 $920,635 $840,500 1,702 103% 16 20 New Tecumseth 991 $878,325,001 $886,302 $827,000 1,247 104% 13 16 Sub_Municipality Number of Sales Dollar Volume Average Price Median Price New Listings Avg. SP/LP Avg. LDOM Avg. PDOM Toronto Regional Real Estate Board SUMMARY OF EXISTING HOME TRANSACTIONS ALL TRREB AREAS ALL HOME TYPES, YEAR-TO-DATE 2021 1 1 1 2 4 5 5 Market Watch, November 2021 Copyright® 2021 Toronto Regional Real Estate Board 5
  • 6. TRREB Total 115,716 $126,386,437,441 $1,092,212 $940,000 161,409 106% 13 18 City of Toronto Total 41,133 $43,544,373,240 $1,058,624 $835,000 61,091 105% 16 22 Toronto West 10,346 $10,363,139,701 $1,001,657 $880,000 14,958 106% 15 20 Toronto W01 625 $800,203,979 $1,280,326 $975,000 890 109% 12 16 Toronto W02 992 $1,238,493,526 $1,248,481 $1,200,000 1,436 112% 10 14 Toronto W03 733 $739,336,791 $1,008,645 $980,000 1,123 110% 14 20 Toronto W04 1,033 $904,079,476 $875,198 $815,000 1,606 106% 17 23 Toronto W05 1,399 $1,160,457,365 $829,491 $860,000 1,988 105% 16 21 Toronto W06 1,858 $1,699,159,989 $914,510 $800,000 2,819 104% 16 23 Toronto W07 290 $464,822,214 $1,602,835 $1,460,000 421 107% 13 19 Toronto W08 2,004 $2,185,413,503 $1,090,526 $720,000 2,671 104% 16 21 Toronto W09 539 $523,002,590 $970,320 $985,000 793 106% 16 22 Toronto W10 873 $648,170,268 $742,463 $620,000 1,211 105% 15 20 Toronto Central 20,586 $23,008,903,611 $1,117,697 $765,000 32,063 103% 18 26 Toronto C01 6,526 $5,647,897,700 $865,446 $723,000 9,852 103% 18 26 Toronto C02 1,003 $1,648,042,503 $1,643,113 $1,220,000 1,847 101% 22 32 Toronto C03 615 $1,026,918,784 $1,669,787 $1,279,000 1,064 104% 16 22 Toronto C04 992 $2,169,076,039 $2,186,569 $2,000,000 1,492 103% 15 21 Toronto C06 440 $493,308,908 $1,121,157 $807,500 696 103% 15 22 Toronto C07 1,332 $1,507,757,713 $1,131,950 $796,500 2,060 103% 19 27 Toronto C08 3,040 $2,426,580,850 $798,217 $692,500 4,925 103% 19 27 Toronto C09 353 $854,227,110 $2,419,907 $1,680,000 559 100% 24 32 Toronto C10 1,004 $1,016,192,255 $1,012,144 $766,850 1,476 104% 18 26 Toronto C11 515 $596,188,276 $1,157,647 $660,000 797 104% 15 23 Toronto C12 359 $1,214,437,562 $3,382,834 $2,850,000 714 98% 24 35 Toronto C13 811 $998,722,468 $1,231,470 $925,000 1,252 104% 17 22 Toronto C14 1,636 $1,660,994,382 $1,015,278 $709,190 2,447 102% 18 25 Toronto C15 1,960 $1,748,559,061 $892,122 $685,000 2,882 104% 17 23 Toronto East 10,201 $10,172,329,928 $997,189 $950,000 14,070 111% 12 15 Toronto E01 989 $1,232,149,209 $1,245,854 $1,232,500 1,409 115% 9 12 Toronto E02 797 $1,110,549,878 $1,393,413 $1,290,000 1,142 111% 10 14 Toronto E03 1,137 $1,370,500,322 $1,205,365 $1,185,000 1,740 111% 12 16 Toronto E04 1,167 $1,015,406,063 $870,099 $885,000 1,611 109% 12 16 Toronto E05 1,017 $915,768,458 $900,461 $800,000 1,380 111% 13 15 Toronto E06 429 $482,627,796 $1,125,007 $999,999 681 107% 11 15 Toronto E07 1,096 $930,562,303 $849,053 $770,050 1,433 111% 13 16 Toronto E08 708 $695,433,952 $982,251 $952,500 982 107% 13 18 Toronto E09 1,260 $989,900,891 $785,636 $686,500 1,535 110% 13 17 Toronto E10 698 $725,790,780 $1,039,815 $1,015,000 971 109% 12 15 Toronto E11 903 $703,640,276 $779,225 $780,000 1,186 108% 13 15 Municipality Number of Sales Dollar Volume Average Price Median Price New Listings Avg. SP/LP Avg. LDOM Avg. PDOM Toronto Regional Real Estate Board SUMMARY OF EXISTING HOME TRANSACTIONS CITY OF TORONTO MUNICIPAL BREAKDOWN ALL HOME TYPES, YEAR-TO-DATE 2021 1 1 1 2 4 5 6 Market Watch, November 2021 Copyright® 2021 Toronto Regional Real Estate Board 5
  • 7. TRREB Total 3,857 $6,047,129,227 $1,567,832 $1,380,000 4,384 2,499 109% 12 Halton Region 411 $725,914,437 $1,766,215 $1,500,000 416 196 107% 11 Burlington 113 $167,382,019 $1,481,257 $1,350,000 121 52 109% 10 Halton Hills 55 $79,808,888 $1,451,071 $1,350,000 56 32 109% 13 Milton 83 $129,997,389 $1,566,234 $1,377,000 74 28 108% 10 Oakville 160 $348,726,141 $2,179,538 $1,768,500 165 84 105% 11 Peel Region 745 $1,108,657,942 $1,488,131 $1,390,999 847 400 108% 9 Brampton 426 $584,973,415 $1,373,177 $1,308,900 467 141 110% 7 Caledon 65 $114,122,500 $1,755,731 $1,625,000 78 84 102% 17 Mississauga 254 $409,562,027 $1,612,449 $1,480,000 302 175 108% 10 City of Toronto 918 $1,659,728,228 $1,807,983 $1,422,556 1,136 756 108% 13 Toronto West 288 $433,031,769 $1,503,583 $1,344,944 344 203 110% 12 Toronto Central 277 $746,516,355 $2,695,005 $2,227,000 385 384 102% 16 Toronto East 353 $480,180,104 $1,360,284 $1,262,000 407 169 114% 11 York Region 863 $1,522,397,637 $1,764,076 $1,630,000 1,033 759 108% 15 Aurora 52 $92,152,568 $1,772,165 $1,605,000 67 49 105% 17 East Gwillimbury 51 $72,164,777 $1,414,996 $1,450,000 66 39 113% 11 Georgina 74 $79,012,424 $1,067,735 $1,062,500 97 52 111% 10 King 29 $68,656,600 $2,367,469 $2,300,000 48 61 100% 18 Markham 178 $335,422,751 $1,884,397 $1,696,500 217 154 112% 11 Newmarket 87 $120,015,111 $1,379,484 $1,350,000 78 23 112% 8 Richmond Hill 172 $337,058,693 $1,959,644 $1,782,500 199 187 106% 21 Vaughan 171 $335,508,284 $1,962,037 $1,760,000 204 147 106% 17 Whitchurch-Stouffville 49 $82,406,429 $1,681,764 $1,562,000 57 47 105% 19 Durham Region 677 $750,453,037 $1,108,498 $1,071,000 701 248 119% 8 Ajax 94 $109,487,671 $1,164,762 $1,150,000 98 29 119% 6 Brock 14 $10,843,000 $774,500 $712,500 17 17 110% 6 Clarington 122 $125,264,560 $1,026,759 $995,000 123 45 122% 8 Oshawa 213 $205,352,608 $964,097 $930,000 206 58 121% 8 Pickering 65 $95,814,480 $1,474,069 $1,358,000 72 24 115% 11 Scugog 30 $29,829,765 $994,326 $917,633 36 19 116% 11 Uxbridge 17 $23,534,002 $1,384,353 $1,531,000 16 17 106% 11 Whitby 122 $150,326,951 $1,232,188 $1,189,000 133 39 119% 8 Dufferin County 33 $31,935,844 $967,753 $899,000 32 10 106% 7 Orangeville 33 $31,935,844 $967,753 $899,000 32 10 106% 7 Simcoe County 210 $248,042,102 $1,181,153 $1,071,500 219 130 105% 17 Adjala-Tosorontio 19 $21,938,300 $1,154,647 $1,000,000 19 13 102% 14 Bradford West Gwillimbury 45 $55,634,949 $1,236,332 $1,270,000 52 28 112% 10 Essa 30 $29,668,125 $988,938 $862,500 20 8 103% 16 Innisfil 73 $86,579,920 $1,186,026 $1,025,000 80 57 104% 21 New Tecumseth 43 $54,220,808 $1,260,949 $1,130,000 48 24 103% 18 Municipality Number of Sales Dollar Volume Average Price Median Price New Listings Active Listings Avg. SP/LP Avg. LDOM DETACHED, NOVEMBER 2021 Toronto Regional Real Estate Board SUMMARY OF EXISTING HOME TRANSACTIONS ALL TRREB AREAS 1 1 2 4 5 1 1 3 7 Market Watch, November 2021 Copyright® 2021 Toronto Regional Real Estate Board
  • 8. TRREB Total 3,857 $6,047,129,227 $1,567,832 $1,380,000 4,384 2,499 109% 12 City of Toronto 918 $1,659,728,228 $1,807,983 $1,422,556 1,136 756 108% 13 Toronto West 288 $433,031,769 $1,503,583 $1,344,944 344 203 110% 12 Toronto W01 10 $22,533,484 $2,253,348 $2,200,000 10 12 111% 11 Toronto W02 24 $41,908,000 $1,746,167 $1,733,000 40 27 119% 11 Toronto W03 35 $35,809,852 $1,023,139 $956,000 37 23 111% 10 Toronto W04 42 $52,611,500 $1,252,655 $1,195,000 51 42 110% 16 Toronto W05 28 $34,766,990 $1,241,678 $1,188,500 35 18 110% 12 Toronto W06 27 $39,896,840 $1,477,661 $1,488,000 32 17 111% 11 Toronto W07 18 $37,297,420 $2,072,079 $1,805,000 25 12 104% 14 Toronto W08 50 $99,444,130 $1,988,883 $1,540,150 54 29 106% 12 Toronto W09 29 $41,398,042 $1,427,519 $1,350,000 35 14 113% 12 Toronto W10 25 $27,365,511 $1,094,620 $1,120,000 25 9 110% 10 Toronto Central 277 $746,516,355 $2,695,005 $2,227,000 385 384 102% 16 Toronto C01 15 $34,502,000 $2,300,133 $2,227,000 13 7 103% 24 Toronto C02 8 $29,670,000 $3,708,750 $3,075,000 14 18 98% 15 Toronto C03 27 $70,321,488 $2,604,500 $1,801,888 36 28 103% 17 Toronto C04 51 $136,203,499 $2,670,657 $2,350,000 59 36 105% 13 Toronto C06 23 $39,250,900 $1,706,561 $1,589,900 24 14 101% 14 Toronto C07 40 $88,918,000 $2,222,950 $1,922,500 59 39 105% 10 Toronto C08 0 $0 $0 - 3 4 - - Toronto C09 11 $56,815,000 $5,165,000 $5,500,000 11 9 96% 30 Toronto C10 10 $27,455,000 $2,745,500 $2,642,500 17 11 109% 11 Toronto C11 10 $28,575,680 $2,857,568 $2,539,090 13 6 103% 11 Toronto C12 19 $86,040,300 $4,528,437 $4,350,000 28 74 96% 21 Toronto C13 19 $39,989,000 $2,104,684 $1,800,000 36 35 105% 12 Toronto C14 26 $67,251,888 $2,586,611 $2,110,000 44 77 103% 22 Toronto C15 18 $41,523,600 $2,306,867 $2,016,000 28 26 106% 20 Toronto East 353 $480,180,104 $1,360,284 $1,262,000 407 169 114% 11 Toronto E01 12 $20,785,000 $1,732,083 $1,725,000 14 2 107% 9 Toronto E02 23 $42,516,443 $1,848,541 $1,670,500 24 11 115% 9 Toronto E03 47 $65,054,088 $1,384,130 $1,298,000 55 34 108% 21 Toronto E04 56 $66,061,307 $1,179,666 $1,158,000 74 29 121% 7 Toronto E05 26 $37,228,491 $1,431,865 $1,397,500 28 10 116% 10 Toronto E06 20 $26,701,900 $1,335,095 $1,177,500 27 13 107% 9 Toronto E07 29 $41,459,400 $1,429,634 $1,350,000 32 10 120% 7 Toronto E08 29 $40,189,736 $1,385,853 $1,340,000 40 22 112% 10 Toronto E09 58 $68,377,521 $1,178,923 $1,170,050 63 17 119% 7 Toronto E10 30 $44,524,839 $1,484,161 $1,396,944 29 14 113% 16 Toronto E11 23 $27,281,379 $1,186,147 $1,240,000 21 7 113% 12 Municipality Number of Sales Dollar Volume Average Price Median Price New Listings Active Listings Avg. SP/LP Avg. LDOM DETACHED, NOVEMBER 2021 Toronto Regional Real Estate Board SUMMARY OF EXISTING HOME TRANSACTIONS CITY OF TORONTO MUNICIPAL BREAKDOWN 1 1 2 4 5 1 1 3 8 Market Watch, November 2021 Copyright® 2021 Toronto Regional Real Estate Board
  • 9. TRREB Total 755 $910,542,450 $1,206,016 $1,120,111 805 250 113% 8 Halton Region 38 $43,300,664 $1,139,491 $1,140,500 35 6 118% 4 Burlington 7 $7,156,245 $1,022,321 $999,995 6 1 118% 6 Halton Hills 3 $2,716,500 $905,500 $925,000 2 0 121% 3 Milton 18 $20,647,919 $1,147,107 $1,140,500 19 4 116% 4 Oakville 10 $12,780,000 $1,278,000 $1,253,000 8 1 122% 4 Peel Region 239 $256,027,699 $1,071,246 $1,065,000 251 50 113% 6 Brampton 142 $148,497,854 $1,045,760 $1,047,500 156 32 113% 5 Caledon 2 $1,968,000 $984,000 $984,000 3 1 107% 3 Mississauga 95 $105,561,845 $1,111,177 $1,120,111 92 17 114% 7 City of Toronto 283 $405,252,470 $1,431,988 $1,215,000 307 146 110% 11 Toronto West 91 $108,873,973 $1,196,417 $1,150,000 97 37 111% 11 Toronto Central 101 $187,397,824 $1,855,424 $1,542,000 114 71 108% 12 Toronto East 91 $108,980,673 $1,197,590 $1,125,000 96 38 115% 9 York Region 108 $132,636,451 $1,228,115 $1,246,400 118 26 118% 6 Aurora 5 $6,543,000 $1,308,600 $1,336,000 8 4 129% 7 East Gwillimbury 2 $2,440,000 $1,220,000 $1,220,000 4 2 102% 3 Georgina 0 $0 $0 - 0 0 - - King 0 $0 $0 - 2 1 - - Markham 29 $38,063,600 $1,312,538 $1,305,000 28 3 120% 6 Newmarket 21 $21,236,200 $1,011,248 $950,000 21 4 112% 6 Richmond Hill 14 $17,246,500 $1,231,893 $1,272,500 13 5 112% 9 Vaughan 35 $44,714,151 $1,277,547 $1,275,000 40 6 121% 5 Whitchurch-Stouffville 2 $2,393,000 $1,196,500 $1,196,500 2 1 126% 5 Durham Region 67 $56,606,169 $844,868 $825,000 75 19 125% 7 Ajax 11 $11,253,500 $1,023,045 $1,050,000 12 2 125% 4 Brock 0 $0 $0 - 0 0 - - Clarington 6 $4,911,500 $818,583 $825,750 7 2 131% 7 Oshawa 35 $26,635,069 $761,002 $777,000 36 9 125% 8 Pickering 6 $5,779,800 $963,300 $962,250 9 4 120% 5 Scugog 2 $1,492,000 $746,000 $746,000 1 0 121% 7 Uxbridge 0 $0 $0 - 0 0 - - Whitby 7 $6,534,300 $933,471 $907,500 10 2 121% 4 Dufferin County 5 $3,575,000 $715,000 $700,000 3 0 103% 8 Orangeville 5 $3,575,000 $715,000 $700,000 3 0 103% 8 Simcoe County 15 $13,143,997 $876,266 $925,000 16 3 108% 9 Adjala-Tosorontio 0 $0 $0 - 0 0 - - Bradford West Gwillimbury 8 $7,282,998 $910,375 $922,500 8 2 107% 9 Essa 0 $0 $0 - 1 1 - - Innisfil 1 $940,000 $940,000 $940,000 2 0 111% 5 New Tecumseth 6 $4,920,999 $820,167 $847,500 5 0 108% 10 Municipality Number of Sales Dollar Volume Average Price Median Price New Listings Active Listings Avg. SP/LP Avg. LDOM SEMI-DETACHED, NOVEMBER 2021 Toronto Regional Real Estate Board SUMMARY OF EXISTING HOME TRANSACTIONS ALL TRREB AREAS 1 1 2 4 5 1 1 3 9 Market Watch, November 2021 Copyright® 2021 Toronto Regional Real Estate Board
  • 10. TRREB Total 755 $910,542,450 $1,206,016 $1,120,111 805 250 113% 8 City of Toronto 283 $405,252,470 $1,431,988 $1,215,000 307 146 110% 11 Toronto West 91 $108,873,973 $1,196,417 $1,150,000 97 37 111% 11 Toronto W01 5 $8,222,008 $1,644,402 $1,775,000 10 5 116% 11 Toronto W02 19 $25,861,210 $1,361,116 $1,411,000 23 7 107% 9 Toronto W03 20 $22,517,100 $1,125,855 $1,117,500 20 8 118% 10 Toronto W04 6 $7,644,000 $1,274,000 $1,090,000 3 1 103% 16 Toronto W05 27 $27,784,906 $1,029,071 $1,002,005 30 12 109% 14 Toronto W06 7 $8,701,000 $1,243,000 $1,215,000 6 2 113% 6 Toronto W07 0 $0 $0 - 0 0 - - Toronto W08 1 $1,285,000 $1,285,000 $1,285,000 1 1 122% 5 Toronto W09 3 $3,647,699 $1,215,900 $1,265,000 1 0 108% 26 Toronto W10 3 $3,211,050 $1,070,350 $1,055,000 3 1 107% 6 Toronto Central 101 $187,397,824 $1,855,424 $1,542,000 114 71 108% 12 Toronto C01 23 $41,481,500 $1,803,543 $1,820,000 28 23 106% 17 Toronto C02 14 $47,868,000 $3,419,143 $3,072,500 16 13 102% 15 Toronto C03 8 $10,472,050 $1,309,006 $1,413,500 10 6 116% 9 Toronto C04 5 $8,110,100 $1,622,020 $1,450,000 6 3 122% 4 Toronto C06 0 $0 $0 - 0 1 - - Toronto C07 4 $4,465,000 $1,116,250 $1,140,000 3 3 105% 14 Toronto C08 6 $10,948,887 $1,824,815 $1,842,500 7 7 102% 17 Toronto C09 4 $17,639,000 $4,409,750 $3,324,500 2 1 101% 26 Toronto C10 10 $16,783,000 $1,678,300 $1,605,000 12 8 123% 5 Toronto C11 1 $1,485,000 $1,485,000 $1,485,000 0 0 93% 61 Toronto C12 0 $0 $0 - 0 0 - - Toronto C13 13 $13,358,999 $1,027,615 $1,006,000 12 1 114% 5 Toronto C14 1 $1,120,000 $1,120,000 $1,120,000 1 0 113% 13 Toronto C15 12 $13,666,288 $1,138,857 $1,135,000 17 5 114% 7 Toronto East 91 $108,980,673 $1,197,590 $1,125,000 96 38 115% 9 Toronto E01 16 $19,846,367 $1,240,398 $1,180,000 16 7 114% 7 Toronto E02 20 $28,419,385 $1,420,969 $1,427,753 18 8 111% 8 Toronto E03 24 $29,760,410 $1,240,017 $1,307,500 21 7 119% 11 Toronto E04 6 $5,754,000 $959,000 $923,000 6 4 108% 10 Toronto E05 4 $4,506,000 $1,126,500 $1,137,500 5 2 127% 6 Toronto E06 5 $4,270,500 $854,100 $851,400 6 2 114% 8 Toronto E07 6 $6,538,000 $1,089,667 $1,093,000 8 1 125% 3 Toronto E08 1 $905,800 $905,800 $905,800 2 1 121% 9 Toronto E09 2 $2,216,000 $1,108,000 $1,108,000 5 3 117% 5 Toronto E10 3 $2,744,000 $914,667 $995,000 4 1 108% 8 Toronto E11 4 $4,020,211 $1,005,053 $966,106 5 2 110% 18 Municipality Number of Sales Dollar Volume Average Price Median Price New Listings Active Listings Avg. SP/LP Avg. LDOM SEMI-DETACHED, NOVEMBER 2021 Toronto Regional Real Estate Board SUMMARY OF EXISTING HOME TRANSACTIONS CITY OF TORONTO MUNICIPAL BREAKDOWN 1 1 2 4 5 1 1 3 10 Market Watch, November 2021 Copyright® 2021 Toronto Regional Real Estate Board
  • 11. TRREB Total 730 $799,765,816 $1,095,570 $1,022,500 783 266 114% 8 Halton Region 133 $152,973,632 $1,150,178 $1,075,000 139 32 113% 6 Burlington 18 $19,368,230 $1,076,013 $1,024,500 14 3 118% 5 Halton Hills 5 $4,807,000 $961,400 $975,000 5 2 111% 7 Milton 54 $55,423,428 $1,026,360 $1,000,000 69 19 114% 4 Oakville 56 $73,374,974 $1,310,267 $1,230,000 51 8 111% 9 Peel Region 149 $145,061,498 $973,567 $970,000 154 32 113% 6 Brampton 112 $106,496,910 $950,865 $951,056 119 25 113% 5 Caledon 14 $14,174,999 $1,012,500 $1,031,000 14 3 113% 4 Mississauga 23 $24,389,589 $1,060,417 $1,050,000 21 4 111% 8 City of Toronto 116 $148,422,512 $1,279,504 $1,191,444 131 81 112% 13 Toronto West 38 $45,036,839 $1,185,180 $1,210,000 39 18 110% 11 Toronto Central 39 $60,301,680 $1,546,197 $1,371,180 55 49 108% 19 Toronto East 39 $43,083,993 $1,104,718 $1,030,500 37 14 121% 9 York Region 185 $223,270,875 $1,206,870 $1,201,000 215 80 116% 9 Aurora 7 $7,677,000 $1,096,714 $1,125,000 9 3 114% 6 East Gwillimbury 5 $5,067,900 $1,013,580 $947,900 6 1 111% 3 Georgina 2 $1,659,500 $829,750 $829,750 2 1 103% 6 King 3 $3,403,000 $1,134,333 $885,000 2 0 114% 10 Markham 52 $68,877,841 $1,324,574 $1,321,444 65 28 118% 13 Newmarket 21 $21,841,609 $1,040,077 $1,030,110 15 5 110% 15 Richmond Hill 45 $55,671,405 $1,237,142 $1,252,000 46 15 121% 6 Vaughan 42 $50,864,820 $1,211,067 $1,200,500 58 24 112% 7 Whitchurch-Stouffville 8 $8,207,800 $1,025,975 $1,057,900 12 3 120% 4 Durham Region 111 $99,056,899 $892,404 $910,000 113 37 120% 6 Ajax 21 $19,646,980 $935,570 $950,000 22 10 115% 6 Brock 0 $0 $0 - 0 0 - - Clarington 15 $12,686,700 $845,780 $845,000 18 7 129% 5 Oshawa 22 $16,634,680 $756,122 $827,278 19 6 121% 6 Pickering 13 $12,229,043 $940,696 $945,000 9 1 118% 6 Scugog 0 $0 $0 - 2 5 - - Uxbridge 0 $0 $0 - 2 1 - - Whitby 40 $37,859,496 $946,487 $954,000 41 7 120% 6 Dufferin County 6 $4,749,000 $791,500 $782,000 5 0 106% 9 Orangeville 6 $4,749,000 $791,500 $782,000 5 0 106% 9 Simcoe County 30 $26,231,400 $874,380 $860,100 26 4 112% 7 Adjala-Tosorontio 0 $0 $0 - 0 0 - - Bradford West Gwillimbury 7 $6,816,000 $973,714 $999,000 6 1 116% 10 Essa 4 $2,827,000 $706,750 $745,500 5 0 110% 4 Innisfil 7 $6,735,200 $962,171 $910,000 7 2 110% 7 New Tecumseth 12 $9,853,200 $821,100 $840,000 8 1 111% 7 Municipality Number of Sales Dollar Volume Average Price Median Price New Listings Active Listings Avg. SP/LP Avg. LDOM ATT/ROW/TWNHOUSE, NOVEMBER 2021 Toronto Regional Real Estate Board SUMMARY OF EXISTING HOME TRANSACTIONS ALL TRREB AREAS 1 1 2 4 5 1 1 3 11 Market Watch, November 2021 Copyright® 2021 Toronto Regional Real Estate Board
  • 12. TRREB Total 730 $799,765,816 $1,095,570 $1,022,500 783 266 114% 8 City of Toronto 116 $148,422,512 $1,279,504 $1,191,444 131 81 112% 13 Toronto West 38 $45,036,839 $1,185,180 $1,210,000 39 18 110% 11 Toronto W01 2 $2,700,000 $1,350,000 $1,350,000 4 3 111% 8 Toronto W02 8 $10,126,751 $1,265,844 $1,215,750 11 4 116% 10 Toronto W03 1 $678,000 $678,000 $678,000 1 2 97% 51 Toronto W04 1 $1,090,000 $1,090,000 $1,090,000 1 1 99% 0 Toronto W05 9 $8,551,088 $950,121 $935,000 7 4 107% 12 Toronto W06 3 $3,762,500 $1,254,167 $1,275,500 4 1 112% 5 Toronto W07 4 $5,500,000 $1,375,000 $1,355,000 3 1 118% 10 Toronto W08 7 $9,183,000 $1,311,857 $1,310,000 5 1 107% 15 Toronto W09 1 $1,250,000 $1,250,000 $1,250,000 1 1 98% 5 Toronto W10 2 $2,195,500 $1,097,750 $1,097,750 2 0 107% 4 Toronto Central 39 $60,301,680 $1,546,197 $1,371,180 55 49 108% 19 Toronto C01 12 $18,788,180 $1,565,682 $1,465,000 20 21 108% 14 Toronto C02 6 $9,834,000 $1,639,000 $1,314,000 5 6 104% 16 Toronto C03 1 $2,925,000 $2,925,000 $2,925,000 1 2 98% 66 Toronto C04 2 $2,636,000 $1,318,000 $1,318,000 0 2 98% 22 Toronto C06 1 $1,275,000 $1,275,000 $1,275,000 1 0 116% 6 Toronto C07 1 $1,005,500 $1,005,500 $1,005,500 3 2 113% 2 Toronto C08 10 $16,112,000 $1,611,200 $1,530,000 11 9 110% 16 Toronto C09 0 $0 $0 - 1 1 - - Toronto C10 0 $0 $0 - 0 0 - - Toronto C11 1 $1,347,000 $1,347,000 $1,347,000 1 0 135% 6 Toronto C12 0 $0 $0 - 0 0 - - Toronto C13 2 $2,322,000 $1,161,000 $1,161,000 4 1 119% 20 Toronto C14 3 $4,057,000 $1,352,333 $1,340,000 8 5 105% 47 Toronto C15 0 $0 $0 - 0 0 - - Toronto East 39 $43,083,993 $1,104,718 $1,030,500 37 14 121% 9 Toronto E01 12 $16,180,575 $1,348,381 $1,348,750 14 7 128% 7 Toronto E02 2 $2,240,000 $1,120,000 $1,120,000 3 1 119% 5 Toronto E03 1 $980,000 $980,000 $980,000 1 0 115% 2 Toronto E04 6 $6,161,788 $1,026,965 $1,032,450 6 2 111% 14 Toronto E05 0 $0 $0 - 2 2 - - Toronto E06 1 $875,030 $875,030 $875,030 1 0 113% 13 Toronto E07 4 $4,488,600 $1,122,150 $1,114,300 3 1 132% 9 Toronto E08 0 $0 $0 - 0 0 - - Toronto E09 1 $940,000 $940,000 $940,000 1 0 118% 8 Toronto E10 5 $4,721,000 $944,200 $945,000 2 0 112% 9 Toronto E11 7 $6,497,000 $928,143 $928,000 4 1 117% 9 Municipality Number of Sales Dollar Volume Average Price Median Price New Listings Active Listings Avg. SP/LP Avg. LDOM ATT/ROW/TWNHOUSE, NOVEMBER 2021 Toronto Regional Real Estate Board SUMMARY OF EXISTING HOME TRANSACTIONS CITY OF TORONTO MUNICIPAL BREAKDOWN 1 1 2 4 5 1 1 3 12 Market Watch, November 2021 Copyright® 2021 Toronto Regional Real Estate Board
  • 13. TRREB Total 719 $594,235,456 $826,475 $800,000 714 329 110% 13 Halton Region 80 $63,986,360 $799,830 $760,250 79 21 110% 7 Burlington 37 $29,647,409 $801,281 $730,000 34 6 109% 7 Halton Hills 2 $1,391,000 $695,500 $695,500 2 1 118% 6 Milton 12 $9,345,906 $778,826 $783,550 11 4 109% 5 Oakville 29 $23,602,045 $813,864 $760,000 32 10 111% 7 Peel Region 211 $173,735,244 $823,390 $820,000 194 60 110% 14 Brampton 70 $54,474,422 $778,206 $781,500 60 11 112% 11 Caledon 1 $852,001 $852,001 $852,001 1 1 105% 5 Mississauga 140 $118,408,821 $845,777 $830,503 133 48 109% 15 City of Toronto 265 $225,627,635 $851,425 $812,000 285 188 108% 16 Toronto West 85 $66,714,426 $784,876 $706,500 110 75 107% 18 Toronto Central 92 $90,288,638 $981,398 $888,750 104 84 106% 18 Toronto East 88 $68,624,571 $779,825 $800,000 71 29 111% 12 York Region 82 $73,705,579 $898,849 $861,000 83 41 110% 14 Aurora 13 $10,586,999 $814,385 $788,000 9 5 107% 21 East Gwillimbury 0 $0 $0 - 1 1 - - Georgina 1 $665,000 $665,000 $665,000 2 1 111% 6 King 0 $0 $0 - 0 0 - - Markham 29 $27,581,493 $951,086 $915,000 33 13 111% 10 Newmarket 9 $7,716,517 $857,391 $862,000 10 1 114% 9 Richmond Hill 9 $9,127,000 $1,014,111 $893,000 10 11 113% 10 Vaughan 19 $16,686,570 $878,241 $850,000 16 8 108% 19 Whitchurch-Stouffville 2 $1,342,000 $671,000 $671,000 2 1 104% 7 Durham Region 75 $53,505,238 $713,403 $696,000 69 18 120% 7 Ajax 8 $6,212,500 $776,563 $780,000 5 1 122% 12 Brock 0 $0 $0 - 0 0 - - Clarington 7 $5,005,900 $715,129 $625,000 4 0 124% 7 Oshawa 31 $20,335,338 $655,979 $670,000 28 6 124% 6 Pickering 19 $14,259,500 $750,500 $751,500 22 5 115% 7 Scugog 1 $826,000 $826,000 $826,000 0 0 127% 6 Uxbridge 1 $1,290,000 $1,290,000 $1,290,000 2 2 99% 18 Whitby 8 $5,576,000 $697,000 $685,000 8 4 120% 8 Dufferin County 4 $2,282,500 $570,625 $570,000 3 1 105% 11 Orangeville 4 $2,282,500 $570,625 $570,000 3 1 105% 11 Simcoe County 2 $1,392,900 $696,450 $696,450 1 0 109% 64 Adjala-Tosorontio 0 $0 $0 - 0 0 - - Bradford West Gwillimbury 1 $707,000 $707,000 $707,000 1 0 118% 2 Essa 0 $0 $0 - 0 0 - - Innisfil 1 $685,900 $685,900 $685,900 0 0 101% 126 New Tecumseth 0 $0 $0 - 0 0 - - Municipality Number of Sales Dollar Volume Average Price Median Price New Listings Active Listings Avg. SP/LP Avg. LDOM CONDO TOWNHOUSE, NOVEMBER 2021 Toronto Regional Real Estate Board SUMMARY OF EXISTING HOME TRANSACTIONS ALL TRREB AREAS 1 1 2 4 5 1 1 3 13 Market Watch, November 2021 Copyright® 2021 Toronto Regional Real Estate Board
  • 14. TRREB Total 719 $594,235,456 $826,475 $800,000 714 329 110% 13 City of Toronto 265 $225,627,635 $851,425 $812,000 285 188 108% 16 Toronto West 85 $66,714,426 $784,876 $706,500 110 75 107% 18 Toronto W01 3 $1,876,000 $625,333 $689,000 3 1 101% 15 Toronto W02 6 $6,360,750 $1,060,125 $1,065,250 12 7 118% 5 Toronto W03 1 $760,000 $760,000 $760,000 5 4 96% 7 Toronto W04 11 $7,569,100 $688,100 $705,000 13 10 102% 23 Toronto W05 18 $11,492,900 $638,494 $649,500 25 22 105% 19 Toronto W06 10 $8,646,888 $864,689 $915,500 17 16 107% 10 Toronto W07 0 $0 $0 - 0 0 - - Toronto W08 21 $18,928,888 $901,376 $905,000 21 10 108% 22 Toronto W09 6 $5,449,000 $908,167 $915,000 5 1 110% 15 Toronto W10 9 $5,630,900 $625,656 $600,000 9 4 109% 18 Toronto Central 92 $90,288,638 $981,398 $888,750 104 84 106% 18 Toronto C01 20 $19,438,000 $971,900 $965,000 20 17 105% 15 Toronto C02 1 $1,365,000 $1,365,000 $1,365,000 3 10 99% 53 Toronto C03 3 $3,812,000 $1,270,667 $1,355,000 0 0 95% 52 Toronto C04 0 $0 $0 - 0 0 - - Toronto C06 1 $910,000 $910,000 $910,000 0 0 107% 31 Toronto C07 11 $9,913,000 $901,182 $855,000 7 6 106% 20 Toronto C08 5 $7,049,000 $1,409,800 $1,440,000 12 14 95% 29 Toronto C09 2 $3,454,900 $1,727,450 $1,727,450 1 2 115% 39 Toronto C10 2 $2,469,000 $1,234,500 $1,234,500 4 4 97% 40 Toronto C11 3 $2,203,000 $734,333 $815,000 1 2 102% 25 Toronto C12 4 $5,110,250 $1,277,563 $1,290,125 7 3 110% 8 Toronto C13 5 $4,414,000 $882,800 $861,000 5 1 114% 9 Toronto C14 13 $10,653,800 $819,523 $695,000 12 10 102% 14 Toronto C15 22 $19,496,688 $886,213 $822,500 32 15 113% 11 Toronto East 88 $68,624,571 $779,825 $800,000 71 29 111% 12 Toronto E01 3 $3,217,551 $1,072,517 $1,061,000 5 3 107% 7 Toronto E02 4 $4,437,500 $1,109,375 $1,023,750 4 2 100% 6 Toronto E03 1 $599,999 $599,999 $599,999 1 2 97% 97 Toronto E04 6 $5,154,800 $859,133 $843,000 5 1 114% 8 Toronto E05 27 $21,627,533 $801,020 $810,000 16 2 112% 9 Toronto E06 0 $0 $0 - 5 5 - - Toronto E07 8 $6,705,500 $838,188 $854,750 7 0 115% 14 Toronto E08 8 $5,304,000 $663,000 $647,500 6 4 109% 21 Toronto E09 12 $7,554,999 $629,583 $642,500 5 3 110% 14 Toronto E10 10 $7,697,300 $769,730 $768,000 13 4 119% 5 Toronto E11 9 $6,325,389 $702,821 $690,000 4 3 110% 9 Municipality Number of Sales Dollar Volume Average Price Median Price New Listings Active Listings Avg. SP/LP Avg. LDOM CONDO TOWNHOUSE, NOVEMBER 2021 Toronto Regional Real Estate Board SUMMARY OF EXISTING HOME TRANSACTIONS CITY OF TORONTO MUNICIPAL BREAKDOWN 1 1 2 4 5 1 1 3 14 Market Watch, November 2021 Copyright® 2021 Toronto Regional Real Estate Board
  • 15. TRREB Total 2,868 $2,050,917,972 $715,104 $636,250 3,245 2,689 102% 18 Halton Region 129 $88,815,102 $688,489 $645,000 140 90 102% 15 Burlington 44 $29,530,122 $671,139 $597,278 60 32 103% 14 Halton Hills 2 $1,268,000 $634,000 $634,000 6 4 106% 3 Milton 26 $17,229,900 $662,688 $650,450 20 9 103% 15 Oakville 57 $40,787,080 $715,563 $645,000 54 45 101% 17 Peel Region 365 $221,178,491 $605,968 $582,900 353 199 103% 15 Brampton 66 $36,302,500 $550,038 $535,000 51 22 103% 14 Caledon 1 $779,000 $779,000 $779,000 4 3 100% 4 Mississauga 298 $184,096,991 $617,775 $590,750 298 174 103% 15 City of Toronto 1,981 $1,477,728,423 $745,951 $648,000 2,356 2,136 102% 20 Toronto West 372 $234,612,596 $630,679 $598,444 425 375 102% 20 Toronto Central 1,333 $1,076,321,479 $807,443 $690,000 1,631 1,550 101% 20 Toronto East 276 $166,794,348 $604,327 $565,000 300 211 104% 16 York Region 320 $222,665,977 $695,831 $662,750 318 214 104% 16 Aurora 9 $6,631,988 $736,888 $738,000 11 5 103% 9 East Gwillimbury 1 $476,250 $476,250 $476,250 0 0 100% 34 Georgina 1 $386,000 $386,000 $386,000 3 10 102% 11 King 3 $1,838,000 $612,667 $620,000 2 0 101% 32 Markham 106 $77,197,086 $728,274 $685,500 93 50 105% 14 Newmarket 5 $2,861,000 $572,200 $605,000 4 1 103% 11 Richmond Hill 81 $53,727,364 $663,301 $642,500 72 35 104% 16 Vaughan 107 $74,517,789 $696,428 $670,000 126 110 102% 17 Whitchurch-Stouffville 7 $5,030,500 $718,643 $650,000 7 3 103% 20 Durham Region 65 $35,719,980 $549,538 $560,000 69 40 109% 17 Ajax 5 $3,084,900 $616,980 $560,000 8 4 106% 10 Brock 0 $0 $0 - 0 0 - - Clarington 15 $8,732,980 $582,199 $552,000 14 7 109% 16 Oshawa 19 $7,254,100 $381,795 $420,000 11 11 105% 30 Pickering 15 $9,603,000 $640,200 $620,000 23 15 108% 11 Scugog 1 $679,000 $679,000 $679,000 0 0 99% 34 Uxbridge 0 $0 $0 - 0 0 - - Whitby 10 $6,366,000 $636,600 $620,000 13 3 117% 8 Dufferin County 3 $1,449,000 $483,000 $395,000 1 0 100% 23 Orangeville 3 $1,449,000 $483,000 $395,000 1 0 100% 23 Simcoe County 5 $3,360,999 $672,200 $590,000 8 10 98% 35 Adjala-Tosorontio 0 $0 $0 - 0 0 - - Bradford West Gwillimbury 0 $0 $0 - 0 1 - - Essa 0 $0 $0 - 0 0 - - Innisfil 2 $1,808,999 $904,500 $904,500 6 7 98% 22 New Tecumseth 3 $1,552,000 $517,333 $537,000 2 2 99% 44 Municipality Number of Sales Dollar Volume Average Price Median Price New Listings Active Listings Avg. SP/LP Avg. LDOM CONDO APT, NOVEMBER 2021 Toronto Regional Real Estate Board SUMMARY OF EXISTING HOME TRANSACTIONS ALL TRREB AREAS 1 1 2 4 5 1 1 3 15 Market Watch, November 2021 Copyright® 2021 Toronto Regional Real Estate Board
  • 16. TRREB Total 2,868 $2,050,917,972 $715,104 $636,250 3,245 2,689 102% 18 City of Toronto 1,981 $1,477,728,423 $745,951 $648,000 2,356 2,136 102% 20 Toronto West 372 $234,612,596 $630,679 $598,444 425 375 102% 20 Toronto W01 25 $16,625,900 $665,036 $645,000 25 20 103% 14 Toronto W02 20 $15,181,789 $759,089 $660,000 29 14 106% 14 Toronto W03 5 $3,232,000 $646,400 $737,000 9 9 105% 14 Toronto W04 39 $21,164,700 $542,685 $540,000 51 44 102% 21 Toronto W05 29 $12,997,921 $448,204 $444,000 42 46 101% 30 Toronto W06 90 $67,348,152 $748,313 $703,000 105 125 101% 20 Toronto W07 6 $4,815,000 $802,500 $724,500 8 6 104% 11 Toronto W08 101 $63,737,648 $631,066 $610,000 94 57 103% 18 Toronto W09 16 $7,498,286 $468,643 $435,393 22 27 98% 22 Toronto W10 41 $22,011,200 $536,859 $539,800 40 27 101% 25 Toronto Central 1,333 $1,076,321,479 $807,443 $690,000 1,631 1,550 101% 20 Toronto C01 463 $392,140,490 $846,956 $728,000 657 595 102% 19 Toronto C02 62 $77,075,850 $1,243,159 $877,500 93 127 98% 24 Toronto C03 28 $28,190,188 $1,006,792 $730,000 25 26 99% 25 Toronto C04 29 $24,476,927 $844,032 $720,800 28 27 102% 25 Toronto C06 23 $13,763,400 $598,409 $576,000 21 18 100% 18 Toronto C07 64 $45,658,687 $713,417 $649,000 61 58 102% 24 Toronto C08 270 $212,867,823 $788,399 $699,500 333 321 101% 22 Toronto C09 16 $25,637,990 $1,602,374 $802,500 26 34 97% 20 Toronto C10 75 $55,615,422 $741,539 $720,000 70 68 101% 17 Toronto C11 25 $14,337,010 $573,480 $550,000 32 28 102% 20 Toronto C12 3 $5,300,000 $1,766,667 $1,950,000 10 16 91% 27 Toronto C13 39 $24,847,755 $637,122 $608,000 50 42 101% 28 Toronto C14 116 $79,103,555 $681,927 $660,000 104 63 103% 16 Toronto C15 120 $77,306,382 $644,220 $611,250 121 127 104% 19 Toronto East 276 $166,794,348 $604,327 $565,000 300 211 104% 16 Toronto E01 22 $19,012,299 $864,195 $761,500 26 10 107% 14 Toronto E02 20 $15,945,800 $797,290 $724,500 25 17 101% 13 Toronto E03 17 $9,818,151 $577,538 $475,000 22 34 100% 19 Toronto E04 32 $17,201,570 $537,549 $549,000 28 16 105% 17 Toronto E05 34 $19,096,566 $561,664 $579,995 36 32 104% 19 Toronto E06 8 $5,770,999 $721,375 $700,500 9 20 101% 20 Toronto E07 48 $26,606,787 $554,308 $549,500 42 15 106% 14 Toronto E08 24 $13,923,900 $580,163 $529,950 24 15 105% 14 Toronto E09 55 $31,034,976 $564,272 $550,000 42 17 103% 18 Toronto E10 5 $2,830,400 $566,080 $565,000 21 17 103% 8 Toronto E11 11 $5,552,900 $504,809 $520,000 25 18 101% 17 Municipality Number of Sales Dollar Volume Average Price Median Price New Listings Active Listings Avg. SP/LP Avg. LDOM CONDO APT, NOVEMBER 2021 Toronto Regional Real Estate Board SUMMARY OF EXISTING HOME TRANSACTIONS CITY OF TORONTO MUNICIPAL BREAKDOWN 1 1 2 4 5 1 1 3 16 Market Watch, November 2021 Copyright® 2021 Toronto Regional Real Estate Board
  • 17. TRREB Total 62 $69,148,937 $1,115,305 $1,100,000 70 12 119% 6 Halton Region 5 $6,286,439 $1,257,288 $1,366,000 5 1 122% 5 Burlington 3 $3,355,999 $1,118,666 $999,999 2 0 127% 3 Halton Hills 0 $0 $0 - 0 0 - - Milton 0 $0 $0 - 0 0 - - Oakville 2 $2,930,440 $1,465,220 $1,465,220 3 1 117% 7 Peel Region 7 $7,200,100 $1,028,586 $999,900 9 3 112% 4 Brampton 5 $5,310,100 $1,062,020 $1,115,100 8 3 115% 3 Caledon 1 $950,000 $950,000 $950,000 1 0 107% 1 Mississauga 1 $940,000 $940,000 $940,000 0 0 104% 12 City of Toronto 5 $5,173,000 $1,034,600 $1,025,000 7 1 115% 8 Toronto West 2 $1,875,000 $937,500 $937,500 2 0 121% 9 Toronto Central 0 $0 $0 - 0 0 - - Toronto East 3 $3,298,000 $1,099,333 $1,100,000 5 1 112% 7 York Region 23 $30,999,888 $1,347,821 $1,386,000 27 5 121% 7 Aurora 0 $0 $0 - 0 0 - - East Gwillimbury 0 $0 $0 - 0 0 - - Georgina 1 $1,190,000 $1,190,000 $1,190,000 1 0 119% 12 King 0 $0 $0 - 0 0 - - Markham 17 $23,356,888 $1,373,935 $1,386,000 20 3 123% 6 Newmarket 0 $0 $0 - 0 0 - - Richmond Hill 3 $4,100,000 $1,366,667 $1,412,000 3 1 114% 7 Vaughan 2 $2,353,000 $1,176,500 $1,176,500 3 1 112% 9 Whitchurch-Stouffville 0 $0 $0 - 0 0 - - Durham Region 18 $16,234,510 $901,917 $857,500 16 2 120% 6 Ajax 3 $2,816,110 $938,703 $986,000 2 0 115% 7 Brock 0 $0 $0 - 0 0 - - Clarington 5 $4,044,000 $808,800 $840,000 6 1 125% 8 Oshawa 4 $3,125,000 $781,250 $775,000 4 0 112% 5 Pickering 0 $0 $0 - 0 0 - - Scugog 0 $0 $0 - 0 0 - - Uxbridge 0 $0 $0 - 1 1 - - Whitby 6 $6,249,400 $1,041,567 $1,085,500 3 0 125% 6 Dufferin County 0 $0 $0 - 0 0 - - Orangeville 0 $0 $0 - 0 0 - - Simcoe County 4 $3,255,000 $813,750 $833,500 6 0 109% 3 Adjala-Tosorontio 0 $0 $0 - 0 0 - - Bradford West Gwillimbury 1 $890,000 $890,000 $890,000 1 0 115% 3 Essa 2 $1,588,000 $794,000 $794,000 2 0 106% 4 Innisfil 0 $0 $0 - 0 0 - - New Tecumseth 1 $777,000 $777,000 $777,000 3 0 111% 1 Municipality Number of Sales Dollar Volume Average Price Median Price New Listings Active Listings Avg. SP/LP Avg. LDOM LINK, NOVEMBER 2021 Toronto Regional Real Estate Board SUMMARY OF EXISTING HOME TRANSACTIONS ALL TRREB AREAS 1 1 2 4 5 1 1 3 17 Market Watch, November 2021 Copyright® 2021 Toronto Regional Real Estate Board
  • 18. TRREB Total 62 $69,148,937 $1,115,305 $1,100,000 70 12 119% 6 City of Toronto 5 $5,173,000 $1,034,600 $1,025,000 7 1 115% 8 Toronto West 2 $1,875,000 $937,500 $937,500 2 0 121% 9 Toronto W01 0 $0 $0 - 0 0 - - Toronto W02 0 $0 $0 - 0 0 - - Toronto W03 0 $0 $0 - 0 0 - - Toronto W04 0 $0 $0 - 0 0 - - Toronto W05 0 $0 $0 - 0 0 - - Toronto W06 0 $0 $0 - 0 0 - - Toronto W07 0 $0 $0 - 0 0 - - Toronto W08 0 $0 $0 - 0 0 - - Toronto W09 0 $0 $0 - 0 0 - - Toronto W10 2 $1,875,000 $937,500 $937,500 2 0 121% 9 Toronto Central 0 $0 $0 - 0 0 - - Toronto C01 0 $0 $0 - 0 0 - - Toronto C02 0 $0 $0 - 0 0 - - Toronto C03 0 $0 $0 - 0 0 - - Toronto C04 0 $0 $0 - 0 0 - - Toronto C06 0 $0 $0 - 0 0 - - Toronto C07 0 $0 $0 - 0 0 - - Toronto C08 0 $0 $0 - 0 0 - - Toronto C09 0 $0 $0 - 0 0 - - Toronto C10 0 $0 $0 - 0 0 - - Toronto C11 0 $0 $0 - 0 0 - - Toronto C12 0 $0 $0 - 0 0 - - Toronto C13 0 $0 $0 - 0 0 - - Toronto C14 0 $0 $0 - 0 0 - - Toronto C15 0 $0 $0 - 0 0 - - Toronto East 3 $3,298,000 $1,099,333 $1,100,000 5 1 112% 7 Toronto E01 0 $0 $0 - 0 0 - - Toronto E02 0 $0 $0 - 0 0 - - Toronto E03 0 $0 $0 - 0 0 - - Toronto E04 0 $0 $0 - 0 0 - - Toronto E05 0 $0 $0 - 0 0 - - Toronto E06 0 $0 $0 - 0 0 - - Toronto E07 3 $3,298,000 $1,099,333 $1,100,000 4 1 112% 7 Toronto E08 0 $0 $0 - 1 0 - - Toronto E09 0 $0 $0 - 0 0 - - Toronto E10 0 $0 $0 - 0 0 - - Toronto E11 0 $0 $0 - 0 0 - - Municipality Number of Sales Dollar Volume Average Price Median Price New Listings Active Listings Avg. SP/LP Avg. LDOM LINK, NOVEMBER 2021 Toronto Regional Real Estate Board SUMMARY OF EXISTING HOME TRANSACTIONS CITY OF TORONTO MUNICIPAL BREAKDOWN 1 1 2 4 5 1 1 3 18 Market Watch, November 2021 Copyright® 2021 Toronto Regional Real Estate Board
  • 19. TRREB Total 11 $7,516,318 $683,302 $499,900 15 19 98% 28 Halton Region 1 $425,000 $425,000 $425,000 0 0 92% 27 Burlington 1 $425,000 $425,000 $425,000 0 0 92% 27 Halton Hills 0 $0 $0 - 0 0 - - Milton 0 $0 $0 - 0 0 - - Oakville 0 $0 $0 - 0 0 - - Peel Region 0 $0 $0 - 1 2 - - Brampton 0 $0 $0 - 0 0 - - Caledon 0 $0 $0 - 0 0 - - Mississauga 0 $0 $0 - 1 2 - - City of Toronto 10 $7,091,318 $709,132 $524,450 14 17 98% 28 Toronto West 4 $1,844,300 $461,075 $485,650 6 9 100% 30 Toronto Central 5 $4,797,018 $959,404 $1,135,000 8 8 98% 22 Toronto East 1 $450,000 $450,000 $450,000 0 0 92% 50 York Region 0 $0 $0 - 0 0 - - Aurora 0 $0 $0 - 0 0 - - East Gwillimbury 0 $0 $0 - 0 0 - - Georgina 0 $0 $0 - 0 0 - - King 0 $0 $0 - 0 0 - - Markham 0 $0 $0 - 0 0 - - Newmarket 0 $0 $0 - 0 0 - - Richmond Hill 0 $0 $0 - 0 0 - - Vaughan 0 $0 $0 - 0 0 - - Whitchurch-Stouffville 0 $0 $0 - 0 0 - - Durham Region 0 $0 $0 - 0 0 - - Ajax 0 $0 $0 - 0 0 - - Brock 0 $0 $0 - 0 0 - - Clarington 0 $0 $0 - 0 0 - - Oshawa 0 $0 $0 - 0 0 - - Pickering 0 $0 $0 - 0 0 - - Scugog 0 $0 $0 - 0 0 - - Uxbridge 0 $0 $0 - 0 0 - - Whitby 0 $0 $0 - 0 0 - - Dufferin County 0 $0 $0 - 0 0 - - Orangeville 0 $0 $0 - 0 0 - - Simcoe County 0 $0 $0 - 0 0 - - Adjala-Tosorontio 0 $0 $0 - 0 0 - - Bradford West Gwillimbury 0 $0 $0 - 0 0 - - Essa 0 $0 $0 - 0 0 - - Innisfil 0 $0 $0 - 0 0 - - New Tecumseth 0 $0 $0 - 0 0 - - Municipality Number of Sales Dollar Volume Average Price Median Price New Listings Active Listings Avg. SP/LP Avg. LDOM CO-OP APT, NOVEMBER 2021 Toronto Regional Real Estate Board SUMMARY OF EXISTING HOME TRANSACTIONS ALL TRREB AREAS 1 1 2 4 5 1 1 3 19 Market Watch, November 2021 Copyright® 2021 Toronto Regional Real Estate Board
  • 20. TRREB Total 11 $7,516,318 $683,302 $499,900 15 19 98% 28 City of Toronto 10 $7,091,318 $709,132 $524,450 14 17 98% 28 Toronto West 4 $1,844,300 $461,075 $485,650 6 9 100% 30 Toronto W01 0 $0 $0 - 0 0 - - Toronto W02 0 $0 $0 - 0 0 - - Toronto W03 0 $0 $0 - 0 0 - - Toronto W04 0 $0 $0 - 0 0 - - Toronto W05 0 $0 $0 - 0 0 - - Toronto W06 2 $823,900 $411,950 $411,950 4 5 99% 32 Toronto W07 1 $549,000 $549,000 $549,000 0 0 100% 52 Toronto W08 1 $471,400 $471,400 $471,400 1 3 101% 3 Toronto W09 0 $0 $0 - 1 1 - - Toronto W10 0 $0 $0 - 0 0 - - Toronto Central 5 $4,797,018 $959,404 $1,135,000 8 8 98% 22 Toronto C01 0 $0 $0 - 0 0 - - Toronto C02 0 $0 $0 - 1 1 - - Toronto C03 0 $0 $0 - 0 0 - - Toronto C04 1 $347,018 $347,018 $347,018 0 0 97% 10 Toronto C06 0 $0 $0 - 0 0 - - Toronto C07 0 $0 $0 - 0 0 - - Toronto C08 0 $0 $0 - 0 0 - - Toronto C09 4 $4,450,000 $1,112,500 $1,157,500 7 7 98% 25 Toronto C10 0 $0 $0 - 0 0 - - Toronto C11 0 $0 $0 - 0 0 - - Toronto C12 0 $0 $0 - 0 0 - - Toronto C13 0 $0 $0 - 0 0 - - Toronto C14 0 $0 $0 - 0 0 - - Toronto C15 0 $0 $0 - 0 0 - - Toronto East 1 $450,000 $450,000 $450,000 0 0 92% 50 Toronto E01 0 $0 $0 - 0 0 - - Toronto E02 0 $0 $0 - 0 0 - - Toronto E03 0 $0 $0 - 0 0 - - Toronto E04 1 $450,000 $450,000 $450,000 0 0 92% 50 Toronto E05 0 $0 $0 - 0 0 - - Toronto E06 0 $0 $0 - 0 0 - - Toronto E07 0 $0 $0 - 0 0 - - Toronto E08 0 $0 $0 - 0 0 - - Toronto E09 0 $0 $0 - 0 0 - - Toronto E10 0 $0 $0 - 0 0 - - Toronto E11 0 $0 $0 - 0 0 - - Municipality Number of Sales Dollar Volume Average Price Median Price New Listings Active Listings Avg. SP/LP Avg. LDOM CO-OP APT, NOVEMBER 2021 Toronto Regional Real Estate Board SUMMARY OF EXISTING HOME TRANSACTIONS CITY OF TORONTO MUNICIPAL BREAKDOWN 1 1 2 4 5 1 1 3 20 Market Watch, November 2021 Copyright® 2021 Toronto Regional Real Estate Board
  • 21. TRREB Total 7 $6,358,000 $908,286 $899,000 8 5 102% 9 Halton Region 1 $858,000 $858,000 $858,000 1 0 114% 8 Burlington 1 $858,000 $858,000 $858,000 1 0 114% 8 Halton Hills 0 $0 $0 - 0 0 - - Milton 0 $0 $0 - 0 0 - - Oakville 0 $0 $0 - 0 0 - - Peel Region 0 $0 $0 - 1 2 - - Brampton 0 $0 $0 - 1 1 - - Caledon 0 $0 $0 - 0 0 - - Mississauga 0 $0 $0 - 0 1 - - City of Toronto 1 $899,000 $899,000 $899,000 1 0 112% 10 Toronto West 0 $0 $0 - 0 0 - - Toronto Central 0 $0 $0 - 0 0 - - Toronto East 1 $899,000 $899,000 $899,000 1 0 112% 10 York Region 2 $2,155,000 $1,077,500 $1,077,500 2 2 94% 12 Aurora 0 $0 $0 - 0 0 - - East Gwillimbury 0 $0 $0 - 0 0 - - Georgina 0 $0 $0 - 0 0 - - King 0 $0 $0 - 0 0 - - Markham 2 $2,155,000 $1,077,500 $1,077,500 2 2 94% 12 Newmarket 0 $0 $0 - 0 0 - - Richmond Hill 0 $0 $0 - 0 0 - - Vaughan 0 $0 $0 - 0 0 - - Whitchurch-Stouffville 0 $0 $0 - 0 0 - - Durham Region 0 $0 $0 - 1 0 - - Ajax 0 $0 $0 - 0 0 - - Brock 0 $0 $0 - 0 0 - - Clarington 0 $0 $0 - 0 0 - - Oshawa 0 $0 $0 - 0 0 - - Pickering 0 $0 $0 - 1 0 - - Scugog 0 $0 $0 - 0 0 - - Uxbridge 0 $0 $0 - 0 0 - - Whitby 0 $0 $0 - 0 0 - - Dufferin County 0 $0 $0 - 0 0 - - Orangeville 0 $0 $0 - 0 0 - - Simcoe County 3 $2,446,000 $815,333 $757,000 2 1 102% 7 Adjala-Tosorontio 0 $0 $0 - 0 0 - - Bradford West Gwillimbury 0 $0 $0 - 0 0 - - Essa 0 $0 $0 - 0 0 - - Innisfil 0 $0 $0 - 0 0 - - New Tecumseth 3 $2,446,000 $815,333 $757,000 2 1 102% 7 Municipality Number of Sales Dollar Volume Average Price Median Price New Listings Active Listings Avg. SP/LP Avg. LDOM DET CONDO, NOVEMBER 2021 Toronto Regional Real Estate Board SUMMARY OF EXISTING HOME TRANSACTIONS ALL TRREB AREAS 1 1 2 4 5 1 1 3 21 Market Watch, November 2021 Copyright® 2021 Toronto Regional Real Estate Board
  • 22. TRREB Total 7 $6,358,000 $908,286 $899,000 8 5 102% 9 City of Toronto 1 $899,000 $899,000 $899,000 1 0 112% 10 Toronto West 0 $0 $0 - 0 0 - - Toronto W01 0 $0 $0 - 0 0 - - Toronto W02 0 $0 $0 - 0 0 - - Toronto W03 0 $0 $0 - 0 0 - - Toronto W04 0 $0 $0 - 0 0 - - Toronto W05 0 $0 $0 - 0 0 - - Toronto W06 0 $0 $0 - 0 0 - - Toronto W07 0 $0 $0 - 0 0 - - Toronto W08 0 $0 $0 - 0 0 - - Toronto W09 0 $0 $0 - 0 0 - - Toronto W10 0 $0 $0 - 0 0 - - Toronto Central 0 $0 $0 - 0 0 - - Toronto C01 0 $0 $0 - 0 0 - - Toronto C02 0 $0 $0 - 0 0 - - Toronto C03 0 $0 $0 - 0 0 - - Toronto C04 0 $0 $0 - 0 0 - - Toronto C06 0 $0 $0 - 0 0 - - Toronto C07 0 $0 $0 - 0 0 - - Toronto C08 0 $0 $0 - 0 0 - - Toronto C09 0 $0 $0 - 0 0 - - Toronto C10 0 $0 $0 - 0 0 - - Toronto C11 0 $0 $0 - 0 0 - - Toronto C12 0 $0 $0 - 0 0 - - Toronto C13 0 $0 $0 - 0 0 - - Toronto C14 0 $0 $0 - 0 0 - - Toronto C15 0 $0 $0 - 0 0 - - Toronto East 1 $899,000 $899,000 $899,000 1 0 112% 10 Toronto E01 0 $0 $0 - 0 0 - - Toronto E02 0 $0 $0 - 0 0 - - Toronto E03 0 $0 $0 - 0 0 - - Toronto E04 0 $0 $0 - 0 0 - - Toronto E05 0 $0 $0 - 0 0 - - Toronto E06 0 $0 $0 - 0 0 - - Toronto E07 0 $0 $0 - 0 0 - - Toronto E08 0 $0 $0 - 0 0 - - Toronto E09 0 $0 $0 - 0 0 - - Toronto E10 0 $0 $0 - 0 0 - - Toronto E11 1 $899,000 $899,000 $899,000 1 0 112% 10 Municipality Number of Sales Dollar Volume Average Price Median Price New Listings Active Listings Avg. SP/LP Avg. LDOM DET CONDO, NOVEMBER 2021 Toronto Regional Real Estate Board SUMMARY OF EXISTING HOME TRANSACTIONS CITY OF TORONTO MUNICIPAL BREAKDOWN 1 1 2 4 5 1 1 3 22 Market Watch, November 2021 Copyright® 2021 Toronto Regional Real Estate Board
  • 23. TRREB Total 8 $4,070,500 $508,813 $477,250 12 17 98% 35 Halton Region 0 $0 $0 - 0 0 - - Burlington 0 $0 $0 - 0 0 - - Halton Hills 0 $0 $0 - 0 0 - - Milton 0 $0 $0 - 0 0 - - Oakville 0 $0 $0 - 0 0 - - Peel Region 0 $0 $0 - 0 0 - - Brampton 0 $0 $0 - 0 0 - - Caledon 0 $0 $0 - 0 0 - - Mississauga 0 $0 $0 - 0 0 - - City of Toronto 8 $4,070,500 $508,813 $477,250 12 17 98% 35 Toronto West 3 $1,511,000 $503,667 $415,000 1 1 95% 50 Toronto Central 5 $2,559,500 $511,900 $524,500 9 14 100% 27 Toronto East 0 $0 $0 - 2 2 - - York Region 0 $0 $0 - 0 0 - - Aurora 0 $0 $0 - 0 0 - - East Gwillimbury 0 $0 $0 - 0 0 - - Georgina 0 $0 $0 - 0 0 - - King 0 $0 $0 - 0 0 - - Markham 0 $0 $0 - 0 0 - - Newmarket 0 $0 $0 - 0 0 - - Richmond Hill 0 $0 $0 - 0 0 - - Vaughan 0 $0 $0 - 0 0 - - Whitchurch-Stouffville 0 $0 $0 - 0 0 - - Durham Region 0 $0 $0 - 0 0 - - Ajax 0 $0 $0 - 0 0 - - Brock 0 $0 $0 - 0 0 - - Clarington 0 $0 $0 - 0 0 - - Oshawa 0 $0 $0 - 0 0 - - Pickering 0 $0 $0 - 0 0 - - Scugog 0 $0 $0 - 0 0 - - Uxbridge 0 $0 $0 - 0 0 - - Whitby 0 $0 $0 - 0 0 - - Dufferin County 0 $0 $0 - 0 0 - - Orangeville 0 $0 $0 - 0 0 - - Simcoe County 0 $0 $0 - 0 0 - - Adjala-Tosorontio 0 $0 $0 - 0 0 - - Bradford West Gwillimbury 0 $0 $0 - 0 0 - - Essa 0 $0 $0 - 0 0 - - Innisfil 0 $0 $0 - 0 0 - - New Tecumseth 0 $0 $0 - 0 0 - - Municipality Number of Sales Dollar Volume Average Price Median Price New Listings Active Listings Avg. SP/LP Avg. LDOM CO-OWNERSHIP APT, NOVEMBER 2021 Toronto Regional Real Estate Board SUMMARY OF EXISTING HOME TRANSACTIONS ALL TRREB AREAS 1 1 2 4 5 1 1 3 23 Market Watch, November 2021 Copyright® 2021 Toronto Regional Real Estate Board
  • 24. TRREB Total 8 $4,070,500 $508,813 $477,250 12 17 98% 35 City of Toronto 8 $4,070,500 $508,813 $477,250 12 17 98% 35 Toronto West 3 $1,511,000 $503,667 $415,000 1 1 95% 50 Toronto W01 1 $730,000 $730,000 $730,000 0 0 97% 11 Toronto W02 0 $0 $0 - 1 1 - - Toronto W03 0 $0 $0 - 0 0 - - Toronto W04 0 $0 $0 - 0 0 - - Toronto W05 1 $366,000 $366,000 $366,000 0 0 92% 43 Toronto W06 0 $0 $0 - 0 0 - - Toronto W07 0 $0 $0 - 0 0 - - Toronto W08 0 $0 $0 - 0 0 - - Toronto W09 1 $415,000 $415,000 $415,000 0 0 97% 96 Toronto W10 0 $0 $0 - 0 0 - - Toronto Central 5 $2,559,500 $511,900 $524,500 9 14 100% 27 Toronto C01 0 $0 $0 - 1 2 - - Toronto C02 1 $430,000 $430,000 $430,000 0 1 99% 34 Toronto C03 0 $0 $0 - 3 4 - - Toronto C04 2 $1,275,000 $637,500 $637,500 4 3 102% 10 Toronto C06 0 $0 $0 - 0 0 - - Toronto C07 0 $0 $0 - 0 0 - - Toronto C08 1 $524,500 $524,500 $524,500 1 3 96% 72 Toronto C09 0 $0 $0 - 0 0 - - Toronto C10 0 $0 $0 - 0 0 - - Toronto C11 0 $0 $0 - 0 0 - - Toronto C12 0 $0 $0 - 0 0 - - Toronto C13 0 $0 $0 - 0 1 - - Toronto C14 1 $330,000 $330,000 $330,000 0 0 99% 8 Toronto C15 0 $0 $0 - 0 0 - - Toronto East 0 $0 $0 - 2 2 - - Toronto E01 0 $0 $0 - 0 0 - - Toronto E02 0 $0 $0 - 2 2 - - Toronto E03 0 $0 $0 - 0 0 - - Toronto E04 0 $0 $0 - 0 0 - - Toronto E05 0 $0 $0 - 0 0 - - Toronto E06 0 $0 $0 - 0 0 - - Toronto E07 0 $0 $0 - 0 0 - - Toronto E08 0 $0 $0 - 0 0 - - Toronto E09 0 $0 $0 - 0 0 - - Toronto E10 0 $0 $0 - 0 0 - - Toronto E11 0 $0 $0 - 0 0 - - Municipality Number of Sales Dollar Volume Average Price Median Price New Listings Active Listings Avg. SP/LP Avg. LDOM CO-OWNERSHIP APT, NOVEMBER 2021 Toronto Regional Real Estate Board SUMMARY OF EXISTING HOME TRANSACTIONS CITY OF TORONTO MUNICIPAL BREAKDOWN 1 1 2 4 5 1 1 3 24 Market Watch, November 2021 Copyright® 2021 Toronto Regional Real Estate Board
  • 25. 383.9 $1,172,900 28.31% 391.6 $1,465,000 32.12% 406.1 $1,143,900 31.85% 375.9 $809,200 24.26% 351.1 $695,300 20.08% 424.2 $1,306,600 33.73% 427.7 $1,560,800 35.18% 457.2 $1,157,200 39.26% 416.6 $802,700 27.91% 367.2 $694,900 21.23% 424.5 $1,224,800 30.90% 438.3 $1,508,500 34.04% 479.6 $1,169,300 37.22% 423.6 $791,600 28.68% 375.3 $619,600 21.50% 421.0 $1,241,800 36.25% 412.1 $1,344,100 36.77% 448.5 $999,400 39.94% 445.5 $709,300 31.80% 372.1 $568,200 22.81% 432.6 $1,316,700 42.07% 431.4 $1,589,000 41.67% 453.4 $1,093,000 42.89% 400.3 $686,600 27.28% 348.6 $717,200 21.80% 419.9 $1,418,000 31.51% 423.1 $1,715,600 32.88% 452.0 $1,260,000 36.56% 405.9 $921,800 26.88% 362.5 $724,100 20.59% 382.5 $1,084,000 29.31% 382.9 $1,356,000 33.14% 399.5 $1,020,900 33.52% 372.4 $787,400 24.34% 358.8 $613,500 17.37% 398.8 $1,015,800 33.56% 392.6 $1,156,700 35.38% 411.3 $960,600 35.61% 382.4 $691,400 25.62% 357.7 $527,600 20.28% 357.2 $1,305,400 35.00% 362.7 $1,378,700 35.89% 387.9 $958,300 31.27% 337.6 $730,800 31.36% - - - 369.5 $1,090,900 24.70% 373.4 $1,491,400 29.29% 378.9 $1,044,900 29.58% 368.2 $813,800 23.60% 359.0 $630,300 16.82% 361.0 $1,190,300 19.97% 366.9 $1,657,800 22.30% 382.6 $1,292,600 19.60% 352.6 $836,400 15.68% 351.8 $717,800 19.34% 383.1 $1,305,300 32.19% 394.0 $1,523,200 32.79% 395.2 $1,142,200 35.11% 339.9 $879,600 28.90% 323.2 $701,700 25.81% 370.9 $1,226,700 29.10% 375.0 $1,408,900 29.40% 394.7 $1,017,800 32.67% 330.7 $895,900 32.92% 322.6 $692,200 23.37% 378.7 $1,295,800 41.41% 380.3 $1,356,900 40.02% 407.2 $851,800 45.01% - - - - - - 413.7 $802,800 41.29% 423.3 $816,600 41.48% 401.1 $790,600 36.99% - - - - - - 381.3 $1,774,700 29.43% 386.4 $1,811,000 29.32% 382.4 $1,172,800 37.95% - - - 301.2 $744,600 23.85% 390.7 $1,373,300 33.21% 410.9 $1,720,300 31.83% 412.3 $1,227,400 37.85% 333.8 $900,900 32.15% 331.8 $764,200 28.06% 361.9 $1,065,700 34.94% 364.9 $1,229,900 35.15% 369.7 $870,700 37.84% 364.4 $754,100 30.38% 323.5 $553,600 24.61% 391.3 $1,405,900 29.61% 419.0 $1,789,700 30.98% 391.9 $1,191,500 32.98% 309.2 $783,900 18.65% 326.7 $661,000 24.22% 368.1 $1,343,500 29.07% 365.7 $1,553,800 29.04% 384.4 $1,167,000 31.96% 355.4 $982,800 26.16% 312.4 $721,500 25.61% 412.3 $1,436,300 36.52% 410.3 $1,513,400 36.77% 423.0 $1,055,400 40.02% 412.4 $732,000 31.30% 321.7 $643,700 21.40% 414.8 $968,500 40.14% 404.7 $1,056,100 40.42% 436.3 $870,200 41.70% 423.7 $666,600 38.51% 381.6 $633,200 29.40% 405.5 $1,000,100 39.20% 403.9 $1,083,500 39.56% 424.6 $916,200 41.20% 376.4 $707,300 30.20% 343.6 $551,800 28.45% 384.2 $648,000 38.35% 384.0 $654,100 38.33% 399.7 $806,200 50.66% - - - - - - 429.4 $906,900 44.38% 417.4 $1,005,300 44.63% 443.6 $847,400 46.69% 419.4 $677,400 41.93% 328.9 $484,700 28.98% 430.4 $818,500 40.24% 413.3 $882,000 40.05% 468.9 $784,800 41.15% 465.1 $589,500 43.82% 382.9 $433,200 26.54% 404.4 $1,078,600 35.52% 385.7 $1,201,600 37.26% 410.6 $958,100 35.92% 402.3 $686,400 31.17% 486.7 $916,800 32.26% 376.9 $967,700 34.18% 372.5 $987,400 35.31% 373.8 $694,900 29.84% - - - - - - 365.3 $1,217,200 35.75% 367.7 $1,270,000 35.58% 357.1 $828,100 33.25% 351.2 $639,500 37.89% 297.0 $709,200 27.63% 407.8 $1,059,500 41.06% 406.1 $1,168,000 40.91% 426.4 $939,300 41.71% 403.1 $677,300 38.71% 305.7 $567,600 28.18% 409.4 $903,500 31.39% 428.7 $977,000 31.46% 409.4 $767,200 31.30% 394.5 $521,500 39.70% 360.0 $528,100 12.08% 409.4 $903,500 31.39% 428.7 $977,000 31.46% 409.4 $767,200 31.30% 394.5 $521,500 39.70% 360.0 $528,100 12.08% 384.2 $839,300 34.81% 375.9 $862,400 38.25% 423.3 $790,600 35.07% 347.4 $548,500 34.08% 350.1 $553,700 27.73% 371.7 $993,800 38.28% 372.1 $996,300 38.17% - - - - - - - - - 398.2 $996,800 33.89% 373.8 $1,066,500 30.20% 435.4 $917,400 35.22% 394.6 $640,800 35.00% 322.2 $543,600 24.31% 408.8 $818,400 34.83% 397.5 $841,100 42.42% 434.0 $684,900 41.28% 359.5 $573,400 21.53% - - - 382.0 $753,400 34.79% 379.9 $772,400 38.50% 439.5 $672,000 34.82% 339.8 $285,800 48.58% 329.4 $647,300 23.79% - - - - - - - - - - - - - - - 361.3 $848,700 34.86% 354.2 $922,200 34.93% 395.0 $719,200 32.33% 341.3 $689,800 32.54% 375.9 $586,300 32.87% Composite Single Family Detached Single Family Attached Townhouse Apartment Index Benchmark Yr./Yr. % Chg. Index Benchmark Yr./Yr. % Chg. Index Benchmark Yr./Yr. % Chg. Index Benchmark Yr./Yr. % Chg. Index Benchmark Yr./Yr. % Chg. Toronto Regional Real Estate Board FOCUS ON THE MLS HOME PRICE INDEX ALL TRREB AREAS INDEX AND BENCHMARK PRICE, NOVEMBER 2021 TRREB Total Halton Region Burlington Halton Hills Milton Oakville Peel Region Brampton Caledon Mississauga City of Toronto York Region Aurora East Gwillimbury Georgina King Markham Newmarket Richmond Hill Vaughan Whitchurch-Stouffville Durham Region Ajax Brock Clarington Oshawa Pickering Scugog Uxbridge Whitby Dufferin County Orangeville Simcoe County Adjala-Tosorontio Bradford West Gwillimbury Essa Innisfil Barrie New Tecumseth 25 Market Watch, November 2021 Copyright® 2021 Toronto Regional Real Estate Board
  • 26. 383.9 $1,172,900 28.31% 391.6 $1,465,000 32.12% 406.1 $1,143,900 31.85% 375.9 $809,200 24.26% 351.1 $695,300 20.08% 361.0 $1,190,300 19.97% 366.9 $1,657,800 22.30% 382.6 $1,292,600 19.60% 352.6 $836,400 15.68% 351.8 $717,800 19.34% 337.5 $1,440,700 16.98% 363.1 $2,022,500 20.63% 379.5 $1,508,400 19.98% 289.4 $870,700 8.84% 322.3 $728,700 15.44% 399.5 $1,423,400 16.71% 376.5 $1,645,700 16.38% 424.3 $1,261,700 16.47% 422.6 $822,900 14.43% 385.5 $827,500 17.57% 392.5 $1,012,100 18.12% 399.4 $1,081,000 18.41% 401.5 $1,028,500 17.98% 302.8 $742,500 12.11% 381.4 $651,700 19.82% 365.6 $938,400 14.61% 348.2 $1,101,900 18.19% 338.9 $963,200 15.59% 310.8 $715,400 11.88% 399.1 $588,800 11.98% 341.2 $810,500 19.22% 348.2 $1,167,700 21.58% 335.9 $975,700 23.22% 325.5 $591,100 14.57% 355.0 $469,000 16.39% 315.5 $924,100 21.58% 402.7 $1,272,500 21.04% 365.0 $1,229,100 22.03% 372.7 $1,105,100 14.75% 264.8 $664,200 24.32% 325.6 $1,439,800 17.93% 351.3 $1,611,100 20.27% 343.6 $1,428,300 22.45% 255.7 $940,000 13.59% 186.2 $755,000 6.22% 312.6 $1,325,000 18.90% 326.7 $1,831,700 22.18% 356.1 $1,339,100 22.79% 359.5 $864,600 14.53% 293.8 $611,800 16.73% 335.1 $874,300 18.79% 351.6 $1,363,500 24.15% 386.6 $1,066,400 29.43% 266.4 $739,900 9.49% 327.0 $430,800 12.95% 387.9 $886,100 20.77% 361.7 $1,085,100 21.83% 356.5 $912,300 17.77% 425.3 $765,600 17.10% 408.8 $582,400 20.88% 379.3 $951,600 18.94% 448.7 $1,757,900 16.24% 444.7 $1,625,000 16.81% 349.8 $997,100 13.76% 374.0 $778,600 19.53% 347.0 $1,748,300 16.44% 328.6 $2,773,500 17.23% 341.9 $1,916,200 16.02% 328.7 $1,652,800 4.92% 349.1 $994,600 16.99% 398.6 $2,309,700 17.72% 380.5 $2,579,600 18.79% 393.0 $1,516,500 20.40% - - - 428.5 $1,120,900 15.10% 324.2 $2,090,900 19.94% 334.6 $2,449,400 20.66% 349.5 $1,634,500 27.37% - - - 279.1 $746,600 15.09% 351.2 $1,415,100 24.06% 354.7 $1,579,300 24.59% 343.7 $1,266,900 25.81% 312.8 $838,900 10.61% 350.3 $753,400 24.31% 368.0 $1,257,800 23.08% 392.6 $1,869,100 20.65% 324.2 $1,222,600 26.54% 313.8 $884,500 10.22% 362.9 $756,200 25.61% 338.4 $878,700 21.25% 349.5 $2,046,400 13.29% 361.6 $1,725,000 15.86% 339.9 $879,000 10.14% 336.9 $721,600 22.33% 283.8 $2,036,000 13.93% 285.8 $3,684,800 18.69% 287.1 $2,717,400 16.42% 315.7 $1,864,500 10.08% 274.7 $910,100 11.08% 347.8 $1,374,700 17.62% 325.2 $2,007,800 16.89% 322.2 $1,591,800 19.64% 307.4 $1,030,400 8.93% 359.4 $858,200 17.84% 386.4 $1,401,700 14.76% 350.7 $2,525,000 15.93% 380.7 $1,765,300 14.26% 328.0 $568,200 21.17% 407.3 $591,400 13.36% 309.5 $2,673,800 19.50% 304.5 $3,301,500 21.75% 358.7 $1,474,800 20.21% 263.5 $1,054,300 14.81% 351.0 $1,100,500 19.43% 347.9 $1,302,800 19.80% 342.1 $1,904,500 18.05% 334.8 $1,044,100 23.54% 321.9 $930,600 17.65% 351.3 $717,700 20.64% 346.9 $1,177,500 19.09% 397.0 $2,388,300 22.23% 325.8 $1,682,100 30.74% 366.5 $987,000 15.58% 331.7 $835,300 17.87% 359.6 $1,164,500 23.79% 359.8 $1,689,300 21.06% 310.9 $1,010,800 27.42% 355.9 $851,900 18.63% 364.1 $838,200 25.51% 427.7 $1,331,200 16.67% 437.9 $1,542,600 15.69% 445.4 $1,404,700 16.38% 503.1 $920,200 16.03% 337.4 $754,700 18.76% 384.3 $1,434,700 18.54% 339.7 $1,537,300 20.21% 404.3 $1,353,000 17.56% 395.5 $1,139,100 15.24% 355.0 $1,008,700 19.77% 374.3 $1,164,400 17.34% 377.8 $1,284,200 17.04% 357.9 $1,194,600 16.43% - - - 378.2 $565,300 21.76% 377.7 $931,500 20.10% 371.1 $1,094,000 27.57% 379.1 $913,600 22.45% 325.9 $692,900 14.59% 410.3 $625,700 11.40% 337.9 $897,800 23.41% 369.1 $1,299,800 26.71% 359.9 $991,800 26.55% 352.5 $766,600 20.02% 294.1 $603,700 18.40% 384.5 $1,069,300 24.59% 393.0 $1,122,600 25.52% 389.0 $925,200 23.61% 351.5 $776,800 17.95% 348.5 $717,400 22.54% 373.8 $916,300 22.76% 386.5 $1,266,800 27.52% 369.6 $966,400 25.59% 356.0 $771,200 18.90% 367.7 $629,700 19.38% 377.7 $870,700 23.43% 374.1 $1,166,100 27.51% 335.9 $870,800 28.06% 343.0 $628,900 22.50% 393.3 $536,600 16.78% 379.9 $907,100 27.14% 385.5 $1,094,600 32.29% 365.0 $892,700 27.18% 405.1 $729,300 25.03% 371.5 $696,800 22.32% 396.8 $1,112,800 28.87% 384.0 $1,230,300 32.46% 386.4 $1,002,000 31.21% 450.1 $734,200 23.42% 353.8 $570,800 16.31% 393.1 $838,300 22.42% 390.2 $1,085,300 25.18% 398.9 $903,600 25.60% 306.5 $601,500 19.77% 472.7 $599,200 21.83% Composite Single Family Detached Single Family Attached Townhouse Apartment Index Benchmark Yr./Yr. % Chg. Index Benchmark Yr./Yr. % Chg. Index Benchmark Yr./Yr. % Chg. Index Benchmark Yr./Yr. % Chg. Index Benchmark Yr./Yr. % Chg. Toronto Regional Real Estate Board FOCUS ON THE MLS HOME PRICE INDEX CITY OF TORONTO INDEX AND BENCHMARK PRICE, NOVEMBER 2021 TRREB Total City of Toronto Toronto W01 Toronto W02 Toronto W03 Toronto W04 Toronto W05 Toronto W06 Toronto W07 Toronto W08 Toronto W09 Toronto W10 Toronto C01 Toronto C02 Toronto C03 Toronto C04 Toronto C06 Toronto C07 Toronto C08 Toronto C09 Toronto C10 Toronto C11 Toronto C12 Toronto C13 Toronto C14 Toronto C15 Toronto E01 Toronto E02 Toronto E03 Toronto E04 Toronto E05 Toronto E06 Toronto E07 Toronto E08 Toronto E09 Toronto E10 Toronto E11 26 Market Watch, November 2021 Copyright® 2021 Toronto Regional Real Estate Board
  • 27. 2009 86,980 $395,234 2010 85,860 $431,262 2011 89,110 $464,989 2012 85,488 $497,073 2013 87,047 $522,951 2014 92,776 $566,611 2015 101,213 $622,118 2016 113,040 $729,821 2017 92,340 $822,496 2018 78,017 $787,800 2019 87,747 $819,043 Year Sales Average Price Toronto Regional Real Estate Board January 4,546 838,087 February 7,193 910,068 March 7,942 902,788 April 2,957 820,226 May 4,594 863,563 June 8,645 931,131 July 11,033 943,594 August 10,738 951,219 September 11,033 960,613 October 10,503 968,535 November 8,728 955,889 December 7,154 932,297 January 6,888 $966,068 February 10,931 $1,044,933 March 15,628 $1,097,351 April 13,616 $1,090,522 May 11,904 $1,108,109 June 11,060 $1,089,135 July 9,340 $1,062,071 August 8,556 $1,070,093 September 9,017 $1,135,011 October 9,759 $1,155,423 November 9,017 $1,163,323 December - - Annual 95,066 $929,636 HISTORIC ANNUAL STATISTICS1,6,7 Year to Date 115,716 $1,092,212 NOTES *For historic annual sales and average price data over a longer time frame go to: http://www.torontorealestateboard.com/market_news/market_watch/historic_stats/ pdf/TREB_historic_statistics.pdf Ajax Aurora Bradford West Gwillimbury Brampton Brock Burlington C01 C02 C03 C04 C06 C07 C08 C10 C11 C12 C13 C14 C15 Caledon Clarington E01 E02 E03 E04 E06 E07 E08 E09 E10 E11 East Gwillimbury Essa Georgina Halton Hills Innisfil King Markham Milton Mississauga New Tecumseth Newmarket Oakville Oshawa Pickering Richmond Hill Scugog Uxbridge Vaughan W02 W03 W04 W05 W06 W07 W08 W09 W10 Whitchurch-Stouffville Adjala-Tosorontio Orangeville Whitby Dufferin Durham Halton Peel Simcoe Toronto York 27 Market Watch, November 2021 Copyright® 2021 Toronto Regional Real Estate Board 1 - Sales, dollar volume, average sale prices and median sale prices are based on firm transactions entered into the TRREB MLS® system between the first and last day of the month/period being reported. 2 - New listings entered into the TRREB MLS® system between the first and last day of the month/period being reported. 3 - Active listings at the end of the last day of the month/period being reported. 4 - Ratio of the average selling price to the average listing price for firm transactions entered into the TRREB MLS® system between the first and last day of the month/period being reported. 5 - Average Listing Days on Market (Avg. LDOM) refers to the average number of days sold listings were on the market. Average Property Days on Market (Avg. PDOM) refers to the average number of days a property was on the market before selling irrespective of whether the property was listed more than once by the same combination of seller and brokerage during the original listing contract period. 6 - Active listings at the end of the last day of the month/period being reported. 7 - Past monthly and year-to-date figures are revised on a monthly basis. 8 - SNLR = Sales-to-New Listings Ratio. Calculated using a 12-month moving average (sales/new listings). 9 - Mos. Inv. = Months of Inventory. Calculated using a 12-month moving average (active listings/sales). 2021 MONTHLY STATISTICS1,7 2020 MONTHLY STATISTICS1,7