Circulating water treatment project
•Download as PPTX, PDF•
1 like•256 views

The document discusses proposed improvements to the circulating water treatment system at NLC TPS II power plant. It analyzes water parameters from the current system and identifies high hardness, alkalinity, dissolved solids and oxygen that promote corrosion and scaling. A new treatment system is proposed using increased chlorine dosing to control microbes, along with corrosion and scale inhibitors. Annual chemical consumption and costs are estimated for different cycles of concentration to reduce specific water consumption below 3.5 m3/MWh. Improving the treatment process aims to control corrosion, scaling and fouling in the circulating water system.

Recommended
Recommended
More Related Content
What's hot
What's hot (20)
Similar to Circulating water treatment project
Similar to Circulating water treatment project (20)
More from Molla Morshad
More from Molla Morshad (20)
Recently uploaded
Recently uploaded (20)
Circulating water treatment project
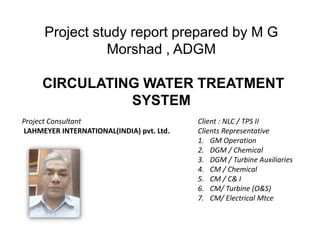
- 1. Project study report prepared by M G Morshad , ADGM CIRCULATING WATER TREATMENT SYSTEM Project Consultant LAHMEYER INTERNATIONAL(INDIA) pvt. Ltd. Client : NLC / TPS II Clients Representative 1. GM Operation 2. DGM / Chemical 3. DGM / Turbine Auxiliaries 4. CM / Chemical 5. CM / C& I 6. CM/ Turbine (O&S) 7. CM/ Electrical Mtce
- 2. 1. To reduce/control the corrosion, scaling and microbiological fouling in circulating water system by improving water treatment procedure based on recent water analysis report. 2. To reduce specific Water consumption of circulating water system below 3.5 m3/MWH by increasing COC from 1.2 to 5 as result of improvement in water treatment procedure. Project Objective
- 3. Process flow diagram CT CWPump House ForeBay Lake Power House Hot CW Cold CW Blow Down water ADPH ( Utilized for wet ash disposal ) Excess water is discharged out side of TPS II at village Nallahs Evaporation loss Drift loss Make up water Bore well /TPSII Make up water Mine II
- 4. Circulating water parameters for stage I Units (3 x 210MW) Parameters Formula Design Actual Unit Load MW 210 210 Total load TL = 3 x MW 630 630 Circulating water flow per unit (m3/Hr) Q 30810 16500 Total flow (m3/Hr) TQ = 3 x Q 92430 49500 Hold up capaciy (m3) HC 114698 114698 Water untilazation U = (TQ/HC)x100 80.59% 43.16% Reserve water R = 100 -U 19.41% 56.84% Inlet Temperature T1 42.5 46 Outlet Temperature T2 34 38 Total Evaporation loss (m3/Hr) TE = 0.00085 x2.03 x TQx(T1-T2) 1355.65 683.30 % Evaporation Loss TE/TQ 1.47% 1.38% Total Drift Loss (m3/Hr) TD = 0.02% x TQ 18.49 9.9 Blow down per unit (m3/Hr) BD 2193.3 670.3 Total Blow down (m3/Hr) TBD = 3 x BD 6579.9 2010.9 COC 1 + {TE / (TBD + TD)} 1.21 1.34 Total Make up (m3/Hr) TM = TE + TBD + TD 7954.03 2704.10 SWC (m3/MWhr) TM/TL 12.63 4.29
- 5. Circulating water parameters for stage I Units (4 x 210MW) Parameters Formula Design Actual Unit Load MW 210 210 Total load TL = 4 x MW 840 840 Circulating water flow per unit (m3/Hr) Q 31000 16500 Total flow (m3/Hr) TQ = 4 x Q 124000 66000 Hold up capaciy (m3) HC 120000 120000 Water untilazation U = (TQ/HC)x100 103.33% 55.00% Reserve water R = 100 -U -3.33% 45.00% Inlet Temperature T1 42.5 46 Outlet Temperature T2 34 37 Total Evaporation loss (m3/Hr) TE = 0.00085 x2.03 x TQx(T1-T2) 1861.47 1024.95 % Evaporation Loss TE/TQ 1.50% 1.55% Total Drift Loss (m3/Hr) TD = 0.02% x TQ 24.80 13.2 Blow down per unit (m3/Hr) BD 2193.3 2011 Total Blow down (m3/Hr) TBD = 4 x BD 8773.2 8044 COC 1 + {TE / (TBD + TD)} 1.21 1.13 Total Make up (m3/Hr) TM = TE + TBD + TD 10659.47 9082.15 SWC (m3/MWhr) TM/TL 12.69 10.81
- 6. COC and SWC for Stage I Units Cycle of Concentration COC 1.2 1.7 2 2.5 3 3.5 4 4.5 5 CW flow (m3/Hr) Q 92430 92430 92430 92430 92430 92430 92430 92430 92430 Evaporation Loss (m3/Hr) E 1357 1357 1357 1357 1357 1357 1357 1357 1357 Drift loss (m3/Hr) D 18.6 18.6 18.6 18.6 18.6 18.6 18.6 18.6 18.6 Blow Down (m3/Hr) BD =[E/(COC-1)]- D 6766.4 1920 1338 886.07 659.9 524.2 433.7 369.11 320.65 Make up (m3/Hr) MU =E +D+BD 8142 3295.6 2714 2261.7 2036 1900 1809 1744.7 1696.25 Unit Generation (MW) MW 630 630 630 630 630 630 630 630 630 Specific Water Consumption (m3/MWhr) MU/MW 12.92 5.23 4.31 3.59 3.23 3.02 2.87 2.77 2.69
- 7. COC and SWC for Stage II Units Cycle of Concentration COC 1.2 1.8 2 2.5 3 3.5 4 4.5 5 CW flow (m3/Hr) Q 93000 93000 93000 93000 93000 93000 93000 93000 93000 Evaporation Loss (m3/Hr) E 2077.44 2077.4 2077 2077.4 2077 2077 2077 2077.4 2077.44 Drift loss (m3/Hr) D 39.6 39.6 39.6 39.6 39.6 39.6 39.6 39.6 39.6 Blow Down (m3/Hr) BD = [E/(COC-1)]- D 10347.6 2557.2 2038 1345.4 999.1 791.4 652.9 553.95 479.76 Make up (m3/Hr) MU =E +D+BD 12464.64 4674.2 4155 3462.4 3116 2908 2770 2671 2596.8 Unit Generation (MW) MW 840 840 840 840 840 840 840 840 840 Specific Water Consumption (m3/MWhr) MU/MW 14.84 5.56 4.95 4.12 3.71 3.46 3.30 3.18 3.09
- 8. 1 10 100 1000 10000 1 2 3 4 5 6 7 8 9 COC SWC MU BD
- 9. Water analysis report I. The turbidity and TSS are below detection level for CW makeup water, Circulating water for both stages This is due to the filtration property of soil for ground water. Turbidity & Total Suspended Solids Unit Limiting value :As per IS-8188 Make up water Stage I / Fore bay Stage II / Fore bay Turbidity NTU Not Greater than 50 NTU BDL BDL BDL Suspended solid(TSS) (mg/l ) or ppm NA BDL BDL BDL
- 10. I. As the feed water is from bore wells, the degree of hardness of CW makeup is Very hard and so are the circulating water of both stages. Water analysis report Total Hardness Unit Limiting value :As per IS-8188 Make up water Stage I /Fore bay Stage II /Fore bay Total hardness (caco3) (mg/l ) or ppm Not Greater than 250 ppm as CaCO3 370 425 470 Mg+Fe (mg/l ) or ppm Not Greater than 0.5 ppm 31.59 39 46.17 Fe (mg/l ) or ppm ****** BDL BDL BDL Na (mg/l ) or ppm NA 72 96 98 No3 (mg/l ) or ppm NA 4.32 4.92 5.06
- 11. I. Alkalinity is found to be higher in make up and circulating water in both stages II. Higher the alkalinity, greater is the capacity of water to neutralize the acids. III. Alkalinity is an important factor for calcium carbonate scales formed on the heat exchanger surfaces. Total Alkalinity Unit Limiting value :As per IS-8188 Make up water Stage I /Fore bay Stage II /Fore bay Total Alkanity (caco3) (mg/l ) or ppm Not Greater than 200 ppm as CaCO3 240 250 320 Bi carbonate (mg/l ) or ppm NA 240 290 300 Carbonate (mg/l ) or ppm NA BDL 20 29 Water analysis report
- 12. Total Dissolved Solids, Conductivity & Silica: Unit Limiting value :As per IS- 8188 Make up water Stage I / Fore bay Stage II / Fore bay Total Dissolved solids (TDS) (mg/l ) or ppm Not Greater than 500 ppm 621 671 841 Ca (mg/l ) or ppm NA 96.19 106 112.22 Mg (mg/l ) or ppm ****** 31.59 39 46.17 K (mg/l ) or ppm NA 4 6 5 So4 (mg/l ) or ppm Not Greater than 600 ppm 96.24 105.62 125.01 Fluoride (mg/l ) or ppm NA 0.61 0.69 0.67 Electrical Conductivity (μS/cm) NA 1248 1547 1813 Sio2 (mg/l ) or ppm Not Greater than 75 ppm 12.84 28.86 47.08 Cl (mg/l ) or ppm Approximately 1.3 118.77 139.2 173.21 Free Cl (mg/l ) or ppm 0.2-0.5 ppm BDL BDL BDL Water analysis report 1. TDS comprise dissolved inorganic salts (principally calcium, magnesium, potassium, sodium, bicarbonates, chlorides, and sulphates ) and some small amounts of organic matter are found to be higher side. 2. Dissolved Chlorine is higher but free chlorine is found to be below detection level.
- 13. I. The dissolved oxygen is higher than limiting values. II. Higher values of dissolved oxygen in water (more than 3 mg/l) promotes healthy environment for microorganisms and increases the tendency of corrosion. III. As dissolved oxygen in water is on higher side, demand of oxygen (COD) is not detected. IV. COD is the amount of oxygen required for degradation of organic compounds of water to occur. Dissolved Oxygen & COD Unit Limiting value :As per IS- 8188 Make up water Stage I /Fore bay Stage II /Fore bay Chemical Oxygen Demand(COD) (mg/l ) or ppm Not Greater than 4 ppm BDL BDL BDL Dissolved O2 (mg/l ) or ppm Not Greater than 3 ppm 6.1 5.9 5 Water analysis report
- 14. Stability Indices (LSI & RSI) Formula Make up Stage I Stage II pH pH 7.71 8.53 8.48 TDS 621 671 841 TDS Factor - A A 0.2 0.2 0.2 Temperature 28.7 28.9 29.1 Temp Factor - B B 1.9 1.9 1.9 Calcium Hardness 370 425 470 Hardness Factor -C C 2.2 2.2 2.3 Alkalinity 240 250 320 Alkanity Factor -D D 2.4 2.4 2.5 pHs pHs =9.3+A+B – (C+D) 6.8 6.8 6.6 Langelier Index (LSI) = pH- pHs 0.91 1.73 1.88 Ryznar Index (RSI) = 2 pHs – pH 5.89 5.07 4.72 LSI=0 or RSI=6: Water is chemically balanced or Neutral Moderate Scale forming Tendency Very sever Scale forming Tendency Very sever Scale forming Tendency LSI<0 or RSI>6: Water has a Corrosive Tendency LSI>0 or RSI<6: Water has a Scale forming Tendency Water analysis report
- 15. Desired Circulating Water Quality Parameters As per IS-8188
- 17. Microbiological fouling in NDCT Fills area Microbial slimes in NDCT outer columnsMicrobiological fouling in CW channel Physical conditions
- 18. COLTCS sponge balls removed along with Scale from condenser tubes PHE plates with microbiological fouling being cleaned Physical conditions
- 19. Blow down Chlorination Scale inhibitor dosing Present chemical treatment system It is carried out for maintaining calcium concentration around 200 ppm based on the water analysis at frequent intervals. "Shock dosing of Chlorine“ at the rate of 1.08 ppm and 0.81 ppm for Stage-I & II respectively. Continuous dosing of HEDP“ at the rate of 0.57 ppm and 0.42 ppm for stage-I & II respectively.
- 20. Continuous monitoring of water parameters Acid dosing Proposed chemical treatment system Dosing rate to be increased further to the desire level utilizing the existing facilities to control the growth of microorganisms Automatic blow down to maintain the desire parameters Chlorination To be introduced to reduce water harness to the desire level Dosing for Corrosion Inhibitor To be introduced at the require rate to reduce corrosion Dosing for Scale Inhibitor To be introduced at the require rate to reduce scale formation Dosing for Biocide To be introduced at the require rate to control the growth of microorganisms New facilities to be created with capital investment
- 21. Chlorine Dosing Stage I Stage II Unit Total Circulating Water Flow Q 92395 124000 m3/hr Present Dosage Rate PDR 1.08 0.81 ppm Maximum Dosage Rate MDR 7.79 7.74 ppm Recommended dosing rate RDR = (MDR-PDR) 5 5 ppm Required dosing per Hr RDH = Q x RDR/1000 461.975 620 Kg/Hr Operating Hrs / day H 1.5 1.5 Hr Required dosing per /day RDH x H 692.96 930.00 Kg/day
- 22. COC & water cost for Stage – I COC Corrosion Inhibitor Consumption Scale Inhibitor Consumption Biocide Consumption Chlorine Consumption Sulphuric Acid Consumption TotalannualchemicalcostCrRs SWC(m3/MWhr) Annualgen@85%PLF(MWHr) Annualwaterconsumption(m3) WatercostinRs/m3 Kg/day Rs/Kg AnnualcostCrRs Kg/day Rs/Kg AnnualcostCrRs Kg/day Rs/Kg AnnualcostCrRs Kg/day Rs/Kg AnnualcostCrRs Kg/day Rs/Kg AnnualcostCrRs 5 217.7 250 1.99 217.7 85 0.68 9.9 46 0.02 692.9 85 2.15 1467 270 14.46 17.30 2.69 195457 525780 329.02 2 158.3 250 1.44 158.3 85 0.49 3.17 46 0.01 692.9 85 2.15 855.9 270 8.43 11.08 4.31 195457 842421 131.54 1.2 380 250 3.47 380 85 1.18 0 46 0.00 692.9 85 2.15 0 270 0.00 3.33 12.92 195457 2525310 13.18
- 23. COC & water cost for Stage – II COC Corrosion Inhibitor Consumption Scale Inhibitor Consumption Biocide Consumption Chlorine Consumption Sulphuric Acid Consumption TotalannualchemicalcostCrRs SWC(m3/MWhr) Annualgen@85%PLF(MWHr) Annualwaterconsumption(m3) WatercostinRs/m3 Kg/day Rs/Kg AnnualcostCrRs Kg/day Rs/Kg AnnualcostCrRs Kg/day Rs/Kg AnnualcostCrRs Kg/day Rs/Kg AnnualcostCrRs Kg/day Rs/Kg AnnualcostCrRs 5 346.8 250 3.16 346.8 85 1.08 15.75 46 0.03 930 85 2.89 2385 270 23.50 27.49 3.09 260610 805284 341.39 2 252.2 250 2.30 252.23 85 0.78 5.04 46 0.01 930 85 2.89 1363 270 13.43 17.11 4.95 260610 1290019 132.62 1.2 832.6 250 7.60 832.6 85 2.58 0 46 0.00 930 85 2.89 0 270 0.00 5.47 14.84 260610 3867452 14.14
- 24. Water cost = 81.588 x COC- 60.291 0 50 100 150 200 250 300 350 400 0 1 2 3 4 5 6 WatercostRs/m3 COC
- 25. Cost Analysis - Chlorination plant (Existing Plant) CAPITAL COST RUNNING COST Items Cr Rs Consumable Items Annual cost in Cr Rs Operation & maintenance Annual cost in Cr Rs Construction of building 0.00 Chlorine (stage I +II) 5.04 Machine spare items @10% of investment 0.00 Mechanical equipment 0.25 Electrical equipment 0.00 Manpower 0.00 Monitoring equipment 0.00 Electrical energy for 250KW load at 65% PLF @ Rs 3.90/Kwhr 0.00 Others 0.00 Total Investment 0.25 Total Annual cost 5.04 Deprication @10% 0.03 Total Annual Cost 0.00Annual cost for expected life span of 20 years 0.01 Total annual Operation & maintenance cost of the plant : Rs 5.05 Cr
- 26. Cost Analysis - CW treatment plant (New Plant) CAPITAL COST RUNNING COST Items Cr Rs Consumable Items Annual cost in Cr Rs Operation & maintenance Annual cost in Cr Rs Construction of building 3.00 Corrosion Inhibitor (stage I +II) 5.15 Machine spare items @10% of investment 0.80 Mechanical equipment 2.00 Scale Inhibitor (Sage I+II) 1.76 Electrical equipment 0.50 Biocide(Stage I +II) 0.05 Manpower 0.50 Monitoring equipment 2.00 Acid (Stage I +II) 37.96 Electrical energy for 250KW load at 65% PLF @ Rs 3.90/Kwhr 0.02Others 0.50 Others 0.5 Total Investment 8.00 Total Annual cost 45.42 Deprication @10% 0.80 Total Annual Cost 1.32Annual cost for expected life span of 20 years 0.36 Total annual Operation & maintenance cost of the plant : Rs 47.10 Cr
- 27. MCC1MCC2 CWPH TR 1 1250 KVA CWPH TR 2 1250 KVA Location Lay Out of the new plant StageIICirculating WaterPumpHouse Fore Bay Existing Chlorination plant Proposed plantof 250KWload Circulation waterpumpfor dryflyash compressor
- 28. Load on CWPH Tr - 2 Load on CWPH Tr - 1 Feeder (A) Fire water pump P5 (KW) Dry Ash pump (KW) Chlorination house feeder (A) Feeder (A) Fire water pump P4 (KW) Fire water pump M3 (KW) 600 160 75 200 600 160 75 KVA 249 136 63.75 83 249 136 63.75 Total KVA 531.75 448.75 Operating KVA @75% 398.8125 336.5625 Transformer KVA capacity 1250 1250 % Loading level 31.91% 26.93% Existing loading level for transformer
- 29. Loading level calculation with additional load Normal Emergency Stages Stage II Stage II Formula CWPH Tr 1 CWPH Tr 2 CWPH Tr 1 CWPH Tr 2 Rated KVA Capacity KVA 1250 1250 1250 1250 Rated primary KV KVp 6.6 6.6 6.6 6.6 Rated Primary Amps Ip = KVA/(1.732xKVp) 109.35 109.35 109.35 109.35 Rated secondary KV KVs 0.415 0.415 0.415 0.415 Rated Primary Amps Is = KVA/(1.732xKVs) 152.13 152.13 152.13 152.13 Operating primary current (Amps) A 35.00 35.00 70.00 0.00 Max operating KVA KVA1 = 1.732 xA x KVp 400.09 400.09 800.18 0.00 % Loading KVA1/KVA 32.01% 32.01% 64.01% 0.00% Addition Load (KW) AL 125 125 250 0 Additional KVA KVA2= AL/0.85 147.06 147.06 294.12 0.00 Current additional Load KVA2/(1.732*KVs) 204.60 204.60 409.19 0.00 Operating additional KVA @70% KVA3 = (KVA2 x70%) 102.94 102.94 205.88 0.00 Operating KVA with additional load KVA4 = (KVA3+KVA2) 503.03 503.03 1006.07 0.00 Expected % Loading with additional load EL = (KVA3/KVA)x100 40.24% 40.24% 80.49% 0.00%
- 30. Clarification required 1. As per water analysis report , chlorine (Cl) level is 118 - 173 mg/l above the limiting values 1.3mg/l . But free chlorine is found to be below detection level. It is to be clarified. 2. When chlorine level is already very high, why additional chlorine dosing has been recommended? 3. When chlorine dosing is already in practice , why biocide is required for controlling micro organism 4. COC has been calculated on the basis of design water flow . Because of this reason chemical requirement for the treatment is found to be too high and therefore the cost of the water has become as high as Rs 340/ m3 or Rs 0. 34 / litre . Effort may be made to minimize the cost of water by calculating the actual flow or some alternate water treatment methods. 5. Huge quantity of acid dosing has been recommended. The impact of acid dosing on metal corrosion is to be clarified. Environmental impact is also be clarified. 6. It is to be confirmed whether similar CW treatment method has been adopted by any thermal power plant in India.
- 31. THANK YOU