Streamlining Python Development: A Guide to a Modern Project Setup
Exam Questions on Basic Statistics
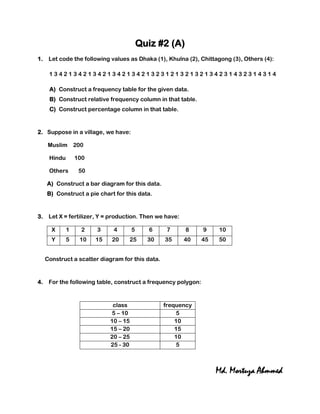
1. Quiz #2 (A)
1. Let code the following values as Dhaka (1), Khulna (2), Chittagong (3), Others (4):
13421342134213421342132312132132134231432314314
A) Construct a frequency table for the given data.
B) Construct relative frequency column in that table.
C) Construct percentage column in that table.
2. Suppose in a village, we have:
Muslim 200
Hindu 100
Others 50
A) Construct a bar diagram for this data.
B) Construct a pie chart for this data.
3. Let X = fertilizer, Y = production. Then we have:
X 1 2 3 4 5 6 7 8 9 10
Y 5 10 15 20 25 30 35 40 45 50
Construct a scatter diagram for this data.
4. For the following table, construct a frequency polygon:
class frequency
5 – 10 5
10 – 15 10
15 – 20 15
20 – 25 10
25 - 30 5
Md. Mortuza Ahmmed