
Recommended
Recommended
More Related Content
Similar to Appendix 2 Electric Power Supply Survey Report .pdf
Similar to Appendix 2 Electric Power Supply Survey Report .pdf (20)
More from NeerajOjha17
More from NeerajOjha17 (20)
Recently uploaded
Recently uploaded (20)
Appendix 2 Electric Power Supply Survey Report .pdf
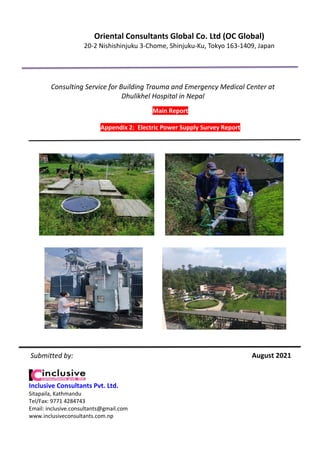
- 1. August 2021 Main Report Appendix 2: Electric Power Supply Survey Report Consulting Service for Building Trauma and Emergency Medical Center at Dhulikhel Hospital in Nepal Oriental Consultants Global Co. Ltd (OC Global) 20-2 Nishishinjuku 3-Chome, Shinjuku-Ku, Tokyo 163-1409, Japan Inclusive Consultants Pvt. Ltd. Sitapaila, Kathmandu Tel/Fax: 9771 4284743 Email: inclusive.consultants@gmail.com www.inclusiveconsultants.com.np Submitted by:
- 2. Electric Power Supply Survey Report for Building Trauma and Emergency Medical Center at Dhulikhel Hospital in Nepal Submitted By : Inclusive Consultants Pvt. Ltd 1 Table of Contents ABBREVIATIONS ...............................................................................................................3 LIST OF FIGURES ...............................................................................................................4 1. Introduction..............................................................................................................5 2. Scope and Objectives.................................................................................................5 3. Basic Terms..............................................................................................................5 3.1 Voltage........................................................................................................................5 3.2 Current........................................................................................................................6 3.3 Power..........................................................................................................................6 3.4 Power Factor ...............................................................................................................6 3.5 Energy .........................................................................................................................6 3.6 Losses..........................................................................................................................6 3.6.1 Technical Losses.......................................................................................................7 3.6.2 Non-Technical Losses (Commercial Losses) ...............................................................7 3.7 Frequency....................................................................................................................7 4. Survey Methodology..................................................................................................7 4.1 Desk Study ........................................................................................................................7 4.2 Site Visit ............................................................................................................................7 4.3 Data collection and investigation ....................................................................................7 5. Electric Power Supply Survey of Dhulikhel Hospital .................................................9 5.1 Existing Power Supply Scenario ....................................................................................9 5.2 Record of Power Failure............................................................................................. 14 5.3 Measurements at Site................................................................................................ 17 5.3.1 HV side analysis ..............................................................................................................17 5.3.1.1 Power Consumption from Grid......................................................................................18 5.3.1.2 Energy Consumption from the Grid...............................................................................18 5.3.1.3 Power Factor Variation: .................................................................................................19 5.3.1.4 Grid Voltage level:..........................................................................................................22 5.3.1.5 Frequency variation:.......................................................................................................26 5.3.2 LV Side analysis...............................................................................................................26 5.3.2.1 Voltage Analysis..............................................................................................................26 5.3.2.2 Frequency Analysis.........................................................................................................28 5.5 Interaction with utility ............................................................................................... 32 6. Conclusion and Recommendations.......................................................................... 33 7. Annexes.................................................................................................................. 35 Annex 1: Site Visit Photographs ..................................................................................... 36 Annex 2: Electrical Power Supply Survey Data............................................................... 43 Annex 3: Electrical Power Supply Drawing .................................................................... 43
- 3. Electric Power Supply Survey Report for Building Trauma and Emergency Medical Center at Dhulikhel Hospital in Nepal Submitted By : Inclusive Consultants Pvt. Ltd 2 Annex 4: Power Connection from Dhulikhel Hospital Dedicated Feeder to Trauma Center ...................................................................................................................................... 43 Annex 5: Time of Day Power Consumption from Grid (April 25th to May 1st) ................ 43 Annex 6: Technical Specification for Solar Net Metering System.................................... 43
- 4. Electric Power Supply Survey Report for Building Trauma and Emergency Medical Center at Dhulikhel Hospital in Nepal Submitted By : Inclusive Consultants Pvt. Ltd 3 ABBREVIATIONS A Ampere V Voltage KW Kilowatt KWh Kilowatt Hour Mwh Megawatt Hour NEA Nepal Electricity Authority Hz Hertz KV Kilovolt KVA Kilovolt Ampere P Active Power Q Reactive Power S Apparent Power Φ Power factor angle Pf Power factor
- 5. Electric Power Supply Survey Report for Building Trauma and Emergency Medical Center at Dhulikhel Hospital in Nepal Submitted By : Inclusive Consultants Pvt. Ltd 4 LIST OF FIGURES Figure 5-1 Power Supply arrangement at Utility Substation...................................................10 Figure 5-2 Monthly Outage Duration ......................................................................................15 Figure 5-3 Yearly Power Outage Frequency ...........................................................................15 Figure 5-4 Yearly Power outage frequency of Dhulikhel Hospital .........................................16 Figure 5-5 Yearly duration of power outage of Dhulikhel Hospital........................................16 Figure 5-6 Daily Variation of Load .........................................................................................18 Figure 5-7 Daily Energy Variation ..........................................................................................18 Figure 5-8 Daily Power Factor Variation ................................................................................19 Figure 5-9 Hourly Power Factor Variation..............................................................................19 Figure 5-10 Hourly p.f. Variation on April 25.........................................................................20 Figure 5-11 Hourly p.f. Variation on April 26.........................................................................20 Figure 5-12 Hourly p.f. Variation on April 27.........................................................................20 Figure 5-13 Hourly p.f. Variation on April 28.........................................................................21 Figure 5-14 Hourly p.f. Variation on April 29.........................................................................21 Figure 5-15 Hourly p.f. Variation on April 30.........................................................................21 Figure 5-16 Hourly p.f. Variation on May 1............................................................................22 Figure 5-17 Hourly Voltage variation of April 12th .................................................................22 Figure 5-18 Hourly Voltage variation of April 19th .................................................................22 Figure 5-19 Hourly Voltage variation of April 23rd .................................................................23 Figure 5-20 Hourly Voltage variation of April 29th .................................................................23 Figure 5-21 Hourly Voltage variation of May 2nd ...................................................................23 Figure 5-22 Hourly Voltage variation of May 7th ....................................................................24 Figure 5-23 Hourly Voltage variation of May 13th ..................................................................24 Figure 5-24 Hourly Voltage level analysis of April 12 ...........................................................24 Figure 5-25 Low Voltage start time frequency........................................................................25 Figure 5-26 Low Voltage cleared time frequency ...................................................................25 Figure 5-27 Frequency variation over a week period ..............................................................26 Figure 5-28 Hourly Variation of Voltage level of June 2nd .....................................................27 Figure 5-29 Hourly Variation of Voltage level of June 3rd ......................................................27 Figure 5-30 Hourly Variation of Voltage level of June 4th ......................................................27 Figure 5-31 Hourly Variation of Voltage level of June 5th ......................................................28 Figure 5-32 Hourly Variation of Voltage level of June 6th ......................................................28 Figure 5-33 Hourly Frequency variation on June 2nd .............................................................29 Figure 5-34 Frequency variation over a week period ..............................................................29 Figure 5-35 Comparison of yearly Outage Hrs........................................................................32 Figure 5-36 Comparison of yearly outage frequency ..............................................................32 LIST OF TABLES Table 1 Existing Power Supply arrangement for Dhulikhel Hospital from Utility Substation10 Table 2 Consumer Record of Dhulikhel Hospital at Utility ....................................................11 Table 3 Details of Transformers supplying Dhulikhel Hospital..............................................11 Table 4 Details of Automatic Voltage Stabilizer.....................................................................12 Table 5 Specification of Generators used in Dhulikhel Hospital ............................................13 Table 6 Details of Solar installed.............................................................................................14 Table 7 Size of solar panels used.............................................................................................14 Table 8 Classification of Voltage level as per required load...................................................30 Table 9 Comparison of tapping points.....................................................................................31
- 6. Electric Power Supply Survey Report for Building Trauma and Emergency Medical Center at Dhulikhel Hospital in Nepal Submitted By : Inclusive Consultants Pvt. Ltd 5 1. Introduction Dhulikhel Hospital is an independent, not for profit, non-government institution which was conceived and supported by the Dhulikhel community, as a quality health services provider. Dhulikhel Hospital is located in Dhulikhel Municipality, headquarter of the Kavre district. It has a population of about fourteen thousand and Kavre district has the population of about 1.6 million people. The hospital covers the population of approximately 1.9 million people from Kavrepalanchowk, Sindhu-palchowk, Dolakha, Sindhuli, Ramechhap, Bhaktapur and other surrounding districts. Hospitals being one of the most sensitive area, the power supply interruption are eschewed. So, to increase the reliability of the incoming power supply a survey for Electric power supply is conducted to assess the adaptability and auditability of the electrical supply for healthcare service purposes. Major works done in the survey can be synopsized as, 1. Recording of the history and frequency of power failure. The frequency and duration of power failure are noted and analyzed along with the time zone of power failure. 2. Measurement of fluctuation of voltage. The fluctuation of voltage is famed along with the time for voltage sag and restoration to the normal voltage. 3. Measurement of fluctuation of Frequency. The frequency of the system changes depending on the load connected to the system. The fluctuation of frequency of the supply system is analyzed which can define the quality of the supplied power system. 2. Scope and Objectives The main objective of this survey is to check the quality of the supply system along with the variation of load at different time in the hospital, which helps to scrutinize the adaptability and auditability of the supplied power system at the distribution level. 3. Basic Terms 3.1 Voltage Voltage is one of the fundamental parameters associated with electrical power system. Voltage can be considered as the pressure that forces the charged electrons to flow in an electrical circuit. The unit of voltage is volt(V). The operating voltage is an important point to be considered as the equipment’s operate on this value. Nepal Electricity Authority has standardized the Operating Voltage Level in Nepal as follows: i) Low Tension Supply (1) 230 Volt (Single Phase) (2) 400 Volt (Three Phase)
- 7. Electric Power Supply Survey Report for Building Trauma and Emergency Medical Center at Dhulikhel Hospital in Nepal Submitted By : Inclusive Consultants Pvt. Ltd 6 ii) High Tension Supply (1) Middle Voltage Level- 11 kV & 33 kV (3 Phase) (2) Upper Voltage Level- 66 kV & above (3 Phase) 3.2 Current Current is a flow of electrical charge carriers, usually electrons in a conducting material known as conductor. Whenever a voltage is applied in a closed circuit, the voltage causes a flow of electron in a particular direction which is known as current. The unit of current is Ampere(A). The flow of current depends on the load connected across the voltage supply. As in Nepal, only up to 30 Ampere loads can be drawn from an approved single-phase supply from the utility. Consumers have to opt for 3 phase-supply for loads requiring higher than 30 Ampere. 3.3 Power Electrical power is the rate, per unit time, at which electrical energy is transferred by an electrical circuit. Actually, power is the combination of both voltage and current in the circuit. In AC system power can be divided into two parts, first is active power which does useful work in the circuit. Second one is reactive power which produces the magnetic field in the system. The combination of both active and reactive power is known as apparent power. The unit of active power is Watt, reactive power is VAR and apparent power is volt-ampere. As per NEA, consumers requiring load greater than 50 KVA shall install private transformers. 3.4 Power Factor Power factor, cos(Φ), is an important part of an AC circuit which is defined as the ratio of active power (P) to apparent power (S), and is generally expressed as either a decimal value, for example 0.8. Power factor defines the phase angle between the current and voltage waveforms, were I and V are the magnitudes of rms values of the current and voltage. The value of Power Factor should be close to 1 for better performance. 3.5 Energy Energy, in physics, the capacity for doing work. It may exist in potential, kinetic, thermal, electrical, chemical, nuclear, or other various forms. Electrical energy is a form of energy resulting from the flow of electric charge. Electrical energy may be either potential energy or kinetic energy, but it's usually encountered as potential energy, which is energy stored due to the relative positions of charged particles or electric fields. The movement of charged particles through a wire or other medium is called current or electricity. Electrical energy is measured in kwh (Kilo-watt hour). 3.6 Losses
- 8. Electric Power Supply Survey Report for Building Trauma and Emergency Medical Center at Dhulikhel Hospital in Nepal Submitted By : Inclusive Consultants Pvt. Ltd 7 Power loss in a circuit is the wastage of the electrical energy. While transforming power from generation point to the consumer end various electrical equipment’s are connected through the cable, overhead conductors and can be explained as transmission and distribution losses. We can generally divide these losses into two types: 3.6.1 Technical Losses The technical losses are due to energy dissipated in the conductors, equipment used for transmission line, transformer, sub- transmission line and distribution line and magnetic losses in transformers. The major amount of losses in a power system is in primary and secondary distribution lines. While transmission and sub-transmission lines account for only about 30% of the total losses. Therefore, the primary and secondary distribution systems must be properly planned to ensure within limits. 3.6.2 Non-Technical Losses (Commercial Losses) Non-technical losses are related to meter reading, defective meter and error in meter reading, billing of customer energy consumption, lack of administration, financial constraints, and estimating unmetered supply of energy as well as energy thefts. 3.7 Frequency Frequency, in simple words, is how often something repeats. Alternating current (ac) frequency is the number of cycles per second in an ac sine wave. Frequency is the rate at which current changes direction per second. It is measured in hertz (Hz), an international unit of measure where 1 hertz is equal to 1 cycle per second. The value of frequency of Nepalese and Indian power system is 50Hz whereas for American power system it is 60 Hz. Frequency plays an important role in power system as it is one of the parameters to define the quality of the power system. The value of frequency changes with change in load, so to supply quality power it’s value must be maintained close to the predefined value. In Nepal the predefined value is 50 Hz and a tolerance of ± 2.5 is acceptable according to NEA. 4. Survey Methodology 4.1 Desk Study Planning for survey methodology was conducted with the team of engineers and technicians at the office. The initial survey, site visit and field measurement planning were altered by the covid restrictions. However, improvisations on the planning was done to minimize the effects of restrictions and gain the necessary information. 4.2 Site Visit Site visit was conducted at the preliminary stage of study to gain the necessary data and conduct investigations. Site visit to Dhulikhel Hospital, Banepa 66/11 kv Substation and NEA utility office was done. 4.3 Data collection and investigation
- 9. Electric Power Supply Survey Report for Building Trauma and Emergency Medical Center at Dhulikhel Hospital in Nepal Submitted By : Inclusive Consultants Pvt. Ltd 8 Visual inspections, interviews/meetings with the utility & hospital officials, accessing the installed monitoring systems and cross-checking the records through measurements were carried out for data collection related to the existing power supply and facilities. • For clarifying the existing facilities at the hospital, visual inspections of the equipment and nameplates of the equipment were checked. Confirmation and verification of those data with the official (engineer) from hospital were done through interactions. At the utility side, consumer record of the hospital was acquired, inspection at the utility substation was done, the line route from the substation to the hospital was inspected. Interactions with the operators at the substation and technical chief of the local utility was done to understand the power supply arrangement, maintenance issues and to ensure the credibility of the information collected. • The records of power outages (frequency & duration) throughout the year were obtained from the utility substation. The weekly logbook for power outages, maintained at the substation provided with the time and frequency of the outage and the reason for outage. • Measurement of fluctuations in voltage and frequency were measured at the hospital. The data were measured at two different points. One at the secondary side of the 200 KVA transformer and one at the point of primary side metering point. The meter at the HV side metering records the electrical parameters sampled at every half hour interval for over a time period of one month. The data from the meter was verified using external measurement devices. For the analysis purpose the data from the meter was downloaded using the meter software, since the external measurements were subjected to human errors and better accuracy class of the meter. At the secondary side the data was measured for over a week of period.
- 10. Electric Power Supply Survey Report for Building Trauma and Emergency Medical Center at Dhulikhel Hospital in Nepal Submitted By : Inclusive Consultants Pvt. Ltd 9 5. Electric Power Supply Survey of Dhulikhel Hospital Dhulikhel Hospital, located in Dhulikhel Municipality, is an immediate consumer of Kavre Distribution and Consumer Service office-the local electricity utility. The major loads at Dhulikhel hospital includes biomedical equipment. The findings of the survey is mainly branched into three parts as follows: 5.1 Existing Power Supply Scenario Dhulikhel Hospital Receives electricity supply from the 66/11 kv Banepa Substation, through a approx. 2 km 11 kv sub-transmission line. The 11 kv line provides a dedicated supply for Dhulikhel hospital, i.e. there is a separate line that feeds electricity to the hospital directly from the substation supply: no other consumers are connected to the supply line. Figure 5.1 shows the single line diagram of the power supply arrangement for Dhulikhel Hospital Feeder at the utility substation. Related parameters are shown by Table 1. Similarly, the data of record of the supply system to this hospital at NEA is shown by Table 2. Findings of Survey • 1) Existing Power Supply Scenario • Utility Substation • Line • Transformers • Generators • Solar Power • Utility Record • 2) Power Failure History • Forced Outage • Line Tripping • 3) Measurements at Site • Measuremet at HV Side • Energy COnsumption • Voltage Fluctuation • Frequency • Power Factor • Measurement at LV Side • Voltage • Frequency
- 11. Electric Power Supply Survey Report for Building Trauma and Emergency Medical Center at Dhulikhel Hospital in Nepal Submitted By : Inclusive Consultants Pvt. Ltd 10 Figure 5-1 Power Supply arrangement at Utility Substation Table 1 Existing Power Supply arrangement for Dhulikhel Hospital from Utility Substation S.No. Item Description 1 Supply Voltage 11 kv 2 Conductor Size 50 sq. mm 3 Underground Conductor Size 200sq.mm 3-Core 3 Substation name Banepa Substation, Banepa 4 Substation Capacity 22.5 MVA, 66/11 kv 5 Approx. line Length 2 km 6 Feeder Type Dedicated 7 Protection Relay at Utility Substation MICOM P111 Multifunction Relay 8 Circuit Breaker at Utility Substation Vacuum Circuit Breaker 9 Rate Amps of CB 630 A Panchkhal S/s Bhaktapur S/s 66 kV Busbar 66/11 kv, 22.5 MVA Dhulikhel Hospital Dedicated 11kv Feeder 11 kV Busbar 11 kV Public Utility Feeders
- 12. Electric Power Supply Survey Report for Building Trauma and Emergency Medical Center at Dhulikhel Hospital in Nepal Submitted By : Inclusive Consultants Pvt. Ltd 11 Table 2 Consumer Record of Dhulikhel Hospital at Utility Consumer Name Dhulikhel Hospital Consumer Number 100.19.202 Consumer Category Non-Commercial Approved Load 1430 KVA Billing Method Medium Voltage-TOD Monthly Billing Date 19th of Nepalese Month Biiling (HT/LT) HT There are a total of three transformers of 500KVA, 630KVA and 200KVA ( Total :1330 KVA) in the premises of this hospital. The three transformers supply different areas of the hospital. One 100 KVA transformer also sits in the facility but is currently not in operation. The details of these transformers is shown by Table 3. Table 3 Details of Transformers supplying Dhulikhel Hospital Details TR1 TR2 TR3 Manufacturer Nepal Ekarat Engineering Nepal Ekarat Engineering (NEEK) Nepal Ekarat Engineering (NEEK) Ratio 11/0.4 11/0.4 11/0.4 Size 500 KVA 630 KVA 200 KVA Frequency 50 Hz 50 Hz 50 Hz No. of Phases 3 3 3 Earthing Nos LT Cable Type ABC ABC UG Cable Tap Function Automatic On Load Tap Changer - Current Tapping 2 - -
- 13. Electric Power Supply Survey Report for Building Trauma and Emergency Medical Center at Dhulikhel Hospital in Nepal Submitted By : Inclusive Consultants Pvt. Ltd 12 Tap Size - 17 Steps: 11770 V to 8690 V Mounting Platform Platform Pole Mounted Connection Vector Group DYN 11 DYN 11 DYN 11 HV Side Delta Delta Delta LV Side Grd. Wye Grd. Wye Grd. Wye Cooling System ONAN ONAN ONAN Oil Level Ok Ok OK Condenser Yes Yes Yes HV Side Protection Drop Out Fuse Drop Out Fuse & Lightning Arrestor Drop Out Fuse & Lightning Arrestor Voltage Stabilizer Installed Yes Yes - Coverage Sections All (except OPD, Dental Department & Hostels) OPD Block Dental Department and Hostels Automatic Voltage Stabilizer are installed in series with the 500 KVA & 630 KVA rating transformers. Their details are as follows: Table 4 Details of Automatic Voltage Stabilizer Manufacturer Nepal Ekarat Engineering Nepal Ekarat Engineering KVA Rating 500 630 Phase 3 3 Type Oil Immersed Oil Immersed Input Voltage 8000-12000 8000-12000 Rated Output Voltage 400 V 400 V Output Current 696 A 879 A
- 14. Electric Power Supply Survey Report for Building Trauma and Emergency Medical Center at Dhulikhel Hospital in Nepal Submitted By : Inclusive Consultants Pvt. Ltd 13 Insulation Class A A Frequency 50 Hz 50 Hz Note: Voltage Stabilizer is not installed for 200 KVA rating Transformer To increase the reliability and ensure continuous supply of power to the hospital four generators of total rating 610KVA are used. The specification of used generator is shown by Table 5. Table 5 Specifications of Generators used in Dhulikhel Hospital Details G1 G2 G3 G4 Manufacturer FG Wilson Crompton Greaves Crompton Greaves FG Wilson Rated KVA at rated rpm KVA 100 250 160 100 Rated KW KW 80 200 128 80 Rated RPM rpm 1500 1500 1500 1500 Frequency Hz 50 50 50 50 Power Factor lagging 0.8 0.8 0.8 0.8 Voltage (1φ) V 240 240 240 240 Noise Level dBA - 75 75 - To facilitate hospital with uninterruptable power supply utilizing green energy sources, solar power to used. The Dhulikhel Hospital Solar power project was supported by Government of Nepal through Alternative Energy Promotion Center and was inaugurated on 6th December 2018. The solar power used in this hospital also feedbacks the excessive power generated by the solar to the national grid. The total installed capacity is 275 KW where four solar arrays are used. The number of battery banks used are four with total capacity of 984KWh. The detail of installed solar panels are shown by Table and Table. From Table we can see that there are four sites of solar panels installed which were installed in two phases. 63KW solar panel is installed at the main building, 102KW at skill lab, 60 KW again at the main building and 50KW at the administrative building.
- 15. Electric Power Supply Survey Report for Building Trauma and Emergency Medical Center at Dhulikhel Hospital in Nepal Submitted By : Inclusive Consultants Pvt. Ltd 14 Table 6 Details of Solar installed No. of Solar Arrays 4 Total Installed Solar Capacity 275 KW No. of Battery Banks 4 Installed Battery Capacity 984 KWh Output Voltage 230 V Battery Rating 10OPzV1000, 2V1000Ah/10hr Table 7 Size of solar panels used. B1 B2 B3 B4 Power (kwp) 63 102 60 50 Capacity (kwhr) 240 240 252 252 Inverter Size (kw) 60 120 175 60 Coverage Area Main Building, ICU, PICU, NRCU, Ward, Admin Office, Dean Office Dental, Blue Hostel, Canteen, Women Center, Epp OT-6, All Conference Hall, Communication Maternity Ward, Forensic 5.2 Record of Power Failure Power supply failure to the hospital premises can classified into three main reasons: System failure, tripping and forced outages. System failure outages, here are classified as those conditions when the utility substation at Banepa (66/11 kv substation) does not have the electricity supply. This may be due to- no supply from the grid, inhouse problem, maintenance shutdown etc. During system outage, none of the 11 kv feeders have the electricity supply. Tripping outages are classified as those outages caused when fault occurs in the dedicated 11 kv line from substation to the hospital. Tripping faults generally occur due to Earth faults and Over current Fault. Forced outages are those outages which are pre-planned and implemented when maintenance work is to be carried on the line. The following graph and chart show the outage detail of dhulikhel hospital.
- 16. Electric Power Supply Survey Report for Building Trauma and Emergency Medical Center at Dhulikhel Hospital in Nepal Submitted By : Inclusive Consultants Pvt. Ltd 15 Figure 5-2 Monthly Outage Duration From the graph above, it is observed that the longest duration of outage occurred in the month of Asar (June 15 to July 15 2020) i.e. 6 hrs 6 mins. Most of the outage was due to shut down for pre-scheduled maintenance. After the pre-schedule maintenance in the month of Asar, we can see that the outage due to line tripping has significantly reduced. In the month of Mangsir (November 16 to December15), no outages were recorded. Figure 5-3 Yearly Power Outage Frequency We can observe from the above figure 5.3, that most frequency of power outages occurred in the month of Poush (Dec 16, 2020 to Jan 13 2021) i.e. 13. And no outage was recoded in Mangsir ((November 16 to December15). Baishak h Jestha Asar Shrawa n Bhadra Ashoj Kartik Mangsi r Poush Magh Falgun Chaitra Shutdown 1.33 1.13 5.98 0 0 0 0 0 0 0 0.6 0 Tripping 0.25 0.08 0.08 0.08 0 0 0 0 0 0 0 0 System Outage 1.05 0.28 0.03 0.38 0.08 0.12 0.15 0 1.47 0.03 0.45 2.4 0 1 2 3 4 5 6 7 Duration in Hrs Month (acc. to Nepalese Calendar) Yearly Outgae Duration ( April 13 2020 to April 13 2021) System Outage Tripping Shutdown Baishak h Jestha Asar Shrawa n Bhadra Ashoj Kartik Mangsi r Poush Magh Falgun Chaitra Shutdown 1 2 1 0 0 0 0 0 0 0 1 0 Tripping 3 1 1 1 0 0 0 0 0 0 0 0 System Outage 7 4 1 5 2 1 1 0 13 1 3 2 0 2 4 6 8 10 12 14 Yearly Power Outage Frequency (April 13 2020 to April 13 2021) System Outage Tripping Shutdown
- 17. Electric Power Supply Survey Report for Building Trauma and Emergency Medical Center at Dhulikhel Hospital in Nepal Submitted By : Inclusive Consultants Pvt. Ltd 16 Figure 5-4 Yearly Power outage frequency of Dhulikhel Hospital We can see from Figure 5.4, that system outage covered a major % of the outage frequency perceived at Dhulikhel Hospital in the time April 13 2020 to April 13 2021. 40 outages out of total yearly 52 outages was caused due to system outage, while there were total of 5 shutdowns (for scheduled maintenance) and 7 tripping outages. Figure 5-5 Yearly duration of power outage of Dhulikhel Hospital In the figure 5.5, we can see that out of yearly total outage duration of 16 hrs 5 mins, outage of 9 hrs 3 mins was due to pre-scheduled shutdown, outage of 6 hrs 27 mins was due to System Outage and outage of 35 mins was due to tripping. 77% 2% 11% 10% Frequency of Power Failure System Outage Tripping (O/C Fault) Tripping (E/F Fault) ShuntDown 6.45 0.08 0.5 9.05 System Outage Tripping (O/C Fault) Tripping (E/F Fault) ShutDown 0 1 2 3 4 5 6 7 8 9 10 Types of Outage Duration in hrs Power Failure Duration (April 13 2020 to April 13 2021)
- 18. Electric Power Supply Survey Report for Building Trauma and Emergency Medical Center at Dhulikhel Hospital in Nepal Submitted By : Inclusive Consultants Pvt. Ltd 17 Seasonal Outage Analysis From the graphs above and with the interaction with utility personnel, we conclude that the most of the frequency of unplanned outage perceived at the hospital is due to the system outage. This implies that the feeder line from utility to the hospital is highly reliable compared to another public feeder fed from the substation. The outage detail of one public feeder is also shown in Annex (for comparison with Dhulikhel Hospital feeder). The frequency of system outage occurred most in the month of Poush (Dec 16 2020 to Jan 13 2021) ie. 13 times. According to the utility officials, the electricity generation of overall National grid highly depends upon hydropower plants and during the month of Poush (Dec 16 2020 to Jan 13 ), the water level in the rivers decreases resulting in lower generation of electricity. Also, the in the month of Poush (Dec 16 2020 to Jan 13), the country experienced the peak winter which increased the overall demand for electricity with increase in heating loads. The imbalance in the overall supply-demand created frequent system outage. While, imbalance in overall supply-demand is one of the cause of system outage, it was also affected by high windy conditions and rainfall during Falgun to Jestha period (early March to late July). 5.3 Measurements at Site Measurement of electrical parameters were done at the HV side and LV side of the transformer. The measurement of electrical parameters at the HV was done at the point of utility metering. This reflects the actual quality of electricity supplied from the utility to the whole facility at the hospital. The measurement at the LV side was done at the secondary side of the transformer. This reflects the combined effect of automatic voltage regulator with grid supplied electricity. The electrical parameters of both measuring points are analysed below: 5.3.1 HV side analysis The electrical data of one month (April 12 to May 13) is acquired. The following HV side analysis solely reflects the status of electricity received from the grid.
- 19. Electric Power Supply Survey Report for Building Trauma and Emergency Medical Center at Dhulikhel Hospital in Nepal Submitted By : Inclusive Consultants Pvt. Ltd 18 5.3.1.1 Power Consumption from Grid Figure 5-6 Daily Variation of Load Figure 5.6 shows two graph one for the daily maximum load variation and other for daily average load variation for one month. We can see that the average load for the month is around 200KW and average maximum load is around 310KW. From here we can find out the average Load Factor for this month which is the ratio of average load to maximum load. The value of Load factor is found to be 0.63. 5.3.1.2 Energy Consumption from the Grid The daily energy consumption over a month is shown in following Figure 2. The maximum energy is found to be consumed in 4th of May which is 5915 KWh, whereas the minimum energy consumed is found to be in 24th April which is 3578 KWh. The total energy consumed over this time is 158269 KWh. Figure 5-7 Daily Energy Variation 0 50 100 150 200 250 300 350 400 450 12-Apr 13-Apr 14-Apr 15-Apr 16-Apr 17-Apr 18-Apr 19-Apr 20-Apr 21-Apr 22-Apr 23-Apr 24-Apr 25-Apr 26-Apr 27-Apr 28-Apr 29-Apr 30-Apr 01-May 02-May 03-May 04-May 05-May 06-May 07-May 08-May 09-May 10-May 11-May 12-May 13-May Daily Load Variation Daily Maximum Load(KW) Daily Average Load(KW) 0 1000 2000 3000 4000 5000 6000 7000 12-Apr 13-Apr 14-Apr 15-Apr 16-Apr 17-Apr 18-Apr 19-Apr 20-Apr 21-Apr 22-Apr 23-Apr 24-Apr 25-Apr 26-Apr 27-Apr 28-Apr 29-Apr 30-Apr 01-May 02-May 03-May 04-May 05-May 06-May 07-May 08-May 09-May 10-May 11-May 12-May 13-May Daily Energy Consumption
- 20. Electric Power Supply Survey Report for Building Trauma and Emergency Medical Center at Dhulikhel Hospital in Nepal Submitted By : Inclusive Consultants Pvt. Ltd 19 5.3.1.3 Power Factor Variation: Figure 3 shows the daily average power factor variation over a month. Maximum daily average power factor of 0.95 is seen on 21st April and minimum daily average power factor of 0.86 is seen on 24th April. From here we can conclude that the daily average power factor has not crossed the limit of 0.8. However, it is recommended to use power factor correction method to achieve power factor close to unity. Figure 5-8 Daily Power Factor Variation Figure 5-9 Hourly Power Factor Variation Figure 5.8 shows hourly variation of PF of four days each from one week. Here, the graph for 12th April, 19th April and 5th May is shown in above figure. We can see that the power factor tends to lower slightly around 8 am in the morning and recovers as the day ends. Although, generally power factor has not dropped beyond the limit (i.e. 0.8), we can see the p.f. dropped beyond 0.8 at 12:00 pm on 26th April. So, we must also prepare for such events where the p.f 0.82 0.84 0.86 0.88 0.9 0.92 0.94 0.96 0.98 12-Apr 13-Apr 14-Apr 15-Apr 16-Apr 17-Apr 18-Apr 19-Apr 20-Apr 21-Apr 22-Apr 23-Apr 24-Apr 25-Apr 26-Apr 27-Apr 28-Apr 29-Apr 30-Apr 01-May 02-May 03-May 04-May 05-May 06-May 07-May 08-May 09-May 10-May 11-May 12-May 13-May 14-May Average PF Variation Daily Average PF 0.7 0.75 0.8 0.85 0.9 0.95 1 1.05 Hourly Power Factor Variation 12th April 19th April 26th April 5th May
- 21. Electric Power Supply Survey Report for Building Trauma and Emergency Medical Center at Dhulikhel Hospital in Nepal Submitted By : Inclusive Consultants Pvt. Ltd 20 may drop beyond the acceptable limits. Hourly pf variations from 25th April to May 1st are shown below. Figure 5-10 Hourly p.f. Variation on April 25 Figure 5-11 Hourly p.f. Variation on April 26 Figure 5-12 Hourly p.f. Variation on April 27 0.75 0.8 0.85 0.9 0.95 1 Hourly Power factor variation of April 25th PF 0.75 0.8 0.85 0.9 0.95 1 Hourly Power factor variation of April 26th PF 0.75 0.8 0.85 0.9 0.95 1 Hourly Power factor variation of April 27th PF
- 22. Electric Power Supply Survey Report for Building Trauma and Emergency Medical Center at Dhulikhel Hospital in Nepal Submitted By : Inclusive Consultants Pvt. Ltd 21 Figure 5-13 Hourly p.f. Variation on April 28 Figure 5-14 Hourly p.f. Variation on April 29 Figure 5-15 Hourly p.f. Variation on April 30 0.82 0.84 0.86 0.88 0.9 0.92 0.94 0.96 0.98 1 Hourly Power factor variation of April 28th PF 0.86 0.88 0.9 0.92 0.94 0.96 0.98 1 Hourly Power factor variation of April 29th PF 0.86 0.88 0.9 0.92 0.94 0.96 0.98 1 Hourly Power factor variation of April 30th PF
- 23. Electric Power Supply Survey Report for Building Trauma and Emergency Medical Center at Dhulikhel Hospital in Nepal Submitted By : Inclusive Consultants Pvt. Ltd 22 Figure 5-16 Hourly p.f. Variation on May 1 5.3.1.4 Grid Voltage level: The hourly voltage level variation of the grid is noted for one month. Here Figure 5.10 to 5.16 shows the hourly variation of voltage for seven days i.e. April 12, April 19, April 23, April 29, May 2 , May 7 and May 13. We can see that the variation of voltage level is within the limit i.e ±10%. Figure 5-107 Hourly Voltage variation of April 12th Figure 5-118 Hourly Voltage variation of April 19th 0.84 0.86 0.88 0.9 0.92 0.94 0.96 0.98 1 Hourly Power factor variation of May 1st PF 10000 10200 10400 10600 10800 11000 11200 11400 Hourly Voltage variation of April 12th Phase a Phase b Phase c 9500 10000 10500 11000 11500 12000 Hourly Voltage variation of April 19th Phase a Phase b Phase c
- 24. Electric Power Supply Survey Report for Building Trauma and Emergency Medical Center at Dhulikhel Hospital in Nepal Submitted By : Inclusive Consultants Pvt. Ltd 23 Figure 5-129 Hourly Voltage variation of April 23rd Figure 5-2013 Hourly Voltage variation of April 29th Figure 5-2114 Hourly Voltage variation of May 2nd 9800 10000 10200 10400 10600 10800 11000 11200 11400 Hourly Voltage variation of April 23rd Phase a Phase b Phase c 9400 9600 9800 10000 10200 10400 10600 10800 11000 11200 11400 Hourly Voltage variation of April 29th Phase a Phase b Phase c 9200 9400 9600 9800 10000 10200 10400 10600 10800 11000 11200 11400 Hourly Voltage variation of May 2nd Phase a Phase b Phase c
- 25. Electric Power Supply Survey Report for Building Trauma and Emergency Medical Center at Dhulikhel Hospital in Nepal Submitted By : Inclusive Consultants Pvt. Ltd 24 Figure 5-22 Hourly Voltage variation of May 7th Figure 5-23 Hourly Voltage variation of May 13th From the above seven graph we can see that there is hourly fluctuation of voltage and the voltage level goes below 11KV at around morning time, stays there for certain number of hours and the voltage level rises above 11KV as the day ends. This pattern is noted and the time at which voltage level goes below 11KV is noted as Low voltage start time and the time at which voltage level goes above 11KV is noted as Low voltage clear time. Figure 5-2415 Hourly Voltage level analysis of April 12 9600 9800 10000 10200 10400 10600 10800 11000 11200 11400 11600 Hourly Voltage variation of May 7th Phase a Phase b Phase c 9800 10000 10200 10400 10600 10800 11000 11200 11400 11600 Hourly Voltage variation of May 13th Phase a Phase b Phase c 0 1 Voltage below Rated (Low- start and Cleared Time) Voltage Low start and Cleared Time
- 26. Electric Power Supply Survey Report for Building Trauma and Emergency Medical Center at Dhulikhel Hospital in Nepal Submitted By : Inclusive Consultants Pvt. Ltd 25 Figure 5.17 shows the variation of voltage to show the low voltage start time and low voltage cleared time of 12th April. Here, in this graph, 1 means that the value of voltage is above 11KV and 0 means that the value of voltage is below 11KV, which denotes that the voltage is lower than the rated voltage. From Figure 5.8 we can see that the low voltage start time is 5:30 AM and this low voltage is cleared at 7:30 PM. Hence, for each day the low voltage start time is noted and the frequency (here number of days) at which this low voltage starts is shown in Figure 5.18. Low voltage start time for each day from 12th April to 12th May is noted and it is seen that the voltage starts to move below the rated for most of the days in 5:30AM and 6:00AM. Figure 5-25 Low Voltage start time frequency Similarly, for each day the low voltage cleared time is noted and the frequency (here number of days) at which this low voltage is cleared is shown in Figure 5.19. Low voltage cleared time for each day from 12th April to 12th May is noted and it is seen that the Low voltage is cleared for most of the days occurs in 8:00PM. Figure 5-26 Low Voltage cleared time frequency 0 1 2 3 4 5 6 7 8 4:30AM 5:00AM 5:30AM 6:00AM 6:30AM Low Voltage starting Time vs Number of Days Days 0 1 2 3 4 5 6 7 8 7:00 PM 7:30 PM 8:00 PM 8:30 PM 9:00 PM Low Voltage Clearing Time vs Number of Days Days
- 27. Electric Power Supply Survey Report for Building Trauma and Emergency Medical Center at Dhulikhel Hospital in Nepal Submitted By : Inclusive Consultants Pvt. Ltd 26 5.3.1.5 Frequency variation: The hourly variation of frequency for one week (from April 25 to May 1) is shown by Figure 5.20. We can see that the frequency goes up to maximum value of 50.2 Hz and minimum value of 49.8 Hz which is within the tolerance level i.e., ± 2.5% of 50 Hz. Figure 5-27 Frequency variation over a week period 5.3.2 LV Side analysis 5.3.2.1 Voltage Analysis The voltage level must be analysis to find whether it is within the limit according to the guidelines of NEA. Tolerance level of ± 10% to the rated value is considerable. Here, Figure 5.21 shows the hourly variation of voltage for a single day i.e June 2nd on secondary side. We can see that the voltage variation is within the limit (i.e ± 10% of 230V). Similarly, the variation of voltage for June 3rd to June 6th is shown by Figure 5.22 to 5.25 respectively. We can see that in these figures to. The variation is within the limit. 49.6 49.7 49.8 49.9 50 50.1 50.2 50.3 Frequency variation for a week period Apr-25 Apr-26 Apr-27 Apr-28 Apr-29 Apr-30 May-01
- 28. Electric Power Supply Survey Report for Building Trauma and Emergency Medical Center at Dhulikhel Hospital in Nepal Submitted By : Inclusive Consultants Pvt. Ltd 27 Figure 5-168 Hourly Variation of Voltage level of June 2nd Figure 5-179 Hourly Variation of Voltage level of June 3rd Figure 5-30 Hourly Variation of Voltage level of June 4th 220 225 230 235 240 245 250 Hourly Voltage variation of June 2nd R S T 220 225 230 235 240 245 250 Hourly Voltage variation of June 3rd R S T 220 225 230 235 240 245 Hourly Voltage variation of June 4th R S T
- 29. Electric Power Supply Survey Report for Building Trauma and Emergency Medical Center at Dhulikhel Hospital in Nepal Submitted By : Inclusive Consultants Pvt. Ltd 28 Figure 5-31 Hourly Variation of Voltage level of June 5th Figure 5-32 Hourly Variation of Voltage level of June 6th 5.3.2.2 Frequency Analysis The frequency changes with the change in load and should be monitored whether it is within the limit. The tolerance level for frequency variation is ±2.5% of the rated value i.e 50Hz according to NEA. Here, the hourly variation of frequency on June 2nd is shown by Figure 5.26 and we can see that the variation is within the limit. The largest variation of frequency from the rated frequency (50Hz) is noted for a particular day for a week period and plotted in Figure 5.27. Here we can see that the deviation of frequency is within the limit for this week period. 220 225 230 235 240 245 250 Hourly Voltage variation of June 5th R S T 210 215 220 225 230 235 240 245 250 Hourly Voltage variation of June 6th R S T
- 30. Electric Power Supply Survey Report for Building Trauma and Emergency Medical Center at Dhulikhel Hospital in Nepal Submitted By : Inclusive Consultants Pvt. Ltd 29 Figure 5-33 Hourly Frequency variation on June 2nd Figure 5-34 Frequency variation over a week period 5.3.3 11 kv Line Loss Table 5. 1 11 kv Line Loss Energy in Kwh Substation Meter (Sending End) Meter at Hospital (Receiving End) Apr-14 18869 kwh 8480341 kwh May-14 19021 kwh 8631635 kwh Total Units 152000 151294 Difference 706 kwh Line Loss 0.46% Table 5.1 shows the monthly loss of the 2 km, 11 kv line from substation to the hospital for the period April 14 2021 to May 14 2021. It is also referred as the technical loss for the line which is below 1% 5.4 Supply points for electricity supply from utility at the new site 49.7 49.8 49.9 50 50.1 50.2 Hourly Frequency variation on June 2nd Frequency 49.55 49.6 49.65 49.7 49.75 49.8 49.85 49.9 49.95 50 01-Jun 02-Jun 03-Jun 04-Jun 05-Jun 06-Jun 07-Jun Average daily Frequency during one week period Frequency
- 31. Electric Power Supply Survey Report for Building Trauma and Emergency Medical Center at Dhulikhel Hospital in Nepal Submitted By : Inclusive Consultants Pvt. Ltd 30 The inspection of possible point of connection from utility for electricity supply at the site was done. There were two main probable points for interconnection. Further things are discussed below. Selection of Supply voltage level Before applying for the new connection from the utility it is necessary to identify the voltage level required. The voltage level of electricity supply depends upon the total power required for the facility. Utility (NEA) has classified the voltage level for required power as follows: Table 8 Classification of Voltage level as per required load Phase Load Power Facility Meter/Metering Type (meters provided by utility) Single Phase Supply Less than 30 Ampere Single Phase 230 V Single Phase Three Phase Supply Up to 25 KVA Three phase 400 V supply from Utility provided Transformer Three Phase Meter with flat demand Charge From 25 to 50 KVA Three phase 400 V supply from Utility provided Transformer CT Operated Three Phase Meter with Demand Meter From 50 to 200 KVA 11 kv Supply- Consumer needs to install private Transformer LV side metering- Time of Day Meter Above 200 KVA 11 kv Supply- Consumer needs to install private Transformer HV Side Metering- Time of Day Meter Above 3000 KVA 11 kv Supply- Consumer needs to install private Transformer HV Side Metering- Time of Day Meter- Grid Impact Study required Above 5000 KVA 11 kv Supply- Consumer needs to install private Transformer HV Side Metering- Time of Day Meter- Grid Impact Study required- Two Meters (Main & Check Meter) required
- 32. Electric Power Supply Survey Report for Building Trauma and Emergency Medical Center at Dhulikhel Hospital in Nepal Submitted By : Inclusive Consultants Pvt. Ltd 31 Hence, the requirement of load power at the site is significant for the type of supply and metering facility to be installed. We have identified two main supply connection points; these both points are able to handle suitable for any of the facility required as mentioned in the Table 8. (However, for the load power of above 2000 KVA, upgradation of existing line is recommended). The two identified supply points are 1) Tapping Point 1 This supply point lies just at the road adjacent with the facility site. Both 11 kV and 400 V supply can be accessed from here. 2) Tapping Point 2 This supply point is the existing electricity supply system supplying the hospital. Further comparison on these two tapping points are discussed below in the Table 9. Table 9 Comparison of tapping points Details Tapping Point 1 Tapping Point 2 11 kV Supply Available Available 400 V Supply Available Available Distance from the site 10 meters 200 meters Feeder Bhakunde feeder Dhulikhel Hospital Feeder Pros Nearest to the site Dedicated feeder- direct supply from substation to hospital only No right of way issue Less Frequency of outage- Reliable Supply Less cost of construction Higher Power Quality relatively short administrative process at utility for supply connection approvement Regular supervision and timely maintenance of feeder by hospital management Feeder maintance done by utility - Public Feeder about 200 meters from the site more frequency power outage- Less reliable right of way may be an issue
- 33. Electric Power Supply Survey Report for Building Trauma and Emergency Medical Center at Dhulikhel Hospital in Nepal Submitted By : Inclusive Consultants Pvt. Ltd 32 Cons Less power quality Higher Cost of Construction Feeder is long and extends to rural areas relatively long administrative process at utility for supply connection approvement due to dedicated feeder Untimely maintenance by utility - Yearly outage frequency and duration comparison between two supply feeders Figure 5-35 Comparison of yearly Outage Hrs Figure 5-36 Comparison of yearly outage frequency Technically, it is recommended to use the tapping no 2 option for electricity supply due to higher reliability and quality of the dedicated hospital feeder. 5.5 Interaction with utility 6.45 0.5 9.05 6.45 42.83 227.7 0 50 100 150 200 250 System Outage Tripping Shutdown Outage Hours Dhulikhel Hospital Bhakunde 40 6 5 40 439 197 0 50 100 150 200 250 300 350 400 450 500 System Outage Tripping Shutdown Outage frequency Dhulikhel Hospital Bhakunde
- 34. Electric Power Supply Survey Report for Building Trauma and Emergency Medical Center at Dhulikhel Hospital in Nepal Submitted By : Inclusive Consultants Pvt. Ltd 33 Nepal Electricity Authority is the sole electricity utility which is responsible for distribution and consumer services of electricity. Kavre Distribution Center, local utility branch under Distribution and Consumer Services Directorate of NEA, is the immediate concern office related to electricity utility services for Dhulikhel Hospital. Dhulikhel Hospital receives power from the Banepa 66/11 kv Substation. Banepa Substation is an entity of Kathmandu Grid Department Under Transmission Directorate. Though, Kavre Distribution Center and Banepa 66/11 kv Substation are under different Directorate, it is seen that the operations of 11 kv Dhulikhel Hospital is more directed by Kavre Distribution centre while the Grid department has more role in operating the 66 kv side. All Utility services like billing, maintenance, shutdown, records, revenue etc are provided by Kavre Distribution Center. According to Er. Toyanath Regmi, incharge of technical department of Kavre Distribution Center, Dhulikhel Hospital 11 kv feeder is the most reliable feeder within the substation. The frequency and duration of outages are the lowest for Dhulikhel Hospital Feeder in comparison to other 11 kv Feeders. Also, the maintenance of Dhulikhel Hospital feeder is relatively easy. Due to its short line length, fault diagnosis time is low and shortest feeder in terms of line length and due to its easy accessibility- the line route lies along an accessible road. Any maintenance problems related to distribution lines are solved by the Kavre Distribution Center. Outages related to earth faults and over current fault are the main causes of line tripping. These types of faults need prompt maintenance. Also, scheduled maintenance, pre-planned feeder shutdown is done by utility or upon request of Dhulikhel Hospital. While these outages are under the scope of the Kavre Distribution Centre, outages related to 66 kv grid line are under Kathmandu Grid Department. Grid line system outages occur due to national grid failure, partial grid failure, 66-kv transmission line fault or scheduled maintenance. The occurrence of Grid System line outage are low but it has a significant part in total outages perceived at the Hospital due to low 11 kv outages. Also, recent replacement of bare ACSR conductor with XLPE Insulated Conductor at the feeder section with trees (responsible for frequent tripping), has significantly reduced outages due to tripping. 6. Conclusion and Recommendations. The current status of electricity supply from the grid to the hospital is well above satisfactory in comparison with supply from other public feeder. The dedicated feeder provides with the better reliability in electricity supply to the hospital. The approved load of the hospital is 1430 KVA, but the maximum power consumption from the grid during the one-month period (April 12 to May 13) was seen to be 404 kW (~435 KVA with 0.93 p.f) on April 22. This suggests that the hospital facility is only utilising around 31% of the approved load at peak load during the measurement period. Investigating the records at the utility side showed that the highest peak demand consumed by the hospital in last 5 years was about 663 KVA in the billing month of Falgun in 2076 (2nd
- 35. Electric Power Supply Survey Report for Building Trauma and Emergency Medical Center at Dhulikhel Hospital in Nepal Submitted By : Inclusive Consultants Pvt. Ltd 34 February 2020 to 1st March 2020). This implies that the maximum load consumed at the hospital till date is about 46% of the approved load. Therefore, the demand of the hospital can still be increased by about 100 % of without the need to increase the approved power at the utility side. Also, the 275 kw solar power system installed at hospital has reduced the power need to be received from the grid. The voltage received from the grid start to fall below the rated voltage level of 11 kv in the morning and rises up to 11 kv as the day ends. The voltage level dropped below the tolerance level of 5% on several occasions. But the automatic Voltage Regulator installed at the in series with the transformer regulated the voltage in secondary side. So, it is recommended to install Automatic Voltage regulator in series with the transformer at the new site. Regarding the frequency of the electricity supply, the variation in frequency was within the limit of 2.5%. So, frequency variation may not be an issue if the supply is extended from the dhulikhel hospital feeder. Although the power factor was within the rated value of 0.8. It is always recommended to maintain the power factor value close to 1. So, installing devices like Automatic power factor correction (APFC) at the LV side will be a better option. For the electricity supply line route to the new site, two different option was studied; one- feeder used by dhulikhel hospital currently and another- public feeder located near to the new site. On technical grounds, it is highly recommended to extend the supply from the hospital feeder since the outage duration and frequency is relatively very low in dedicated hospital feeder than the public feeder. The major part of the outage duration and frequency perceived at the hospital is due to the system outage. During the system outage, there is no supply in any of the 11 kv feeders originating from the Banepa Substation. Problems relating to system outages are dealt by Kathmandu Grid Division Office, so, the local utility has no direct control and responsibility in reducing the system outage. However, the frequency and duration of tripping outages and pre-scheduled maintenance shutdown, which are under the control and responsibility of local utility are relatively low. The minimum hosting capacity of 11 kv line from substation to the hospital feeder is approximated to be around 2500 kW.
- 36. Electric Power Supply Survey Report for Building Trauma and Emergency Medical Center at Dhulikhel Hospital in Nepal Submitted By : Inclusive Consultants Pvt. Ltd 35 7. Annexes
- 37. Electric Power Supply Survey Report for Building Trauma and Emergency Medical Center at Dhulikhel Hospital in Nepal Submitted By : Inclusive Consultants Pvt. Ltd 36 Annex 1: Site Visit Photographs Figure A. 1 Local Utility Office with Technical Department Head Figure A. 2 Interacting with the Utility Substation Staffs
- 38. Electric Power Supply Survey Report for Building Trauma and Emergency Medical Center at Dhulikhel Hospital in Nepal Submitted By : Inclusive Consultants Pvt. Ltd 37 Figure A. 4 Existing Line Route- XLPE Cable start section Figure A. 3 Utility Meter at site Figure A. 5 Existing Line Route to Hospital
- 39. Electric Power Supply Survey Report for Building Trauma and Emergency Medical Center at Dhulikhel Hospital in Nepal Submitted By : Inclusive Consultants Pvt. Ltd 38 Figure A. 9 Utility Substation Power Transformer Figure A. 8 Grid Receiving Point at Hospital Figure A. 7 500 KVA Transformer Figure A. 6 Automatic Voltage Regulator in series with 500 KVA Transformer
- 40. Electric Power Supply Survey Report for Building Trauma and Emergency Medical Center at Dhulikhel Hospital in Nepal Submitted By : Inclusive Consultants Pvt. Ltd 39 Figure A. 13 Nameplate of 630 KVA Transformer Figure A. 10 Nameplate of AVR Figure A. 12 200 KVA Transformer with Distribution Box Figure A. 11 Distribution Panel
- 41. Electric Power Supply Survey Report for Building Trauma and Emergency Medical Center at Dhulikhel Hospital in Nepal Submitted By : Inclusive Consultants Pvt. Ltd 40 Figure A. 15 Generator 3 (100 KVA) Figure A. 14 Changeover 200 Amp Figure A. 17 Generator 1 & 2 Figure A. 16 Generator 4
- 42. Electric Power Supply Survey Report for Building Trauma and Emergency Medical Center at Dhulikhel Hospital in Nepal Submitted By : Inclusive Consultants Pvt. Ltd 41 Figure A. 19 Solar Array Figure A. 18 Grid Tie Solar Monitoring System
- 43. Electric Power Supply Survey Report for Building Trauma and Emergency Medical Center at Dhulikhel Hospital in Nepal Submitted By : Inclusive Consultants Pvt. Ltd 42 Figure A. 22 Battery Bank Figure A. 20 Solar Inverter and Control System Figure A. 21 For line route at new site from Bhakunde feeder
- 44. Electric Power Supply Survey Report for Building Trauma and Emergency Medical Center at Dhulikhel Hospital in Nepal Submitted By : Inclusive Consultants Pvt. Ltd 43 Annex 2: Electrical Power Supply Survey Data Annex 3: Electrical Power Supply Drawing Annex 4: Power Connection from Dhulikhel Hospital Dedicated Feeder to Trauma Center Annex 5: Time of Day Power Consumption from Grid (April 25th to May 1st) Annex 6: Technical Specification for Solar Net Metering System
- 45. Electric Power Supply Survey Report for Building Trauma and Emergency Medical Center at Dhulikhel Hospital in Nepal Submitted By : Inclusive Consultants Pvt. Ltd 1 Annex 2: Load Profile Data Load Profile Data from 9th April 2021 to 13th May 2021
- 46. Load Profile Data from 9th April 2021 to 13th May 2021 S.No. Date- Time Voltage-A (Volts) Voltage-B (Volts) Voltage-C (Volts) Current-A (Amp) Current-B (Amp) Current-C (Amp) PF- A PF-B PF-C PF- Avg Energy (kwh) 1 14-05-2021 00:30:00 11244 11229 11341 10 9 10 0.92 0.922 0.95 0.932 8631725 2 14-05-2021 00:00:00 11239 11220 11334 10 9 9 0.913 0.907 0.943 0.922 8631635 3 13-05-2021 23:30:00 11229 11201 11312 9 8 8 0.923 0.905 0.945 0.926 8631543 4 13-05-2021 23:00:00 11215 11180 11306 10 9 10 0.907 0.908 0.939 0.919 8631454 5 13-05-2021 22:30:00 11343 11298 11424 11 10 11 0.905 0.922 0.942 0.924 8631355 6 13-05-2021 22:00:00 11227 11170 11313 11 10 11 0.921 0.925 0.939 0.929 8631258 7 13-05-2021 21:30:00 11140 11057 11218 17 15 16 0.961 0.954 0.972 0.961 8631133 8 13-05-2021 21:00:00 11074 10960 11130 15 13 14 0.958 0.94 0.978 0.959 8631014 9 13-05-2021 20:30:00 11047 10899 11090 11 10 11 0.913 0.929 0.961 0.936 8630884 10 13-05-2021 20:00:00 10898 10712 10922 13 11 13 0.947 0.957 0.973 0.959 8630763 11 13-05-2021 19:30:00 10686 10496 10716 15 13 15 0.948 0.965 0.986 0.967 8630645 12 13-05-2021 19:00:00 10615 10404 10634 14 11 15 0.929 0.972 0.986 0.968 8630517 13 13-05-2021 18:30:00 10666 10491 10688 13 12 13 0.954 0.966 0.976 0.964 8630394 14 13-05-2021 18:00:00 10818 10709 10894 14 13 13 0.951 0.94 0.971 0.955 8630271 15 13-05-2021 17:30:00 10835 10704 10891 13 12 14 0.92 0.971 0.961 0.953 8630144 16 13-05-2021 17:00:00 10666 10565 10714 14 13 14 0.937 0.945 0.967 0.95 8630007 17 13-05-2021 16:30:00 10917 10823 10995 12 10 12 0.884 0.919 0.938 0.915 8629897 18 13-05-2021 16:00:00 10884 10792 10912 11 10 10 0.843 0.857 0.888 0.863 8629791 19 13-05-2021 15:30:00 10877 10783 10917 16 13 16 0.925 0.958 0.975 0.954 8629678 20 13-05-2021 15:00:00 10880 10770 10919 13 12 13 0.912 0.919 0.946 0.926 8629579 21 13-05-2021 14:30:00 10808 10699 10839 9 8 9 0.808 0.839 0.887 0.847 8629483 22 13-05-2021 14:00:00 10777 10697 10827 15 14 14 0.933 0.926 0.952 0.938 8629369 23 13-05-2021 13:30:00 10794 10716 10854 12 10 11 0.922 0.919 0.96 0.935 8629251 24 13-05-2021 13:00:00 10768 10666 10816 9 8 9 0.825 0.871 0.912 0.872 8629130 25 13-05-2021 12:30:00 10756 10673 10827 12 11 13 0.911 0.939 0.948 0.934 8629034 26 13-05-2021 12:00:00 10780 10700 10854 18 16 18 0.944 0.956 0.971 0.958 8628899 27 13-05-2021 11:30:00 10792 10685 10848 17 15 17 0.935 0.95 0.976 0.954 8628766 28 13-05-2021 11:00:00 10787 10683 10837 17 15 17 0.947 0.972 0.983 0.971 8628633 29 13-05-2021 10:30:00 10728 10621 10792 17 15 17 0.955 0.972 0.988 0.974 8628478 30 13-05-2021 10:00:00 10693 10574 10742 17 15 17 0.936 0.953 0.978 0.957 8628335 31 13-05-2021 09:30:00 10662 10543 10709 14 13 16 0.916 0.973 0.962 0.955 8628178 32 13-05-2021 09:00:00 10631 10503 10667 17 15 17 0.94 0.949 0.972 0.954 8628035 33 13-05-2021 08:30:00 10603 10496 10662 16 15 17 0.92 0.958 0.959 0.946 8627909 34 13-05-2021 08:00:00 10660 10539 10718 16 14 17 0.916 0.955 0.957 0.943 8627774 35 13-05-2021 07:30:00 10560 10456 10631 17 16 17 0.956 0.963 0.975 0.965 8627624 36 13-05-2021 07:00:00 10711 10610 10770 15 14 16 0.939 0.963 0.964 0.957 8627490 37 13-05-2021 06:30:00 10879 10794 10953 16 15 16 0.957 0.949 0.973 0.962 8627341 38 13-05-2021 06:00:00 10950 10894 11064 13 12 13 0.925 0.936 0.944 0.938 8627223 39 13-05-2021 05:30:00 11104 11055 11180 15 14 15 0.951 0.962 0.972 0.961 8627110 40 13-05-2021 05:00:00 11232 11185 11319 12 11 12 0.916 0.926 0.932 0.925 8626993 41 13-05-2021 04:30:00 11268 11248 11381 11 10 11 0.894 0.909 0.914 0.906 8626891 42 13-05-2021 04:00:00 11306 11281 11395 9 9 9 0.906 0.919 0.935 0.92 8626785 43 13-05-2021 03:30:00 11294 11279 11402 10 10 10 0.917 0.934 0.934 0.929 8626690 44 13-05-2021 03:00:00 11268 11270 11388 11 11 11 0.905 0.914 0.917 0.912 8626592
- 47. Load Profile Data from 9th April 2021 to 13th May 2021 45 13-05-2021 02:30:00 11274 11265 11381 12 12 12 0.917 0.905 0.924 0.915 8626495 46 13-05-2021 02:00:00 11272 11265 11383 11 10 11 0.914 0.921 0.943 0.927 8626399 47 13-05-2021 01:30:00 11282 11260 11369 9 9 9 0.906 0.921 0.935 0.921 8626303 48 13-05-2021 01:00:00 11281 11268 11379 10 9 10 0.904 0.911 0.934 0.917 8626206 49 13-05-2021 00:30:00 11293 11281 11400 10 9 10 0.914 0.916 0.937 0.923 8626107 50 13-05-2021 00:00:00 11282 11246 11358 10 10 10 0.945 0.931 0.945 0.941 8626004 51 12-05-2021 23:30:00 11225 11199 11313 13 12 13 0.933 0.928 0.938 0.934 8625901 52 12-05-2021 23:00:00 11223 11204 11320 12 11 12 0.911 0.915 0.935 0.921 8625787 53 12-05-2021 22:30:00 11178 11154 11274 13 12 13 0.929 0.925 0.95 0.936 8625687 54 12-05-2021 22:00:00 11126 11080 11208 16 14 16 0.947 0.965 0.976 0.964 8625565 55 12-05-2021 21:30:00 11055 10988 11138 14 13 13 0.952 0.94 0.971 0.957 8625444 56 12-05-2021 21:00:00 11066 10953 11128 14 12 13 0.932 0.94 0.962 0.945 8625313 57 12-05-2021 20:30:00 10896 10754 10953 15 13 14 0.958 0.965 0.977 0.967 8625189 58 12-05-2021 20:00:00 11003 10832 11022 17 14 16 0.948 0.95 0.975 0.959 8625063 59 12-05-2021 19:30:00 10773 10553 10775 19 16 18 0.957 0.969 0.985 0.971 8624922 60 12-05-2021 19:00:00 10681 10437 10678 17 15 17 0.964 0.969 0.983 0.974 8624775 61 12-05-2021 18:30:00 10589 10418 10629 16 14 15 0.96 0.963 0.986 0.971 8624623 62 12-05-2021 18:00:00 10777 10640 10830 12 11 13 0.923 0.967 0.964 0.953 8624498 63 12-05-2021 17:30:00 10801 10697 10868 14 13 15 0.918 0.956 0.96 0.944 8624363 64 12-05-2021 17:00:00 10771 10680 10839 16 15 17 0.931 0.962 0.954 0.951 8624238 65 12-05-2021 16:30:00 10700 10593 10766 17 15 17 0.941 0.957 0.968 0.957 8624101 66 12-05-2021 16:00:00 10622 10534 10692 15 13 15 0.934 0.955 0.97 0.955 8623986 67 12-05-2021 15:30:00 10660 10544 10704 13 13 14 0.918 0.949 0.939 0.937 8623851 68 12-05-2021 15:00:00 10631 10515 10680 12 11 14 0.899 0.961 0.952 0.94 8623715 69 12-05-2021 14:30:00 10444 10350 10491 15 14 15 0.928 0.956 0.956 0.947 8623590 70 12-05-2021 14:00:00 10584 10499 10671 16 15 16 0.954 0.96 0.968 0.96 8623464 71 12-05-2021 13:30:00 10650 10555 10712 16 16 18 0.933 0.967 0.96 0.954 8623319 72 12-05-2021 13:00:00 10676 10591 10757 14 13 15 0.925 0.949 0.957 0.943 8623170 73 12-05-2021 12:30:00 10669 10563 10737 18 16 18 0.966 0.976 0.982 0.975 8623019 74 12-05-2021 12:00:00 10647 10551 10726 19 17 18 0.972 0.971 0.987 0.979 8622855 75 12-05-2021 11:30:00 10908 10785 10958 15 14 15 0.959 0.973 0.976 0.969 8622715 76 12-05-2021 11:00:00 10747 10634 10808 16 15 18 0.931 0.975 0.975 0.963 8622547 77 12-05-2021 10:30:00 10666 10560 10721 16 15 17 0.953 0.969 0.978 0.968 8622405 78 12-05-2021 10:00:00 10669 10598 10756 10 9 11 0.875 0.928 0.939 0.916 8622303 79 12-05-2021 09:30:00 10492 10366 10551 13 12 14 0.937 0.963 0.976 0.963 8622210 80 12-05-2021 09:00:00 10479 10345 10527 12 10 12 0.873 0.89 0.932 0.9 8622108 81 12-05-2021 08:30:00 10515 10376 10555 9 7 9 0.844 0.878 0.933 0.889 8622018 82 12-05-2021 08:00:00 10638 10515 10692 16 15 18 0.937 0.974 0.971 0.962 8621923 83 12-05-2021 07:30:00 10586 10470 10647 16 14 16 0.944 0.964 0.976 0.963 8621790 84 12-05-2021 07:00:00 10832 10705 10889 12 11 13 0.91 0.941 0.958 0.938 8621681 85 12-05-2021 06:30:00 10969 10856 11029 14 12 14 0.927 0.942 0.969 0.949 8621551 86 12-05-2021 06:00:00 10931 10813 10988 12 11 12 0.921 0.939 0.946 0.936 8621429 87 12-05-2021 05:30:00 11125 11073 11235 14 13 14 0.932 0.945 0.963 0.948 8621308 88 12-05-2021 05:00:00 11144 11097 11222 11 10 11 0.93 0.936 0.94 0.935 8621179 89 12-05-2021 04:30:00 11203 11163 11281 16 15 16 0.94 0.963 0.969 0.957 8621065 90 12-05-2021 04:00:00 11235 11192 11310 12 11 11 0.917 0.913 0.932 0.921 8620949 91 12-05-2021 03:30:00 11253 11210 11329 12 11 12 0.914 0.917 0.931 0.921 8620849 92 12-05-2021 03:00:00 11270 11239 11360 10 10 11 0.91 0.922 0.929 0.92 8620746 93 12-05-2021 02:30:00 11317 11275 11410 11 11 11 0.937 0.921 0.948 0.936 8620646 94 12-05-2021 02:00:00 11293 11232 11341 10 10 10 0.918 0.917 0.938 0.925 8620543
- 48. Load Profile Data from 9th April 2021 to 13th May 2021 95 12-05-2021 01:30:00 11248 11190 11301 11 10 10 0.927 0.913 0.951 0.931 8620440 96 12-05-2021 01:00:00 11230 11182 11293 12 11 11 0.916 0.914 0.951 0.928 8620338 97 12-05-2021 00:30:00 11234 11182 11291 11 11 12 0.918 0.935 0.944 0.933 8620231 98 12-05-2021 00:00:00 11203 11137 11251 12 11 11 0.94 0.932 0.95 0.941 8620116 99 11-05-2021 23:30:00 11163 11099 11220 14 13 13 0.953 0.937 0.965 0.954 8620004 100 11-05-2021 23:00:00 11142 11078 11201 13 13 13 0.942 0.939 0.937 0.938 8619883 101 11-05-2021 22:30:00 11083 10995 11126 11 11 12 0.919 0.933 0.944 0.932 8619767 102 11-05-2021 22:00:00 11022 10962 11102 14 12 14 0.931 0.951 0.971 0.954 8619649 103 11-05-2021 21:30:00 11225 11116 11263 13 12 13 0.904 0.931 0.939 0.927 8619532 104 11-05-2021 21:00:00 11192 11042 11201 12 10 12 0.917 0.948 0.962 0.944 8619414 105 11-05-2021 20:30:00 11100 10920 11114 13 12 13 0.95 0.958 0.976 0.964 8619291 106 11-05-2021 20:00:00 10953 10749 10951 14 12 14 0.925 0.937 0.965 0.945 8619162 107 11-05-2021 19:30:00 10899 10704 10901 17 16 16 0.97 0.966 0.984 0.972 8619029 108 11-05-2021 19:00:00 10773 10576 10780 18 17 18 0.963 0.97 0.983 0.973 8618893 109 11-05-2021 18:30:00 10848 10686 10887 15 13 14 0.961 0.963 0.977 0.967 8618747 110 11-05-2021 18:00:00 10823 10674 10865 16 14 16 0.958 0.967 0.985 0.973 8618623 111 11-05-2021 17:30:00 10908 10792 10953 11 10 12 0.892 0.963 0.957 0.941 8618478 112 11-05-2021 17:00:00 10861 10735 10931 16 15 16 0.943 0.957 0.969 0.956 8618351 113 11-05-2021 16:30:00 10756 10636 10811 15 13 16 0.93 0.969 0.971 0.959 8618230 114 11-05-2021 16:00:00 10754 10628 10801 12 11 13 0.89 0.939 0.938 0.923 8618101 115 11-05-2021 15:30:00 10737 10617 10783 19 18 19 0.95 0.957 0.968 0.958 8617960 116 11-05-2021 15:00:00 10794 10674 10839 14 12 14 0.909 0.945 0.958 0.938 8617833 117 11-05-2021 14:30:00 10828 10714 10867 11 10 12 0.874 0.945 0.945 0.924 8617724 118 11-05-2021 14:00:00 10809 10702 10856 13 12 13 0.937 0.951 0.957 0.949 8617614 119 11-05-2021 13:30:00 10761 10667 10818 16 14 17 0.937 0.966 0.971 0.961 8617470 120 11-05-2021 13:00:00 10766 10664 10827 15 14 15 0.958 0.959 0.978 0.968 8617327 121 11-05-2021 12:30:00 10787 10690 10849 12 11 12 0.907 0.929 0.95 0.93 8617199 122 11-05-2021 12:00:00 10725 10631 10789 13 12 14 0.937 0.969 0.972 0.958 8617071 123 11-05-2021 11:30:00 10676 10569 10730 13 12 13 0.942 0.949 0.973 0.956 8616953 124 11-05-2021 11:00:00 10777 10647 10815 9 8 10 0.806 0.904 0.905 0.875 8616860 125 11-05-2021 10:30:00 10697 10569 10745 13 12 14 0.917 0.952 0.966 0.946 8616766 126 11-05-2021 10:00:00 10648 10520 10693 17 15 19 0.925 0.975 0.977 0.964 8616634 127 11-05-2021 09:30:00 10553 10402 10584 10 10 12 0.887 0.955 0.934 0.927 8616514 128 11-05-2021 09:00:00 10498 10328 10512 16 13 15 0.926 0.95 0.977 0.954 8616401 129 11-05-2021 08:30:00 10529 10397 10589 13 11 13 0.892 0.919 0.946 0.92 8616294 130 11-05-2021 08:00:00 10634 10529 10697 10 8 10 0.823 0.879 0.903 0.87 8616191 131 11-05-2021 07:30:00 10671 10562 10735 12 10 12 0.9 0.936 0.954 0.932 8616090 132 11-05-2021 07:00:00 10730 10629 10809 11 9 12 0.883 0.938 0.961 0.931 8615994 133 11-05-2021 06:30:00 10846 10733 10913 11 10 11 0.922 0.942 0.938 0.935 8615891 134 11-05-2021 06:00:00 10804 10723 10879 10 9 11 0.908 0.96 0.965 0.947 8615780 135 11-05-2021 05:30:00 11026 10932 11107 12 11 12 0.936 0.934 0.947 0.939 8615688 136 11-05-2021 05:00:00 11142 11085 11234 11 10 11 0.926 0.945 0.944 0.938 8615578 137 11-05-2021 04:30:00 11234 11210 11339 14 13 15 0.937 0.955 0.969 0.956 8615472 138 11-05-2021 04:00:00 11306 11279 11402 11 11 11 0.938 0.947 0.946 0.944 8615336 139 11-05-2021 03:30:00 11317 11291 11412 9 8 9 0.893 0.916 0.922 0.911 8615248 140 11-05-2021 03:00:00 11320 11291 11407 9 8 9 0.894 0.92 0.93 0.915 8615161 141 11-05-2021 02:30:00 11310 11287 11405 9 9 10 0.909 0.919 0.924 0.917 8615075 142 11-05-2021 02:00:00 11310 11296 11412 10 9 10 0.907 0.926 0.939 0.925 8614988 143 11-05-2021 01:30:00 11277 11258 11376 10 9 10 0.917 0.926 0.938 0.927 8614899 144 11-05-2021 01:00:00 11274 11255 11369 9 9 10 0.907 0.935 0.937 0.927 8614809
- 49. Load Profile Data from 9th April 2021 to 13th May 2021 145 11-05-2021 00:30:00 11265 11235 11362 10 10 11 0.922 0.939 0.945 0.936 8614718 146 11-05-2021 00:00:00 11227 11192 11310 10 10 10 0.927 0.934 0.951 0.937 8614622 147 10-05-2021 23:30:00 11184 11159 11282 11 10 11 0.94 0.95 0.962 0.951 8614524 148 10-05-2021 23:00:00 11163 11135 11253 10 10 12 0.897 0.961 0.951 0.939 8614419 149 10-05-2021 22:30:00 11154 11116 11239 11 11 11 0.923 0.932 0.94 0.932 8614318 150 10-05-2021 22:00:00 11021 10965 11107 9 8 9 0.914 0.94 0.958 0.939 8614213 151 10-05-2021 21:30:00 10945 10875 11017 12 12 12 0.949 0.954 0.955 0.953 8614106 152 10-05-2021 21:00:00 10860 10759 10925 13 12 13 0.949 0.959 0.971 0.958 8613990 153 10-05-2021 20:30:00 10785 10660 10844 13 12 13 0.943 0.967 0.968 0.963 8613858 154 10-05-2021 20:00:00 10884 10705 10901 15 14 15 0.96 0.957 0.97 0.962 8613732 155 10-05-2021 19:30:00 10785 10593 10801 15 13 14 0.943 0.954 0.978 0.963 8613592 156 10-05-2021 19:00:00 10773 10548 10785 13 11 13 0.922 0.948 0.959 0.944 8613455 157 10-05-2021 18:30:00 10660 10468 10674 14 12 15 0.925 0.97 0.973 0.958 8613324 158 10-05-2021 18:00:00 10775 10634 10808 18 17 19 0.944 0.967 0.971 0.961 8613185 159 10-05-2021 17:30:00 11126 10998 11170 12 11 12 0.888 0.923 0.93 0.914 8613056 160 10-05-2021 17:00:00 10643 10524 10683 15 14 17 0.928 0.967 0.962 0.952 8612931 161 10-05-2021 16:30:00 10660 10543 10699 15 12 14 0.937 0.947 0.979 0.959 8612806 162 10-05-2021 16:00:00 10577 10473 10634 14 13 15 0.921 0.962 0.959 0.948 8612675 163 10-05-2021 15:30:00 10570 10460 10629 14 11 14 0.909 0.933 0.97 0.938 8612545 164 10-05-2021 15:00:00 10652 10546 10709 13 11 13 0.925 0.949 0.962 0.946 8612442 165 10-05-2021 14:30:00 10569 10470 10641 11 11 13 0.907 0.969 0.948 0.944 8612327 166 10-05-2021 14:00:00 10543 10480 10622 7 6 7 0.69 0.754 0.829 0.761 8612215 167 10-05-2021 13:30:00 10548 10439 10570 13 11 13 0.878 0.933 0.945 0.921 8612145 168 10-05-2021 13:00:00 10645 10544 10697 11 10 11 0.861 0.91 0.917 0.897 8612065 169 10-05-2021 12:30:00 10662 10574 10716 14 12 14 0.9 0.945 0.96 0.936 8611956 170 10-05-2021 12:00:00 10622 10518 10659 14 13 15 0.909 0.937 0.944 0.93 8611851 171 10-05-2021 11:30:00 10577 10487 10645 11 9 12 0.825 0.939 0.934 0.905 8611745 172 10-05-2021 11:00:00 10532 10416 10589 14 11 13 0.926 0.945 0.976 0.952 8611637 173 10-05-2021 10:30:00 10543 10427 10586 15 14 15 0.955 0.963 0.968 0.962 8611527 174 10-05-2021 10:00:00 10654 10529 10688 15 13 15 0.937 0.961 0.981 0.961 8611396 175 10-05-2021 09:30:00 10567 10439 10621 18 16 18 0.952 0.964 0.979 0.967 8611264 176 10-05-2021 09:00:00 10458 10297 10486 14 13 14 0.952 0.959 0.968 0.959 8611133 177 10-05-2021 08:30:00 10446 10285 10463 13 11 14 0.905 0.939 0.965 0.939 8611014 178 10-05-2021 08:00:00 10763 10574 10806 12 11 13 0.912 0.946 0.948 0.936 8610887 179 10-05-2021 07:00:00 10681 10555 10744 10 9 10 0.904 0.924 0.955 0.929 8610825 180 10-05-2021 06:30:00 10773 10643 10827 11 10 12 0.913 0.957 0.966 0.947 8610725 181 10-05-2021 06:00:00 10711 10617 10792 11 9 11 0.926 0.958 0.971 0.954 8610630 182 10-05-2021 05:30:00 10872 10804 10938 10 9 9 0.925 0.928 0.944 0.932 8610533 183 10-05-2021 05:00:00 10957 10912 11054 11 9 11 0.889 0.94 0.963 0.934 8610438 184 10-05-2021 04:30:00 11002 10936 11066 12 10 11 0.943 0.934 0.965 0.948 8610334 185 10-05-2021 04:00:00 11057 10984 11113 12 11 12 0.945 0.951 0.96 0.952 8610235 186 10-05-2021 03:30:00 11057 11000 11132 10 9 10 0.91 0.927 0.95 0.93 8610147 187 10-05-2021 03:00:00 11054 10995 11118 9 8 9 0.913 0.929 0.954 0.933 8610060 188 10-05-2021 02:30:00 11119 11067 11190 9 8 9 0.917 0.932 0.958 0.937 8609974 189 10-05-2021 02:00:00 11061 11002 11125 10 8 9 0.913 0.914 0.963 0.932 8609886 190 10-05-2021 01:30:00 10996 10938 11066 9 8 9 0.917 0.921 0.955 0.933 8609801 191 10-05-2021 01:00:00 10957 10889 11017 11 9 10 0.91 0.921 0.951 0.929 8609715 192 10-05-2021 00:30:00 11061 11000 11116 10 9 10 0.92 0.92 0.952 0.932 8609627 193 10-05-2021 00:00:00 10958 10901 11017 10 9 10 0.915 0.94 0.959 0.939 8609539 194 09-05-2021 23:30:00 10965 10908 11022 10 9 10 0.928 0.938 0.954 0.94 8609445
- 50. Load Profile Data from 9th April 2021 to 13th May 2021 195 09-05-2021 23:00:00 10953 10896 11016 13 12 13 0.951 0.959 0.969 0.96 8609351 196 09-05-2021 22:30:00 11040 10993 11133 11 10 11 0.909 0.929 0.944 0.928 8609245 197 09-05-2021 22:00:00 10964 10893 11047 13 11 13 0.931 0.957 0.981 0.96 8609144 198 09-05-2021 21:30:00 11071 10977 11145 15 13 15 0.944 0.956 0.973 0.956 8609038 199 09-05-2021 21:00:00 11009 10879 11064 10 9 10 0.913 0.936 0.956 0.936 8608919 200 09-05-2021 20:30:00 10861 10712 10913 11 9 10 0.915 0.922 0.948 0.929 8608825 201 09-05-2021 20:00:00 10932 10751 10953 15 13 15 0.919 0.958 0.961 0.948 8608710 202 09-05-2021 19:30:00 10799 10586 10801 15 13 15 0.95 0.965 0.983 0.968 8608579 203 09-05-2021 19:00:00 10609 10385 10595 18 15 18 0.957 0.969 0.984 0.972 8608454 204 09-05-2021 18:30:00 10352 10155 10376 13 11 14 0.922 0.977 0.97 0.959 8608318 205 09-05-2021 18:00:00 10548 10411 10600 14 12 15 0.904 0.963 0.968 0.947 8608206 206 09-05-2021 17:30:00 10626 10512 10671 17 16 17 0.938 0.958 0.962 0.952 8608078 207 09-05-2021 17:00:00 10596 10479 10640 12 11 13 0.898 0.947 0.949 0.933 8607965 208 09-05-2021 16:30:00 10602 10496 10664 15 14 15 0.941 0.942 0.958 0.947 8607859 209 09-05-2021 16:00:00 10629 10534 10700 8 7 8 0.858 0.887 0.92 0.89 8607761 210 09-05-2021 15:30:00 10614 10555 10645 16 15 16 0.956 0.959 0.976 0.966 8607650 211 09-05-2021 15:00:00 10577 10517 10600 16 14 16 0.937 0.965 0.975 0.96 8607511 212 09-05-2021 14:30:00 10532 10456 10546 12 11 12 0.922 0.931 0.954 0.937 8607380 213 09-05-2021 14:00:00 10510 10451 10531 15 13 16 0.917 0.965 0.969 0.952 8607247 214 09-05-2021 13:30:00 10482 10418 10498 15 15 16 0.943 0.956 0.957 0.953 8607109 215 09-05-2021 13:00:00 10484 10428 10515 17 15 17 0.951 0.967 0.982 0.967 8606962 216 09-05-2021 12:30:00 10463 10402 10492 11 9 11 0.872 0.895 0.938 0.904 8606842 217 09-05-2021 12:00:00 10605 10562 10647 11 10 11 0.913 0.928 0.962 0.936 8606739 218 09-05-2021 11:30:00 10605 10536 10628 13 9 12 0.855 0.877 0.958 0.903 8606640 219 09-05-2021 11:00:00 10643 10576 10660 7 5 6 0.646 0.683 0.834 0.728 8606575 220 09-05-2021 10:30:00 10641 10574 10664 11 9 12 0.83 0.915 0.931 0.896 8606499 221 09-05-2021 10:00:00 10634 10574 10669 12 10 13 0.871 0.926 0.955 0.921 8606413 222 09-05-2021 09:30:00 10512 10442 10539 10 9 11 0.817 0.886 0.909 0.873 8606341 223 09-05-2021 09:00:00 10541 10473 10558 12 11 12 0.903 0.934 0.952 0.931 8606253 224 09-05-2021 08:30:00 10512 10444 10537 9 8 9 0.816 0.857 0.892 0.857 8606158 225 09-05-2021 08:00:00 10435 10373 10461 15 13 15 0.907 0.931 0.956 0.932 8606061 226 09-05-2021 07:30:00 10546 10487 10588 13 12 14 0.915 0.947 0.963 0.942 8605944 227 09-05-2021 07:00:00 10654 10589 10680 12 11 12 0.919 0.934 0.949 0.935 8605853 228 09-05-2021 06:30:00 10657 10595 10693 11 10 11 0.918 0.945 0.946 0.937 8605748 229 09-05-2021 06:00:00 10757 10711 10797 11 10 11 0.896 0.911 0.936 0.915 8605641 230 09-05-2021 05:30:00 10967 10920 11021 12 11 12 0.926 0.93 0.949 0.935 8605535 231 09-05-2021 05:00:00 11106 11061 11161 14 13 14 0.925 0.926 0.947 0.934 8605422 232 09-05-2021 04:30:00 11232 11187 11284 12 11 12 0.918 0.928 0.935 0.927 8605304 233 09-05-2021 04:00:00 11218 11185 11275 10 9 10 0.899 0.921 0.931 0.918 8605185 234 09-05-2021 03:30:00 11248 11213 11313 11 10 11 0.9 0.915 0.931 0.916 8605088 235 09-05-2021 03:00:00 11173 11133 11227 10 10 10 0.892 0.906 0.923 0.907 8604991 236 09-05-2021 02:30:00 11184 11147 11230 10 10 10 0.905 0.907 0.929 0.914 8604895 237 09-05-2021 02:00:00 11158 11109 11206 11 9 11 0.901 0.923 0.954 0.927 8604799 238 09-05-2021 01:30:00 11137 11095 11196 11 10 11 0.913 0.921 0.943 0.926 8604702 239 09-05-2021 01:00:00 11074 11019 11116 10 9 10 0.917 0.919 0.946 0.928 8604604 240 09-05-2021 00:30:00 11116 11069 11168 12 11 12 0.915 0.914 0.937 0.923 8604505 241 09-05-2021 00:00:00 11066 11012 11107 11 10 10 0.896 0.9 0.93 0.91 8604408 242 08-05-2021 23:30:00 11017 10969 11055 11 11 11 0.908 0.92 0.919 0.916 8604309 243 08-05-2021 23:00:00 11057 11014 11099 12 11 12 0.882 0.932 0.936 0.918 8604203 244 08-05-2021 22:30:00 11081 11036 11126 14 13 14 0.913 0.928 0.942 0.927 8604103
- 51. Load Profile Data from 9th April 2021 to 13th May 2021 245 08-05-2021 22:00:00 11130 11067 11164 16 15 15 0.964 0.953 0.976 0.966 8603979 246 08-05-2021 21:30:00 11119 11061 11156 12 12 12 0.936 0.933 0.949 0.94 8603857 247 08-05-2021 21:00:00 11104 11035 11126 13 12 13 0.94 0.946 0.954 0.947 8603746 248 08-05-2021 20:30:00 11042 10977 11076 13 12 13 0.931 0.939 0.961 0.946 8603624 249 08-05-2021 20:00:00 10972 10898 10990 12 11 11 0.928 0.927 0.954 0.937 8603511 250 08-05-2021 19:30:00 10861 10789 10884 13 12 13 0.924 0.948 0.955 0.94 8603395 251 08-05-2021 19:00:00 10785 10699 10794 13 11 13 0.924 0.946 0.963 0.946 8603269 252 08-05-2021 18:30:00 10747 10654 10751 11 10 12 0.919 0.97 0.962 0.952 8603163 253 08-05-2021 18:00:00 10664 10622 10728 14 13 15 0.923 0.949 0.947 0.94 8603046 254 08-05-2021 17:30:00 10700 10655 10756 13 12 13 0.929 0.956 0.959 0.949 8602930 255 08-05-2021 17:00:00 10641 10574 10678 17 15 18 0.936 0.971 0.969 0.96 8602811 256 08-05-2021 16:30:00 10683 10600 10712 14 13 14 0.933 0.94 0.953 0.943 8602695 257 08-05-2021 16:00:00 10782 10719 10820 13 12 14 0.879 0.935 0.935 0.916 8602579 258 08-05-2021 15:30:00 10872 10801 10896 10 9 11 0.853 0.927 0.921 0.902 8602475 259 08-05-2021 15:00:00 10886 10813 10924 13 11 12 0.905 0.913 0.941 0.921 8602369 260 08-05-2021 14:30:00 10822 10764 10851 11 10 11 0.89 0.914 0.934 0.914 8602298 261 08-05-2021 14:00:00 10782 10711 10802 12 11 12 0.913 0.935 0.95 0.933 8602218 262 08-05-2021 13:30:00 10823 10754 10849 11 10 12 0.871 0.933 0.915 0.908 8602163 263 08-05-2021 13:00:00 10808 10738 10823 7 5 6 0.486 0.504 0.715 0.576 8602101 264 08-05-2021 12:30:00 10822 10728 10827 8 8 8 0.737 0.771 0.803 0.771 8602053 265 08-05-2021 12:00:00 10799 10712 10818 7 6 7 0.772 0.796 0.848 0.807 8601983 266 08-05-2021 11:30:00 10775 10688 10796 10 9 10 0.841 0.878 0.914 0.88 8601893 267 08-05-2021 11:00:00 10787 10731 10832 10 9 10 0.857 0.895 0.914 0.89 8601805 268 08-05-2021 10:30:00 10744 10659 10763 8 7 8 0.765 0.785 0.848 0.801 8601740 269 08-05-2021 10:00:00 10771 10678 10778 6 5 6 0.556 0.583 0.74 0.631 8601703 270 08-05-2021 09:30:00 10603 10510 10619 8 6 8 0.722 0.826 0.847 0.801 8601664 271 08-05-2021 09:00:00 10425 10345 10456 5 4 5 0.583 0.621 0.751 0.656 8601610 272 08-05-2021 08:30:00 10447 10364 10470 11 9 10 0.834 0.857 0.915 0.871 8601549 273 08-05-2021 08:00:00 10498 10409 10515 11 11 11 0.923 0.913 0.933 0.923 8601455 274 08-05-2021 07:30:00 10622 10548 10636 14 12 12 0.944 0.92 0.963 0.944 8601351 275 08-05-2021 07:00:00 10664 10584 10678 13 12 13 0.894 0.928 0.949 0.924 8601244 276 08-05-2021 06:30:00 10801 10738 10816 13 13 13 0.946 0.952 0.958 0.951 8601132 277 08-05-2021 06:00:00 10889 10816 10936 11 10 11 0.907 0.924 0.945 0.927 8601035 278 08-05-2021 05:30:00 10931 10860 10988 10 9 10 0.894 0.923 0.946 0.923 8600926 279 08-05-2021 05:00:00 10943 10884 11002 13 12 14 0.924 0.953 0.967 0.947 8600825 280 08-05-2021 04:30:00 11066 11003 11116 10 8 9 0.889 0.908 0.942 0.915 8600728 281 08-05-2021 04:00:00 11080 11019 11135 10 8 9 0.906 0.916 0.956 0.928 8600624 282 08-05-2021 03:30:00 11087 11029 11156 10 9 10 0.907 0.926 0.956 0.931 8600535 283 08-05-2021 03:00:00 11087 11045 11159 10 9 10 0.897 0.924 0.942 0.922 8600445 284 08-05-2021 02:30:00 11140 11092 11201 9 8 9 0.899 0.914 0.945 0.921 8600356 285 08-05-2021 02:00:00 11116 11061 11178 11 9 10 0.92 0.921 0.956 0.934 8600265 286 08-05-2021 01:30:00 11107 11057 11170 11 9 10 0.903 0.911 0.956 0.925 8600175 287 08-05-2021 01:00:00 11151 11106 11210 9 8 9 0.896 0.909 0.943 0.917 8600083 288 08-05-2021 00:30:00 11083 11031 11140 11 10 11 0.903 0.912 0.94 0.919 8599993 289 08-05-2021 00:00:00 11074 11017 11125 11 10 11 0.907 0.929 0.957 0.933 8599901 290 07-05-2021 23:30:00 11047 11003 11107 12 11 12 0.922 0.925 0.958 0.936 8599806 291 07-05-2021 23:00:00 11069 11028 11135 11 10 11 0.912 0.924 0.95 0.93 8599699 292 07-05-2021 22:30:00 11071 11028 11161 14 13 14 0.935 0.951 0.961 0.951 8599582 293 07-05-2021 22:00:00 10964 10912 11048 16 14 15 0.964 0.961 0.983 0.97 8599452 294 07-05-2021 21:30:00 10922 10837 10990 12 11 13 0.912 0.968 0.97 0.953 8599328
- 52. Load Profile Data from 9th April 2021 to 13th May 2021 295 07-05-2021 21:00:00 10886 10749 10915 15 13 15 0.95 0.961 0.974 0.961 8599204 296 07-05-2021 20:30:00 10737 10589 10771 12 10 12 0.914 0.947 0.966 0.944 8599099 297 07-05-2021 20:00:00 10860 10681 10875 13 11 13 0.927 0.963 0.981 0.96 8598985 298 07-05-2021 19:30:00 10693 10484 10702 12 11 12 0.921 0.937 0.961 0.941 8598849 299 07-05-2021 19:00:00 10537 10318 10536 14 11 14 0.93 0.956 0.977 0.955 8598725 300 07-05-2021 18:30:00 10567 10380 10581 14 12 14 0.95 0.976 0.983 0.971 8598605 301 07-05-2021 18:00:00 10659 10527 10719 15 13 15 0.932 0.964 0.972 0.957 8598471 302 07-05-2021 17:30:00 10693 10584 10742 12 11 12 0.935 0.962 0.966 0.955 8598349 303 07-05-2021 17:00:00 10744 10636 10785 12 10 12 0.912 0.936 0.958 0.937 8598243 304 07-05-2021 16:30:00 10711 10621 10764 11 9 11 0.89 0.933 0.969 0.935 8598146 305 07-05-2021 16:00:00 10808 10704 10853 10 8 9 0.869 0.875 0.918 0.889 8598055 306 07-05-2021 15:30:00 10802 10707 10844 7 6 6 0.77 0.753 0.87 0.801 8597958 307 07-05-2021 15:00:00 10841 10738 10899 11 10 12 0.9 0.947 0.933 0.928 8597858 308 07-05-2021 14:30:00 10844 10751 10896 10 8 10 0.759 0.86 0.881 0.836 8597760 309 07-05-2021 14:00:00 10709 10626 10783 13 12 13 0.93 0.958 0.962 0.952 8597651 310 07-05-2021 13:30:00 10825 10738 10899 10 8 11 0.826 0.897 0.938 0.892 8597564 311 07-05-2021 13:00:00 10723 10629 10780 12 11 12 0.916 0.944 0.961 0.942 8597447 312 07-05-2021 12:30:00 10716 10624 10782 8 8 8 0.862 0.866 0.9 0.877 8597340 313 07-05-2021 12:00:00 10707 10617 10751 14 14 15 0.947 0.975 0.969 0.964 8597230 314 07-05-2021 11:30:00 10738 10629 10787 14 12 14 0.919 0.943 0.966 0.943 8597108 315 07-05-2021 11:00:00 10641 10539 10693 17 15 17 0.944 0.963 0.972 0.96 8596973 316 07-05-2021 10:30:00 10525 10423 10584 15 13 16 0.933 0.977 0.976 0.964 8596824 317 07-05-2021 10:00:00 10489 10387 10562 13 12 14 0.931 0.97 0.975 0.96 8596696 318 07-05-2021 09:30:00 10617 10480 10664 16 15 18 0.94 0.988 0.973 0.971 8596565 319 07-05-2021 09:00:00 10586 10449 10638 14 12 15 0.918 0.963 0.975 0.955 8596423 320 07-05-2021 08:30:00 10442 10297 10498 12 11 13 0.913 0.955 0.95 0.94 8596295 321 07-05-2021 08:00:00 10439 10288 10487 12 11 13 0.905 0.953 0.939 0.933 8596187 322 07-05-2021 07:30:00 10589 10470 10641 12 11 12 0.922 0.948 0.962 0.945 8596078 323 07-05-2021 07:00:00 10820 10712 10886 11 10 11 0.91 0.932 0.943 0.929 8595987 324 07-05-2021 06:30:00 10941 10834 10998 12 11 12 0.948 0.952 0.958 0.952 8595884 325 07-05-2021 06:00:00 10886 10796 10960 11 10 12 0.901 0.947 0.95 0.934 8595779 326 07-05-2021 05:30:00 10967 10912 11026 14 13 13 0.958 0.957 0.973 0.966 8595661 327 07-05-2021 05:00:00 11114 11080 11184 13 12 12 0.956 0.95 0.965 0.96 8595553 328 07-05-2021 04:30:00 11196 11158 11261 11 10 11 0.914 0.931 0.936 0.927 8595446 329 07-05-2021 04:00:00 11180 11154 11263 9 9 9 0.909 0.932 0.929 0.924 8595346 330 07-05-2021 03:30:00 11220 11194 11298 11 10 10 0.915 0.918 0.933 0.922 8595252 331 07-05-2021 03:00:00 11208 11173 11282 9 9 9 0.92 0.933 0.943 0.933 8595160 332 07-05-2021 02:30:00 11170 11142 11234 9 9 9 0.914 0.926 0.939 0.927 8595069 333 07-05-2021 02:00:00 11123 11102 11199 11 10 11 0.915 0.937 0.953 0.936 8594979 334 07-05-2021 01:30:00 11189 11164 11267 10 9 10 0.925 0.933 0.95 0.936 8594888 335 07-05-2021 01:00:00 11227 11213 11334 10 10 11 0.918 0.935 0.945 0.933 8594798 336 07-05-2021 00:30:00 11145 11113 11235 9 9 9 0.916 0.929 0.944 0.93 8594705 337 07-05-2021 00:00:00 11102 11066 11184 10 9 10 0.906 0.932 0.942 0.928 8594615 338 06-05-2021 23:30:00 11031 10981 11097 10 9 10 0.906 0.924 0.938 0.923 8594513 339 06-05-2021 23:00:00 11040 10990 11111 15 14 15 0.967 0.963 0.977 0.969 8594394 340 06-05-2021 22:30:00 10974 10917 11035 12 11 12 0.92 0.942 0.955 0.94 8594283 341 06-05-2021 22:00:00 10927 10863 10976 11 10 12 0.903 0.958 0.953 0.94 8594183 342 06-05-2021 21:30:00 10912 10841 10972 13 11 12 0.932 0.948 0.967 0.951 8594070 343 06-05-2021 21:00:00 10893 10783 10953 15 14 15 0.949 0.962 0.973 0.962 8593952 344 06-05-2021 20:30:00 10969 10841 11014 10 9 10 0.912 0.94 0.957 0.938 8593845
- 53. Load Profile Data from 9th April 2021 to 13th May 2021 345 06-05-2021 20:00:00 10749 10586 10778 18 16 18 0.966 0.979 0.984 0.978 8593724 346 06-05-2021 19:30:00 10809 10602 10828 11 10 11 0.934 0.947 0.963 0.949 8593591 347 06-05-2021 19:00:00 10695 10498 10712 14 12 14 0.93 0.968 0.974 0.961 8593453 348 06-05-2021 18:30:00 10537 10356 10586 17 15 17 0.941 0.966 0.978 0.965 8593310 349 06-05-2021 18:00:00 10629 10586 10709 14 13 14 0.938 0.949 0.954 0.948 8593176 350 06-05-2021 17:30:00 10763 10657 10825 15 14 15 0.937 0.956 0.962 0.952 8593051 351 06-05-2021 17:00:00 10865 10775 10927 13 12 15 0.901 0.97 0.955 0.944 8592915 352 06-05-2021 16:30:00 10723 10634 10789 14 13 15 0.929 0.962 0.957 0.949 8592785 353 06-05-2021 16:00:00 10622 10548 10693 15 14 15 0.945 0.968 0.967 0.958 8592667 354 06-05-2021 15:30:00 10757 10680 10828 15 13 14 0.931 0.931 0.966 0.947 8592558 355 06-05-2021 15:00:00 10766 10697 10841 16 14 16 0.945 0.951 0.972 0.958 8592435 356 06-05-2021 14:30:00 10654 10579 10719 15 13 16 0.934 0.958 0.972 0.956 8592299 357 06-05-2021 14:00:00 10693 10647 10752 16 14 17 0.923 0.964 0.964 0.952 8592169 358 06-05-2021 13:30:00 10794 10749 10873 12 10 12 0.901 0.931 0.954 0.93 8592021 359 06-05-2021 13:00:00 10712 10655 10785 7 5 7 0.64 0.715 0.857 0.746 8591909 360 06-05-2021 12:30:00 10645 10579 10711 11 10 12 0.898 0.946 0.945 0.931 8591828 361 06-05-2021 12:00:00 10647 10581 10721 10 8 10 0.856 0.92 0.945 0.91 8591729 362 06-05-2021 11:30:00 10652 10586 10726 12 10 12 0.906 0.946 0.953 0.936 8591638 363 06-05-2021 11:00:00 10761 10667 10822 13 11 14 0.893 0.962 0.957 0.939 8591521 364 06-05-2021 10:30:00 10719 10600 10783 18 16 19 0.948 0.977 0.979 0.971 8591383 365 06-05-2021 10:00:00 10683 10558 10740 13 11 13 0.897 0.954 0.958 0.938 8591250 366 06-05-2021 09:30:00 10492 10344 10527 15 13 16 0.908 0.952 0.959 0.939 8591132 367 06-05-2021 09:00:00 10421 10286 10477 9 7 9 0.695 0.77 0.842 0.773 8591025 368 06-05-2021 08:30:00 10406 10271 10456 15 13 15 0.914 0.945 0.961 0.94 8590915 369 06-05-2021 08:00:00 10501 10326 10525 9 8 9 0.793 0.85 0.884 0.844 8590839 370 06-05-2021 07:30:00 10415 10328 10439 13 12 13 0.925 0.942 0.959 0.943 8590748 371 06-05-2021 07:00:00 10560 10466 10595 11 10 12 0.904 0.929 0.937 0.924 8590639 372 06-05-2021 06:30:00 10596 10496 10607 12 11 13 0.906 0.952 0.946 0.936 8590525 373 06-05-2021 06:00:00 10780 10714 10832 12 12 12 0.925 0.931 0.941 0.932 8590412 374 06-05-2021 05:30:00 10648 10605 10702 14 13 15 0.926 0.969 0.957 0.95 8590303 375 06-05-2021 05:00:00 10854 10797 10896 12 11 12 0.919 0.941 0.949 0.937 8590184 376 06-05-2021 04:30:00 10932 10910 11029 15 14 15 0.95 0.956 0.97 0.957 8590080 377 06-05-2021 04:00:00 11036 10995 11114 11 11 11 0.915 0.921 0.937 0.925 8589958 378 06-05-2021 03:30:00 10996 10964 11076 11 10 11 0.9 0.926 0.931 0.919 8589857 379 06-05-2021 03:00:00 10958 10917 11038 12 11 12 0.908 0.926 0.94 0.925 8589757 380 06-05-2021 02:30:00 11073 11024 11149 11 10 11 0.917 0.932 0.953 0.935 8589657 381 06-05-2021 02:00:00 10977 10929 11036 10 9 11 0.914 0.937 0.953 0.936 8589556 382 06-05-2021 01:30:00 10979 10931 11048 12 11 13 0.909 0.927 0.944 0.927 8589455 383 06-05-2021 01:00:00 10877 10813 10938 11 10 11 0.901 0.923 0.945 0.924 8589351 384 06-05-2021 00:30:00 10785 10723 10853 10 9 10 0.919 0.942 0.954 0.939 8589251 385 06-05-2021 00:00:00 10972 10906 11042 11 10 11 0.926 0.942 0.953 0.941 8589151 386 05-05-2021 23:30:00 11054 10984 11116 12 11 12 0.911 0.925 0.941 0.926 8589051 387 05-05-2021 23:00:00 11048 10960 11076 12 12 12 0.924 0.926 0.939 0.93 8588948 388 05-05-2021 22:30:00 11007 10932 11055 14 13 14 0.922 0.928 0.947 0.933 8588835 389 05-05-2021 22:00:00 10955 10860 10977 12 11 12 0.93 0.934 0.94 0.935 8588728 390 05-05-2021 21:30:00 11161 11024 11199 13 13 14 0.928 0.943 0.946 0.94 8588609 391 05-05-2021 21:00:00 10938 10764 10967 14 12 14 0.936 0.965 0.976 0.96 8588475 392 05-05-2021 20:30:00 10854 10638 10856 14 13 14 0.929 0.939 0.956 0.942 8588355 393 05-05-2021 20:00:00 10723 10468 10704 13 12 14 0.924 0.958 0.962 0.946 8588241 394 05-05-2021 19:30:00 10799 10548 10773 16 14 16 0.946 0.974 0.982 0.969 8588113
- 54. Load Profile Data from 9th April 2021 to 13th May 2021 395 05-05-2021 19:00:00 10305 10039 10285 16 13 16 0.932 0.973 0.982 0.967 8587982 396 05-05-2021 18:30:00 10411 10208 10413 13 12 14 0.922 0.956 0.963 0.948 8587849 397 05-05-2021 18:00:00 10589 10416 10622 15 13 15 0.954 0.969 0.981 0.97 8587733 398 05-05-2021 17:30:00 10629 10480 10666 14 12 14 0.941 0.947 0.967 0.954 8587613 399 05-05-2021 17:00:00 10633 10498 10681 17 14 16 0.925 0.946 0.969 0.949 8587483 400 05-05-2021 16:30:00 10775 10643 10827 11 9 11 0.859 0.911 0.94 0.906 8587360 401 05-05-2021 16:00:00 10778 10645 10823 16 14 16 0.889 0.914 0.942 0.914 8587256 402 05-05-2021 15:30:00 10676 10550 10719 13 11 13 0.877 0.94 0.953 0.927 8587157 403 05-05-2021 15:00:00 10659 10541 10705 9 8 9 0.761 0.817 0.861 0.815 8587061 404 05-05-2021 14:30:00 10621 10486 10662 17 15 18 0.935 0.97 0.969 0.96 8586964 405 05-05-2021 14:00:00 10641 10508 10680 15 14 16 0.934 0.969 0.97 0.959 8586807 406 05-05-2021 13:30:00 10660 10524 10697 19 18 21 0.957 0.982 0.979 0.973 8586643 407 05-05-2021 13:00:00 10787 10659 10827 18 15 18 0.943 0.965 0.982 0.965 8586479 408 05-05-2021 12:30:00 10631 10506 10686 14 11 14 0.92 0.966 0.979 0.96 8586339 409 05-05-2021 12:00:00 10607 10466 10643 10 8 11 0.856 0.953 0.957 0.927 8586243 410 05-05-2021 11:30:00 10512 10373 10557 13 10 13 0.882 0.956 0.974 0.943 8586141 411 05-05-2021 11:00:00 10472 10330 10512 12 9 12 0.832 0.89 0.956 0.9 8586038 412 05-05-2021 10:30:00 10647 10510 10685 14 12 14 0.884 0.922 0.954 0.924 8585945 413 05-05-2021 10:00:00 10470 10305 10494 13 9 12 0.868 0.919 0.967 0.923 8585821 414 05-05-2021 09:30:00 10247 10063 10274 15 12 16 0.906 0.965 0.974 0.955 8585707 415 05-05-2021 09:00:00 10217 10032 10243 14 10 14 0.856 0.915 0.968 0.92 8585600 416 05-05-2021 08:30:00 10328 10158 10356 12 10 12 0.865 0.935 0.95 0.92 8585496 417 05-05-2021 08:00:00 10369 10207 10401 13 11 13 0.912 0.932 0.959 0.936 8585385 418 05-05-2021 07:30:00 10229 10073 10272 17 16 17 0.956 0.967 0.98 0.968 8585246 419 05-05-2021 07:00:00 10683 10532 10716 16 14 16 0.93 0.96 0.97 0.954 8585118 420 05-05-2021 06:30:00 10754 10697 10806 16 16 17 0.958 0.971 0.966 0.964 8584974 421 05-05-2021 06:00:00 10865 10802 10915 13 12 14 0.914 0.952 0.956 0.941 8584835 422 05-05-2021 05:30:00 10818 10752 10879 13 12 13 0.942 0.957 0.958 0.953 8584723 423 05-05-2021 05:00:00 10882 10834 10951 14 13 14 0.944 0.947 0.96 0.95 8584601 424 05-05-2021 04:30:00 10964 10920 11045 12 12 13 0.91 0.936 0.942 0.93 8584480 425 05-05-2021 04:00:00 10998 10960 11074 13 12 14 0.901 0.948 0.951 0.934 8584354 426 05-05-2021 03:30:00 11126 11090 11210 11 10 12 0.908 0.944 0.954 0.937 8584235 427 05-05-2021 03:00:00 11038 10998 11116 12 11 12 0.913 0.941 0.944 0.934 8584124 428 05-05-2021 02:30:00 11067 11026 11142 12 11 12 0.897 0.935 0.937 0.924 8584015 429 05-05-2021 02:00:00 11088 11048 11163 13 11 13 0.893 0.926 0.943 0.921 8583908 430 05-05-2021 01:30:00 11173 11140 11267 12 11 12 0.918 0.939 0.953 0.937 8583797 431 05-05-2021 01:00:00 11128 11088 11204 12 11 13 0.91 0.933 0.949 0.934 8583686 432 05-05-2021 00:30:00 11097 11057 11175 12 11 13 0.899 0.94 0.949 0.931 8583578 433 05-05-2021 00:00:00 11066 11016 11128 12 11 12 0.913 0.931 0.942 0.929 8583469 434 04-05-2021 23:30:00 11000 10950 11064 13 12 13 0.922 0.942 0.95 0.938 8583358 435 04-05-2021 23:00:00 10924 10873 10984 11 11 11 0.934 0.95 0.957 0.948 8583245 436 04-05-2021 22:30:00 10977 10922 11047 13 12 13 0.914 0.954 0.959 0.943 8583133 437 04-05-2021 22:00:00 10873 10802 10929 13 12 13 0.924 0.939 0.95 0.935 8583015 438 04-05-2021 21:30:00 10965 10884 11045 14 14 15 0.935 0.952 0.95 0.946 8582886 439 04-05-2021 21:00:00 10906 10796 10967 13 12 14 0.915 0.953 0.96 0.941 8582745 440 04-05-2021 20:30:00 10950 10808 10998 12 11 13 0.937 0.956 0.966 0.951 8582631 441 04-05-2021 20:00:00 10981 10792 10996 16 14 16 0.94 0.959 0.976 0.959 8582506 442 04-05-2021 19:30:00 10861 10654 10865 15 13 15 0.932 0.967 0.977 0.962 8582365 443 04-05-2021 19:00:00 10773 10584 10801 18 16 18 0.956 0.968 0.978 0.968 8582225 444 04-05-2021 18:30:00 10757 10595 10799 13 11 14 0.915 0.966 0.966 0.949 8582093