SlideShare a Scribd company logo
1 of 27
Diffusion and Osmosis
How does water move into and out of a cell?
Water passes into and out of the
cell by osmosis. Osmosis is the
diffusion of water across a
membrane from an area of higher
water concentration to an area of
lower water concentration. In this
investigation, you will use an egg
membrane as a model system
and observe the effects of water
movement when the egg is placed
in different solutions.

A

Materials
•
•
•
•
•
•
•
•
•
•

600 mL beakers/clear plastic cups (2)
Wax pencil/permanent marker
Balance
Vinegar
Tablespoon
Fresh eggs (2)
50 mL beakers/plastic cups
Paper plates
Distilled water
Corn syrup

Dissolving the eggshell
1. Obtain two 600-mL beakers. Number
them “Egg #1” and “ Egg #2.” Write
your initials or group number on each
beaker.
2. Obtain two eggs. Measure the mass of
one of the eggs and place it into the
beaker labeled Egg #1. Record your
results in the first column of Table 1.
3. Repeat with the next egg and place it in
the beaker labeled Egg #2. Record
your results in the first column of Table
1.

.

Raw Egg

T
able 1: Egg mass data
Vinegar
(after 24 hours)

Water or Syrup
(after 24 hours)

Egg #1
Egg #2
4. Pour 200 mL of vinegar into each beaker.
5. Record observations in Table 2, and place the two beakers in a safe place overnight.

32
Investigation 6A

Diffusion and Osmosis

.

Egg #1
Egg #2

Egg #1
Egg #2
Egg #1
Egg #2

T
able 2: Egg experiment observations
Day
Observations
1
1
2
2
3
3

6. Observe the eggs the next day, and record your observations in Table 2.
7. Slowly pour the vinegar out of each beaker. Be very careful not to rupture the egg cell
membrane.
8. Carefully remove the egg using the tablespoon, rinse with water, and place each egg
on its own labeled paper plate.
9. Measure the mass of each egg.
10. Record this information in the second column of Table 2.
.

B
a.

Stop and think
What was the effect of placing both eggs into vinegar overnight?

b. What happened to the mass of each egg after being placed into vinegar overnight? Use
what you know about osmosis and diffusion to explain the results.
c. If you think of the egg as a “cell,” what does the fluid inside of the egg represent? What
does the membrane that surrounds the cell represent?
d. In the next part of the investigation, you will place Egg #1 into a beaker containing
distilled water and Egg #2 into a beaker containing corn syrup. Based on what you know, what
do you think will happen to the mass of the egg when placed in distilled water overnight? In
corn syrup overnight?

C

Placing the eggs into different solutions
1. Return the eggs to their respective beakers.
2. Pour distilled water into the Egg #1 beaker until the egg is completely covered.
3. Pour corn syrup into the Egg #2 beaker until the egg is completely covered. If the egg
floats, place a cup with water on top of the egg to keep it submerged.
4. Place the two beakers in a safe place overnight.
5. After 24 hours, observe each egg, and record your observations in Table 2.
6. Slowly pour the water and syrup out of the respective beaker. Be very careful not to
rupture the egg membrane.

33
7. Carefully remove the egg using the tablespoon, rinse with water, and place each
egg on its own labeled paper plate.
8. Measure the mass of each egg.
9. Record this information in the third column of Table 1.
10. Return the eggs to their respective beakers, and wait for your teacher to collect them.

D
a.

Thinking about what you observed
In the Stop and think section above (question d), you were asked to predict what would
happen to each egg in the experiment. How did your results compare with your prediction?

b. Which beaker contained a greater concentration of water compared with the
concentration of water in the egg, the one labeled Egg #1 or the one labeled Egg #2?
c. After 24 hours, did Egg #1 contain more, less, or the same amount of water as it did
before the experiment? What is your evidence?
d. After 24 hours, did Egg #2 contain more, less, or the same amount of water as it did
before the experiment? What is your evidence?
e. Use the terms concentration, osmosis, diffusion to explain why water moved into one egg
and out of the other.

E

Exploring on your own

a. What would happen if you left the eggs in water and syrup for a longer period of time
(another day, for example)? Is it possible to return the eggs to their original state before
placing them into distilled water or corn syrup?

b. What would happen if you placed the egg originally in corn syrup (Egg #2) into distilled
water? Could you restore the egg to its original state?
c. What would happen if you placed the egg originally in water (Egg #1) into syrup? Would
it shrink? Try it.

34
Investigation 6B

Photosynthesis and Color

6B Photosynthesis and Color
Does the color of light affect photosynthesis?
Living organisms, both plant and animal,
contain chemicals known as pigments. A
pigment’s color is determined by the
wavelengths of light that the pigment reflects.
Plant leaves contain chlorophyll, a pigment
that is vital to photosynthesis. In this
investigation we will find out which colors of
light are needed by chlorophyll to sustain
photosynthesis.

A

Materials
•
•
•
•
•
•
•
•

Four small potted plants
Plant grow light (75 W)
Red light (75 W)
Blue light (75 W)
Green light (75 W)
Four light fixtures
Water
Thermometer

Setting up

Plants use sunlight in their natural habitat to produce energy through the process
of
photosynthesis. Sunlight is a pure white light, made up of all the colors together. What do you
think would happen to plants if we didn’t use white light, but instead used individual colors of light?
1. Find a place in your classroom where you can set up the four lights and four small
potted plants. You may need to place small cardboard dividers between the plants to
make sure only the specific color of light you want falls on each plant.
2. Label each plant with the color of light. All of your plants should be in similar
condition and approximately the same size.
3. Once the plant/light set up is in place, put a thermometer in one of the plant areas to
monitor temperature. You won’t keep track of the temperature, but you will check it
periodically to make sure the plants don’t get too hot. This may harm them and spoil the
experiment.

35
B
a.

Stop and think
What is the experimental variable in this experiment?

b. What are the control variables?
c. Make a hypothesis stating how you think the color of light used will effect each plant.
Think about the color of your plant. What color or colors is it reflecting? What colors or
colors is it absorbing?

C

Doing the experiment
1. The experiment begins when the lights are turned on. Discuss with your teacher if
you will be using a 12-hour timer to turn the lights on or off, if this will be done
manually, or if they will be on 24 hours a day.
2. Decide with your group if and/or how you want to water your plants.
3. Check on your plants each day and record your observations in your journal. Use a
data table like Table 1 below to record your observations. Include a column to describe
the initial condition of your plants.

.

T
able 1: Plant growth/health data
Day
Color

Initial
condition

Change in
condition

Grow light
Red
Green
Blue

D
a.

Thinking about what you observed
What color is your plant? If that particular color is getting to your eyes from the plant, is the
plant reflecting or absorbing that color?

b. What is the plant doing with the colors it absorbs?
c. Which color(s) of light you tested seem to support photosynthesis?
d. Which color(s) of light you tested did not seem to support photosynthesis?
e. Starting from the sun, describe the process that allows you to see the color of your plant.
f.

Why do certain colors support photosynthesis while others do not?

36
Investigation 7A

Protozoans

7A Protozoans
What are the characteristics of protozoans?
Most organisms in the Kingdom Protozoa
consist of a single cell. How do these
organisms move and gather food? In this
investigation, you will examine amoeba,
paramecium and euglena using the light
microscope. You will observe their movement
and characteristics. You will also develop a
hypothesis about how each organisms gets
food.

A

Materials
•
•
•
•
•
•
•
•
•

Live euglena culture
Live amoeba culture
Live paramecium culture
Depression slides
Coverslips
Corn syrup
Light microscope
Toothpicks
Dropper

Preparing slides of live protozoans

Observing amoeba
1. Place two drops of water into the chamber of the depression slide.
2. Slowly place a dropper into the amoeba culture. Be sure to place the dropper at the
bottom of the culture since the amoeba will be located at the bottom of the jar.
3. Remove the dropper and place a single drop of the culture into the chamber of your
compression slide.
4. Carefully, place a cover slip on top of the chamber and place under the microscope.

5. Using your medium power, bring the amoeba into view.
6. Once you have found the amoeba, switch to your high-power objective.
7. Make a sketch of what you observe under the microscope in Table 1.
8. Observe the movement of the amoeba and record your observations in Table 1.
Observing Paramecium and Euglena
1. Wash and thoroughly dry the chamber of the compression slide.
2. Repeat steps 1-3 above.
3. Place a drop of corn syrup into the chamber of the depression slide. Protozoa are very
fast and corn syrup will slow the organisms so they may be viewed more easily under the
microscope.
4. Place a single drop of paramecium culture into the chamber of the depression slide.
5. Using a toothpick carefully mix the corn syrup and the paramecium.
6. Carefully, place a cover slip on top of the chamber and place under the microscope.
7. Using your medium-power objective, bring the paramecium into view.
8. Once you have found the paramecium, switch to your high-power objective.
9. Sketch a picture of what you observe under the microscope in Table 1, paramecium.
10. Observe the movement of the paramecium and record your observations in Table 1.
11. Repeat the procedures this time using the euglena culture.

37
.

Amoeba

T
able 1: Protozoa observations
Paramecium

Observations:

B
a.

Observations

Euglena

Observations:

Thinking about what you
observed
Describe the way each organism
(amoeba, paramecium, and
euglena) moves. Which ones have
structures for movement? Do those
structures look like?

b. Do any of the organisms have a
structure that resembles a mouth?
Make a hypothesis about how each
organism feeds.
c. Use the diagram (at left) to help
you identify the structures of each
organism. Label the structures you
observed in your sketches.

C

Exploring on your own

Protozoans are everywhere and will make their homes in a variety of water sources. Some
protozoans cause sickness in humans. One species called Giardia lamblia is closely related to
paramecium. It lives in freshwater sources. Research Giardia and write a short report. Use the key
word “Giardia” in your Internet search. Include in your report the following information:
a.

Where is Giardia found? How do people contract the disease?

b. What are the symptoms of the disease caused by Giardia?
c. How is the disease treated?
d. How can the disease caused by Giardia be prevented?

38
Investigation 7B

Investigating Pond Water

7B Investigating Pond Water
Which microscopic organisms are found in pond water?
If you took a single drop of water from a pond
and looked at it under the microscope, you’d be
lucky to find anything. To increase the number
of organisms in your sample you can create a
hay infusion. A hay infusion is a culture that
uses water collected from a pond, stream,
creek, or puddle and dried grass. You simply
place dry grass a container of water and allow
the culture to sit for approximately one week. At
the end of the week, the culture will be teeming
with different types of small microscopic
organisms. In this investigation, you will make a
hay infusion and then using what you have
already learned, try to identify the microorganisms.

A

Materials
•
•
•
•
•
•
•
•
•
•

Glass jar
Pond or creek water
Hay or dry grass
Milk
Yeast
Depression slides
Coverslips
Corn syrup
Light microscope
Dropper

Setting up

1. Place pond water into the glass jar until the jar is about half-filled.
2. Add several pieces of cut hay or dry grass to the jar.
3. Add a teaspoon of milk and a grain of yeast.
4. Loosely cover the jar with the lid. [Be sure not to tighten the lid of the jar completely since
the organisms need oxygen.]
5. Place the jar in a warm place, in front of a window or in an incubator.
6. Check the hay infusion periodically, although it will take about a week for the
organism growth to peak, spot checking the culture will ensure you see lots of
different organisms.
Safety tip: The hay infusion will contain a large number of bacteria. Make sure you wash
your
hands completely after handling the hay infusion, samples, and depression slides.

39
B
a.

Stop and think
What types of organisms do you think you will find under the microscope after a week?

b. Why is it important not to tighten the lid of the jar completely?

C

Doing the experiment
1. Place a drop of water into your depression
slide chamber.
2. Place a single drop of corn syrup into the
well of the depression slide chamber. The
corn syrup will slow the movement of the
organisms without harming the organisms.
Remove jar’s lid. Take a small drop of the
3. water from the top of the jar and place it
into the depression slide chamber.
Carefully, place a cover slip on top of the
4. chamber and place under the microscope.
Using your low-power objective, bring the
5. sample into focus. It is important to
remember that the organisms will be moving
quickly, so this step can be tricky.
Once you have found the correct plane of
6. focus, switch to the high-power objective.
Make a sketch of what you observe under the microscope. It is possible you will see a
7. number of organisms, and this is good. Make a careful sketch of every organism you see.
Once you have completed Steps 1-7, wash and thoroughly dry the chamber of the
compression slide.
8. Repeat the procedures with drops of water taken from different areas of the jar.
9.
10. Once you have completed your drawings, try to identify the organisms you have
observed in your hay infusion. A sheet of photos will be provided by your teacher. Use
other resources such as books or the Internet if needed.

40
Investigation 7B

Investigating Pond Water

.

Sample Location:
(top, middle, bottom)

D
a.

T
able 1: Hay infusion observations
Sketch of the Organism

Name of organism

Thinking about what you observed
How many different types of organisms did you identify?

b. What type of information did you use to help you identify the different organisms in your
hay infusion?
c. Is there a difference between the types of organisms you observed at the bottom, middle,
and top of the jar?
d. What sample contained the largest number of different organisms?
e. Which organisms belong to the Kingdom Protista? Which organisms do not?

41
8A Observing the Cell Cycle
How much time is spent in different stages of the cell cycle?
The life cycle of a cell is called the cell cycle.
Interphase is the period a cell spends growing
and performing its functions. Mitosis is the part
of the cell cycle where the chromosomes are
divided into two new nuclei. Two daughter cells
are formed, each containing a complete set of
chromosomes. Mitosis has 4 phases:
prophase, metaphase, anaphase, and
telophase. After mitosis, the cytoplasm and its
contents divide, separating the daughter cells
(cytokinesis). In this investigation, you will
determine the percentage of time a cell spends
in interphase and the four stages of mitosis.

A

Materials
•
•
•
•
•

Prepared whitefish blastula slides
Prepared onion root tip slides
Textbook
Pencil for sketching
Graph paper

Setting up
1. Set up a microscope and turn on the light.
2. On the stage, place a slide containing a stained preparation of Allium (onion root tip).
3. Locate the growth zone of the onion root tip. It is just above the root cap at the very
end.
4. Focus on low power, and then switch to medium or high power. Below are pictures of the
four stages of mitosis. Use them to help you identify the different stages on the
microscope slide.

42
Investigation 8A

B
a.

Observing the Cell Cycle

Stop and think
How do the chromosomes look at each stage of the cell cycle (interphase, prophase,
metaphase, anaphase, and telophase)?

b. Why is it important to recognize the differences in the appearance of the chromosomes at
different stages?

C

Doing the experiment
1. Count the number of cells in interphase, prophase, metaphase, anaphase, and
telophase. You’ll have to move the slide around several times until you have covered the
entire growth region. Record your data in Table 1 below.
2. Add up the total number of cells you counted and enter that value in Table 1.
3. Determine the percentage of time each cell will spend in each stage of the cell cycle.
Use this formula:

(Number of cells in phase

total number of cells)

100

Record your values in Table 1.
T
able 1: Number of cells and percentages
Stage of cell cycle
Number of cells in each stage Time spent in each stage (%)
Interphas
e
Prophas
e
Metaphas
e
Anaphas
T e
elophase
4

D
a.

Thinking about what you observed
Make a line or bar graph of the data in Table 1. Place time spent on the x-axis and
number of cells on they y-axis.

b. Of the four stages of mitosis, which one takes the most time to complete? Which is the
shortest stage in duration?

c. Cytokinesis is a stage in the cell cycle that happens right after mitosis. In this stage, the
cytoplasm is divided and the two daughter cells are separated. See if you can find an
example of cytokinesis on your Allium slide.
d. Obtain a prepared slide of animal cells (whitefish blastula). Try to identify and sketch
cells in different stages of the cell cycle. Make a sketch of a cell in interphase, prophase,
metaphase, telophase, and anaphase. Try to identify and sketch cells in cytokinesis.
e. How is cytokinesis different in the animal cell?

43
8B Modeling Mitosis and Meiosis
How do sex cells end up with a haploid set of chromosomes?
You may have seen fruit flies buzzing around a
bowl of fruit. They are tiny, but if you look
closely you may see red or white eyes. Like all
living organisms, fruit flies grow and reproduce.
The diploid number of chromosomes in fruit
flies is 8. In this investigation you will simulate
mitosis and meiosis in fruit flies. Through the
simulation you will identify how fruit fly sex cells
end up with only 4 chromosomes; a haploid set.

A

Materials
• 16 pipe cleaners of 2 different colors and 4
matching lengths
• Poster board or large piece of paper
• Marker
• O-shaped cereal
• Colored pencils (red, green, blue, yellow)

Setting up
1. Copy the chart (right) onto a piece of poster board. The circles
represent a fruit fly body cell in different stages of the cell cycle and
mitosis.
2. Your teacher will give you a set of pipe cleaners to represent
chromosomes. One color will represent the mother and the other
color will represent the father. Since chromosomes occur in
homologous pairs, use the same length of pipe cleaner for each
homologous pair. You should have two sets of four different lengths
of pipe cleaners.
3. Begin by assembling a diploid set of chromosomes for a fruit fly as
they exist during most of interphase (step 1 on the board). A diploid
set contains pairs of homologous chromosomes. Each chromosome
at this point will be a single strand. You will have an extra set of each
length and color left over. Here is a diploid set:

B
a.

Stop and think
What is the diploid number of chromosomes in a fruit fly?

b. How many homologous pairs of chromosomes does a fruit fly have?
c. In the diagram (right), name the steps that are part of mitosis.
d. Which steps are part of the rest of the cell cycle?

44
Investigation 8B

C

Modeling Mitosis and Meiosis

Modeling mitosis
1. In late interphase (step 2 on your board), the amount of DNA doubles. That means each
chromosome now doubles. Select a matching pipe cleaner (same length and color) for
each chromosome and slide both through a piece of cereal. You now should have a set
of eight doubled chromosomes arranged in homologous pairs.

2. Review the mitosis diagram in Chapter 8 of your textbook and move the chromosomes
through the rest of the steps on your board.

D
a.

Applying your knowledge
Fill in Table 1 with the correct information.
T
able 1: Cell cycle and mitosis in fruit flies
Step

Number of cells

Number of chromosomes
in each nucleus

Number of homologous
pairs in each nucleus

Interphase
Cytokinesis

b. What is the purpose of mitosis?

c. A diploid set of human chromosomes contains 23 homologous pairs (46 chromosomes).
Fill in Table 2 with the correction information regarding human body cells.
T
able 2: Cell cycle and mitosis in humans
Step

Number of cells

Number of chromosomes in
each nucleus

Number of homologous
pairs in each nucleus

Interphase
Cytokinesis

d. Why is it necessary to double the amount of genetic material before mitosis begins?
e. The two daughter cells end up with an exact copy of the genetic material from the parent
cell. How does your simulation support this statement?

45
E

Modeling meiosis

Meiosis is the process of producing sex cells with a haploid
set of chromosomes. Haploid means half the number of
chromosomes as the original cell. A haploid cell contains
one chromosome from each homologous pair.
1. Turn over your poster board and copy the diagram
(right) onto the other side. Fill the entire space on the
board with your drawing.
2. Begin by assembling a diploid set of chromosomes
for the fruit fly as you did in part 1. Place the
chromosomes, in homologous pairs, in the first
nucleus on your poster.
3. Like mitosis, before meiosis begins, the
chromosomes double. Add a similar pipe cleaner to
each chromosome and attach with a piece of cereal
as you did in part 1.
4. Unlike mitosis which has only one cell division,
meiosis has two divisions (meiosis I and meiosis II).
Using the meiosis diagram in Chapter 8 of your
textbook as a guide, move your chromosomes
through meiosis I and meiosis II.
5. Fill in Table 3 below as you move your
chromosomes through the chart.
T
able 3: Meiosis
Step

Number of
cells

Number of
chromosomes
in each cell

Number of
homologous pairs
in each cell

Diploid or
haploid
number?

Start of meiosis
End of meiosis I
End of meiosis II

F
a.

Thinking about what you observed
What happens to the homologous pairs of chromosomes in meiosis I?

b. At the end of meiosis I, how does the number of chromosomes in each new cell compare to
the original number of chromosomes in the parent cell? (Is it diploid or haploid?)
c. At the end of meiosis II, how does the number of chromosomes in each new cell compare
to the original number of chromosomes in the parent cell?

46
Investigation 8B

G

Modeling Mitosis and Meiosis

Exploring on your own

If time permits, you can model what happens during fertilization.
1. Sketch the chart (right) onto a blank piece of paper.
2. Remove the chromosomes from a sex cell you created
during the investigation and combine this with the
chromosomes of a sex cell from a different group. This is
less complicated if you combine with a group that has
different color pipe cleaners from yours.
a.

What is the end result of fertilization in terms of
chromosome number?

b. Do the cells of the new organism have a diploid or haploid
set of chromosomes?
c. What would happen if the sperm cell and egg cell did not
reduce the number of chromosomes before fertilization?
Model this with two diploid sets of chromosomes.
d. You have 23 pairs of chromosomes in your body cells. Why do your chromosomes occur in
pairs? For each pair, where does each chromosome come from?

47
9A Observing Human T
raits
How much do traits vary in your classroom?
Traits are physical characteristics you inherit
from your parents. In this investigation, you will
take an inventory of your observable traits and
compare these to the observable traits of your
classmates. You will then take inventory of
students and teachers in your school.
Finally, you will determine the frequency of
each trait in your school’s population.

A

Materials
• PTC paper
• Pencils
• Calculator

Observing your own traits

The graphic below shows seven different human traits. Each
Study the chart below, then follow the procedures carefully.

trait has two different forms.

1. Working with a partner, observe which form you have for trait A through F. Circle
your form of each trait in Table 1.
NOTE: For finger hair, even if you have only one hair on any of your mid-digits, you have
finger hair.
2. Wash and dry your hands. For trait G, your teacher will give you and your partner a piece
of PTC paper. Taste the paper and circle your form of the trait in Table 1.
Safety tip: Never taste any substance in the laboratory unless directed by your teacher.

48
Investigation 9A

Observing Human Traits

1

Trait

A. Earlobe
B. Dimples
C. Chin
D. Hairline
E. Finger hair
F. Thumb
G. PTC tasting

B
a.

T
able 1: Inventory of traits
Form 1
Free
Absent
Cleft
Widow’s peak
Present
Straight thumb
Can taste

Form 2

Attached
Present
No cleft
Straight
Absent
Hitchhiker’s thumb
Cannot taste

Stop and think
For earlobes only, how many students in your class do you think will share the same form
(free or attached) as you? Explain your reasoning.

b. Do you think any of your classmates will have the same form of all traits as you? Make a
prediction about how many of your classmates will have the same form of all seven traits as
you.

C

Collecting class data
1. Enter your results in the chart your teacher has placed on the chalkboard or
overhead projector.
2. Record the numbers from the chart into columns 2 and 4 of Table 2 below.
T
able 2: Class data for observable traits
Trait
Number of
Frequency of
Number of
Frequency of
students with
students with
students with
students with
Form 1
Form 1
Form 2
Form 2

A. Earlobe
B. Dimples
C. Chin

D. Hairline
E. Finger hair
F. Thumb
G. PTC tasting
3. Calculate the frequency of each form of the trait for your class. Use this formula:
(No. of students with form of trait

T
otal number of students in class)

100

4. Make a bar graph of the data in Table 2. Your graph should compare frequencies for
each form of each trait. Put traits on the x-axis and frequency on the y-axis.
5

49
D
a.

Thinking about what you observed
For each trait, which form was most common, Form 1 or Form 2?

b. Why do you think one form is more common than the other?
c. Do you think your classroom population is typical of a larger population such as your
entire school or community? Explain your answer.
d. Traits are controlled by factors called genes. For each trait listed in Table 1, you get one
gene from your mother and one gene from your father. For each trait, there is a dominant form
and a recessive form. The dominant gene masks the effect of the recessive gene for the trait.
Based on your class data, which form of each trait do you think is the dominant form? Explain
your answer.
e. The dominant and recessive forms for each trait you studied are listed below. Was the
recessive form of any trait more frequent than the dominant form? Make a hypothesis that
explains this result.
Trait

A. Earlobe
B. Dimples
C. Chin
D. Hairline

E. Finger hair
F. Thumb
G. PTC tasting

E
a.

Dominant form

Recessive form

Free
No dimples
Cleft present
Widow’s peak

Attached
Dimples present
No cleft
Straight

Finger hair present
Straight thumb
Taster

No finger hair
Hitchhiker’s thumb
Non-taster

Exploring on your own
Pick any trait (except for PTC tasting) and gather data about the trait from a larger
population. Examples of a larger population include your school, neighborhood, and place of
worship. Follow these steps:
1. Make a hypothesis about what you will observe.
2. Collect data from as many people as you can and record your results in a data table.
3. Graph your data.
4. Present your results to the class for discussion.

b. Do you think people who are related to each other would show more similarity among the
seven traits than unrelated people? Design an experiment to test your hypothesis.
3
4

50
Investigation 9B

Crazy Traits

9B Crazy T
raits
What role does chance play in an organism’s heredity?
Your traits are determined by the genes you
inherit from your parents. For each gene, you
get at least one allele from your mother and one
allele from your father. The alleles you end up
with are determined by two factors: (1) the
genotypes of your parents; and (2) the allele
from each parent you inherit. The alleles you
inherit from each parent are determined by
chance. In this investigation, you will play a
game that will help you learn about inheritance.

A

Materials
• Crazy Traits game
• Name tags
• Markers

Determining the genotype
1. The first trait you will flip for is gender. Choose the male sex chromosome coin (X on
one side and Y on the other) and the female sex chromosome coin (X on both sides).
Place both coins in the plastic cup and shake. Toss the coins onto the table and record
your results in Table 1.
2. Next, flip coins to determine the allele for each of the other traits your creature inherits
from each parent. In this activity, we will assume that both parents have the same
genotype for all traits (Tt). You will need a blue (egg) coin with a capital T on one side and
a lower case t on the other side. You will also a green (sperm) coin with a capital T on one
side and a lower case t on the other side.
3. Flip the coins for the next trait—skin color. Place the coins in the plastic cup. Shake the
cup and toss the two coins onto the lab table. The side that lands up on each coin
represents the sperm and egg that unite during fertilization. Record the allele from each
parent and genotype in columns 2, 3, and 4 of the first row of Table 1.
4. Repeat this procedure for traits 2 through 14.

B
a.

Stop and Think
What information do the letters on the sperm and egg coins indicate: alleles, genotype, or
phenotype?

b. For the sperm coin, what are the chances of getting a T or getting a t? State your answer
as a fraction and a percent.
c. For the egg coin, what are the chances of getting a T or getting a t? State your answer as
a fraction or a percent.
d. When both coins are flipped at once, what are your chances of getting each of the
following combinations: TT, Tt, or tt? Make a punnett square to show the cross. State your
answer for each as a fraction and a percent.

51
.

Trait

1.
2.
3.
4.
5.
6.
7.

8.
9.
10.
11.
12.

T
able 1: Genotypes and phenotypes of offspring for Part 1
Allele from
Allele from
Genotype
Phenotype
mother
father

Gender
Skin color
Leg
Foot
Arms
Hands
Eye color

Eyebrows
Beak
Ears
Antenna
Antenna shape

13. Tail
14. Wings

C

Building your creature
1. Once you have completed columns 2 through 4 of Table 1, use Table 2 (next page) to
look up the phenotype for each trait. Record the phenotype for each trait in column 5 of
Table 1.
2. Once you have completed Table 1, select the correct body parts to build your creature.
3. Carefully assemble your creature.
4. Give your creature a name and make it a name tag. Write the gender of your creature on
the name tag.
5. Place your creature on the table at the front of your classroom.

D
a.

Thinking about what you observed
Examine the creatures. Do any of them look exactly alike? Why or why not?

b. How does this investigation explain why siblings may resemble each other, but never
look exactly alike (unless they are identical twins)?
c. Count the number of males and number of females. Does the number of each match the
chances of getting a male or female in the game? Why or why not?
d. Which trait(s) are examples of complete dominance?

e. Which trait(s) are examples of incomplete dominance?
f.

Which trait(s) are examples of codominance?

52
Investigation 9B

Crazy Traits

.

Trait

T
able 2: Key to genotypes and phenotypes
Genotypes and phenotypes

1.

Gender

XX - female XY - male

2.

Skin color

TT - red Tt - purple tt - blue

3.

Leg

TT - short Tt - short tt - long

4.

Foot

TT - webbed Tt - webbed tt - talons

5.

Arms

TT - long Tt - long tt - short

6.

Hands

TT - paws Tt - paws tt - claws

7.

Eye color

TT - red Tt - one red and one green tt - green

8.

Eyebrows

TT - unibrow Tt - unibrow tt - separate

9.

Beak

TT - trumpet Tt - trumpet tt - crusher

10. Ears

TT - elephant Tt - elephant tt - mouse

11. Antenna

TT - long Tt - long tt - short

12. Antenna shape

TT - knob Tt - knob tt - star

13. Tail

TT - long Tt - short tt - none

14. Wings

TT - no wings Tt - no wings tt - wings

E

Exploring on your own

If time permits, work with another group whose creature is the opposite gender. Follow the
steps below to create offspring of the couple:
1. Record the genotypes of each parent in the first column of Table 3 on the next page.
2. First, toss for gender using the male and female sex chromosome coins.
3. For each trait, you’ll need to use the correct egg and sperm coins for each parent. Use the
data in Table 1 to find the parents’ genotype for each trait. Then, select the egg and
sperm coin that has the same alleles as the genotype. For example, if the father’s
genotype for skin color is TT, choose the sperm coin that has a capital T on both sides of
the coin. If the mother’s genotype for skin color is tt, place the egg coin that has a lower
case t on both sides of the coin.
4. Place both coins in the plastic cup, shake, and toss out onto the table. Record your
results in the fourth column of Table 3.
5. Use Table 2 to look up the phenotypes. Record the phenotypes of the offspring in the last
column of Table 3.

53
.

Trait

1.
2.
3.
4.
5.
6.

Gender
Skin color
Leg
Foot
Arms
Hands

7.
8.
9.
10.
11.

T
able 3: Offspring genotypes and phenotypes for Part 5
Genotype of Genotype of Genotype of Phenotype of offspring
mother for father for the
offspring
the trait
trait
(after
flipping)

Eye color
Eyebrows
Beak
Ears
Antenna

12. Antenna shape
13. Tail
14. Wings

F
a.

Applying what you learned
Which parent does your offspring share the most traits with, the mother, father, or both
equally?

b. Why do you need to choose different egg and sperm coins for each trait and for each
parent?
c. What is the process that flipping the sex cell coins represents? Why is this process
important?
d. There is always a 50% chance of having a male offspring. Explain why this statement is
true. You may use a diagram to help explain.
e. In part 1, you started off with both parents having identical genotypes for all traits. Use
what you have learned in the investigation to explain why this is unrealistic in nature.
f.

CHALLENGE! Make punnett squares to show possible genotypes and phenotypes for
each trait you flipped for in Part 5. For each, list the chances for each phenotype as a
ratio and as a percent.

54
Investigation 10A

The DNA Molecule

10A The DNA Molecule
What is the structure of the DNA molecule?
Deoxyribonucleic acid (DNA) is the hereditary
molecule. DNA is made of individual units
called nucleotides. Each nucleotide is made of
a phosphate group, a sugar (deoxyribose), and
a nitrogen base. The DNA molecule looks like a
twisted ladder. The phosphate and sugar form
the sides of the molecule. Each rung contains a
pair of bases held together by hydrogen bonds.
There are four bases: thymine (T), adenine (A),
guanine (G), and cytosine (C). T and A always
pair up and G and C always pair up. In this
investigation you will model the structure of
DNA using beads to represent the different
parts of the DNA molecule.

Materials
•
•
•
•
•
•
•

Red pop beads
White pop beads
Yellow pop beads
Green pop beads
Orange pop beads
Blue pop beads
Clear plastic connectors

.

A

Setting Up
1. Gather the required materials. Use Table 1 as a key for creating your DNA model.

.

T
able 1: DNA model components
Pop bead color
Molecule
Red
Phosphate group
White
Sugar (deoxyribose)
Bases:
Blue
Cytosine (C)
Orange
Guanine (G)
Yellow
Adenine (A)
Green
Thymine (T)

55
B

Doing the Experiment
1. Begin by creating two phosphate-sugar “backbones” that will provide the framework
on which to build each strand of your DNA molecule. Connect alternating white and red
pop beads. Each backbone should contain 10 red pop beads and 10 white pop beads.
Repeat step 1 to create the second phosphate-sugar backbone.
2. Attach a base to each sugar on one of the phosphate-sugar backbones. We will call this
3. the original DNA strand. At this point, the order of the bases does not matter. Use blue
to represent C, orange to represent G, yellow to represent A and green to represent T
(see Table 1).
Once you have created the original DNA strand, complete the first two columns of Table
4. 2. Place the color of the bead followed by the letter of the base in order as they appear in
your model.

.

Original strand
pop bead color

T
able 2: DNA molecule data
Complimentary strand
base
complimentary base
pop bead color

5. Once you have indicated the sequence of bases on the original DNA strand in Table 2,
determine the base sequence for the complimentary DNA strand. Remember, T
always pairs with A and G always pairs with C.

6. In Table 2, indicate the name of the complementary base and the color of the
corresponding pop bead.
7. Using the second phosphate-sugar backbone that you created in step 2, make the
complementary DNA strand using the information contained in Table 2.
8. Once you have created the complimentary DNA strand, use the clear plastic
connectors to “bond” the base pairs together. These connectors represent the weak
bonds that keep the base pairs together.
9. Draw a sketch of your DNA molecule in Table 3.
10. Hold the model from the top, and gently twist the DNA ladder to the right. You
should see that the DNA looks like a spiral staircase. The model now represents the
helical structure of DNA. Your teacher may instruct you to take your model and attach all
the DNA models together to make a longer strand of DNA. Do not do this until instructed
by your teacher.

56
Investigation 10A

The DNA Molecule

.

T
able 3: DNA molecule sketch

C
a.

Thinking about what you observed
Which molecules make up the backbone of the DNA molecule?

b. Why is DNA called “deoxyribose nucleic acid”?
c. What type of bond keeps the bases paired together?
d. Which base always pairs with adenine? Which base always pairs with cytosine?

D

Exploring on your own

Watson and Crick were awarded the Nobel Prize for their work in determining the structure of
DNA. However, the work of many scientists led to the final determination of the structure of
DNA. One such scientist was Rosalind Franklin. Do some research (library or internet) to learn
more about Rosalind Franklin. Try and figure out what she was studying and why this
helped Watson and Crick determine the structure of DNA. Think about why her research
might have gone unnoticed for so long.

57
10B DNA Forensics
How can DNA be used to solve a “crime?”
You have learned that DNA is the molecule that
carries the hereditary information. Each
individual is genetically unique, except in cases
of identical twins, and as a result your DNA
becomes a molecular fingerprint. This
molecular fingerprint can be used to identify an
individual with a great degree of certainty and is
used in the field of forensic science. Scientists
use DNA left at crime scenes to identify a
person who may have been involved in a crime.
In this Investigation, you will use DNA to solve a
fictional crime.

A

Materials
•
•
•
•
•
•
•
•
•

Red pop beads
White pop beads
Yellow pop beads
Green pop beads
Orange pop beads
Blue pop beads
Clear plastic connectors
DNA sequences
Envelope containing the identity of the DNA
sequence

Doing the Experiment

Today, someone left your teacher an apple with a note, “You are a super teacher!” But between
the time the apple was left and the time your teacher returned to class, a bite has been taken
out of it! Imagine that DNA has been collected from the “crime scene.” A DNA sample has also been
collected from suspects. Your lab group will help solve the case by building a portion of a DNA
molecule from one of the suspects. Then, you will compare your DNA model with others in the
class. Can you solve the mystery?
1. Gather the required materials. Use Table 1 as a key for creating your DNA molecule.
T
able 1: DNA model components
Pop bead color
Molecule
Red
Phosphate group
White
Sugar (deoxyribose)
Blue
Cytosine
Orange
Guanine
Yellow
Adenine
Green
Thymine
2. Your teacher will give each group an envelope. The DNA sample number is printed
on the outside. The sequence of bases on one strand is also provided.
.
.

T
able 2: DNA sample data
DNA sample number:
Number of bases:
Number of sugar molecules:
Number of phosphate molecules:
3. Begin by creating the phosphate and sugar backbone of the DNA molecule.
Determine the number of bases and indicate this number in Table 2.
4. Recall that the bases attach to the sugar molecules. Calculate the number of sugar
molecules that will be needed and record this in Table 2. Since the backbone is

58

More Related Content

Similar to investigations Diffusion and Osmosis

Scienceprocesses and scientific method
Scienceprocesses and scientific methodScienceprocesses and scientific method
Scienceprocesses and scientific methodDee Bayn
 
η μαγιά είναι ζωντανή;
η μαγιά είναι ζωντανή;η μαγιά είναι ζωντανή;
η μαγιά είναι ζωντανή;charalampatou
 
New work.POST ON National Security and DiplomacyIt is nat.docx
New work.POST ON National Security and DiplomacyIt is nat.docxNew work.POST ON National Security and DiplomacyIt is nat.docx
New work.POST ON National Security and DiplomacyIt is nat.docxhenrymartin15260
 
MICROORGANISMS TEST.docx
MICROORGANISMS TEST.docxMICROORGANISMS TEST.docx
MICROORGANISMS TEST.docxNeeti Pal
 
Diffusion And Egg
Diffusion And EggDiffusion And Egg
Diffusion And EggSUNY Oswego
 
Egg Osmosis Experiment
Egg Osmosis ExperimentEgg Osmosis Experiment
Egg Osmosis ExperimentTia Hohler
 
Cellular RespirationHands-on labs, inc. Version 42-0040-00-01.docx
Cellular RespirationHands-on labs, inc.  Version 42-0040-00-01.docxCellular RespirationHands-on labs, inc.  Version 42-0040-00-01.docx
Cellular RespirationHands-on labs, inc. Version 42-0040-00-01.docxtidwellveronique
 
Project_3_waterkingdoms_SciencePub
Project_3_waterkingdoms_SciencePubProject_3_waterkingdoms_SciencePub
Project_3_waterkingdoms_SciencePubJessica Watson
 
Gr7module2forstudents 120920041248-phpapp01 (1)
Gr7module2forstudents 120920041248-phpapp01 (1)Gr7module2forstudents 120920041248-phpapp01 (1)
Gr7module2forstudents 120920041248-phpapp01 (1)Aiza Onda
 
Scientific Procedure
Scientific ProcedureScientific Procedure
Scientific ProcedureSamuel McCabe
 

Similar to investigations Diffusion and Osmosis (20)

Scienceprocesses and scientific method
Scienceprocesses and scientific methodScienceprocesses and scientific method
Scienceprocesses and scientific method
 
η μαγιά είναι ζωντανή;
η μαγιά είναι ζωντανή;η μαγιά είναι ζωντανή;
η μαγιά είναι ζωντανή;
 
Scientific Method
Scientific MethodScientific Method
Scientific Method
 
Clil win
Clil winClil win
Clil win
 
New work.POST ON National Security and DiplomacyIt is nat.docx
New work.POST ON National Security and DiplomacyIt is nat.docxNew work.POST ON National Security and DiplomacyIt is nat.docx
New work.POST ON National Security and DiplomacyIt is nat.docx
 
Exemplar 1
Exemplar 1Exemplar 1
Exemplar 1
 
Grade 1 School Garden Lesson Plan - Soil Lesson; Soil Soup ~ Massachusetts
Grade 1 School Garden Lesson Plan - Soil Lesson; Soil Soup ~ MassachusettsGrade 1 School Garden Lesson Plan - Soil Lesson; Soil Soup ~ Massachusetts
Grade 1 School Garden Lesson Plan - Soil Lesson; Soil Soup ~ Massachusetts
 
MICROORGANISMS TEST.docx
MICROORGANISMS TEST.docxMICROORGANISMS TEST.docx
MICROORGANISMS TEST.docx
 
Qtr 2 module 4 reproduction april27
Qtr 2 module 4 reproduction april27Qtr 2 module 4 reproduction april27
Qtr 2 module 4 reproduction april27
 
Grd 6-ns-tech-t1-2016-approved
Grd 6-ns-tech-t1-2016-approvedGrd 6-ns-tech-t1-2016-approved
Grd 6-ns-tech-t1-2016-approved
 
Pure cultures
Pure culturesPure cultures
Pure cultures
 
Diffusion And Egg
Diffusion And EggDiffusion And Egg
Diffusion And Egg
 
Egg Osmosis Experiment
Egg Osmosis ExperimentEgg Osmosis Experiment
Egg Osmosis Experiment
 
Cellular RespirationHands-on labs, inc. Version 42-0040-00-01.docx
Cellular RespirationHands-on labs, inc.  Version 42-0040-00-01.docxCellular RespirationHands-on labs, inc.  Version 42-0040-00-01.docx
Cellular RespirationHands-on labs, inc. Version 42-0040-00-01.docx
 
Project_3_waterkingdoms_SciencePub
Project_3_waterkingdoms_SciencePubProject_3_waterkingdoms_SciencePub
Project_3_waterkingdoms_SciencePub
 
Science fair steps
Science fair stepsScience fair steps
Science fair steps
 
Gr7module2forstudents 120920041248-phpapp01 (1)
Gr7module2forstudents 120920041248-phpapp01 (1)Gr7module2forstudents 120920041248-phpapp01 (1)
Gr7module2forstudents 120920041248-phpapp01 (1)
 
Gr 7 module 2 for students
Gr 7 module  2 for studentsGr 7 module  2 for students
Gr 7 module 2 for students
 
Scientific Procedure
Scientific ProcedureScientific Procedure
Scientific Procedure
 
Bls 206 lecture 3
Bls 206 lecture 3Bls 206 lecture 3
Bls 206 lecture 3
 

More from Nengah Surata

More from Nengah Surata (10)

Hidup Mantap
Hidup MantapHidup Mantap
Hidup Mantap
 
Soal fisika xi.1
Soal fisika xi.1Soal fisika xi.1
Soal fisika xi.1
 
GERAK PARABOLA
GERAK PARABOLAGERAK PARABOLA
GERAK PARABOLA
 
Soal fisika listrik..
Soal fisika listrik..Soal fisika listrik..
Soal fisika listrik..
 
Gerak melingkar
Gerak melingkarGerak melingkar
Gerak melingkar
 
Critical thinking physics problems
Critical thinking physics  problemsCritical thinking physics  problems
Critical thinking physics problems
 
Organic chemistry
Organic chemistryOrganic chemistry
Organic chemistry
 
Medical physics slide show
Medical physics slide showMedical physics slide show
Medical physics slide show
 
Newtons laws.pptx1
Newtons laws.pptx1Newtons laws.pptx1
Newtons laws.pptx1
 
Nature of light
Nature of lightNature of light
Nature of light
 

Recently uploaded

What is Model Inheritance in Odoo 17 ERP
What is Model Inheritance in Odoo 17 ERPWhat is Model Inheritance in Odoo 17 ERP
What is Model Inheritance in Odoo 17 ERPCeline George
 
GRADE 4 - SUMMATIVE TEST QUARTER 4 ALL SUBJECTS
GRADE 4 - SUMMATIVE TEST QUARTER 4 ALL SUBJECTSGRADE 4 - SUMMATIVE TEST QUARTER 4 ALL SUBJECTS
GRADE 4 - SUMMATIVE TEST QUARTER 4 ALL SUBJECTSJoshuaGantuangco2
 
Inclusivity Essentials_ Creating Accessible Websites for Nonprofits .pdf
Inclusivity Essentials_ Creating Accessible Websites for Nonprofits .pdfInclusivity Essentials_ Creating Accessible Websites for Nonprofits .pdf
Inclusivity Essentials_ Creating Accessible Websites for Nonprofits .pdfTechSoup
 
Daily Lesson Plan in Mathematics Quarter 4
Daily Lesson Plan in Mathematics Quarter 4Daily Lesson Plan in Mathematics Quarter 4
Daily Lesson Plan in Mathematics Quarter 4JOYLYNSAMANIEGO
 
4.18.24 Movement Legacies, Reflection, and Review.pptx
4.18.24 Movement Legacies, Reflection, and Review.pptx4.18.24 Movement Legacies, Reflection, and Review.pptx
4.18.24 Movement Legacies, Reflection, and Review.pptxmary850239
 
ENG 5 Q4 WEEk 1 DAY 1 Restate sentences heard in one’s own words. Use appropr...
ENG 5 Q4 WEEk 1 DAY 1 Restate sentences heard in one’s own words. Use appropr...ENG 5 Q4 WEEk 1 DAY 1 Restate sentences heard in one’s own words. Use appropr...
ENG 5 Q4 WEEk 1 DAY 1 Restate sentences heard in one’s own words. Use appropr...JojoEDelaCruz
 
Keynote by Prof. Wurzer at Nordex about IP-design
Keynote by Prof. Wurzer at Nordex about IP-designKeynote by Prof. Wurzer at Nordex about IP-design
Keynote by Prof. Wurzer at Nordex about IP-designMIPLM
 
Activity 2-unit 2-update 2024. English translation
Activity 2-unit 2-update 2024. English translationActivity 2-unit 2-update 2024. English translation
Activity 2-unit 2-update 2024. English translationRosabel UA
 
Earth Day Presentation wow hello nice great
Earth Day Presentation wow hello nice greatEarth Day Presentation wow hello nice great
Earth Day Presentation wow hello nice greatYousafMalik24
 
Karra SKD Conference Presentation Revised.pptx
Karra SKD Conference Presentation Revised.pptxKarra SKD Conference Presentation Revised.pptx
Karra SKD Conference Presentation Revised.pptxAshokKarra1
 
MULTIDISCIPLINRY NATURE OF THE ENVIRONMENTAL STUDIES.pptx
MULTIDISCIPLINRY NATURE OF THE ENVIRONMENTAL STUDIES.pptxMULTIDISCIPLINRY NATURE OF THE ENVIRONMENTAL STUDIES.pptx
MULTIDISCIPLINRY NATURE OF THE ENVIRONMENTAL STUDIES.pptxAnupkumar Sharma
 
Concurrency Control in Database Management system
Concurrency Control in Database Management systemConcurrency Control in Database Management system
Concurrency Control in Database Management systemChristalin Nelson
 
Student Profile Sample - We help schools to connect the data they have, with ...
Student Profile Sample - We help schools to connect the data they have, with ...Student Profile Sample - We help schools to connect the data they have, with ...
Student Profile Sample - We help schools to connect the data they have, with ...Seán Kennedy
 
INTRODUCTION TO CATHOLIC CHRISTOLOGY.pptx
INTRODUCTION TO CATHOLIC CHRISTOLOGY.pptxINTRODUCTION TO CATHOLIC CHRISTOLOGY.pptx
INTRODUCTION TO CATHOLIC CHRISTOLOGY.pptxHumphrey A Beña
 
Active Learning Strategies (in short ALS).pdf
Active Learning Strategies (in short ALS).pdfActive Learning Strategies (in short ALS).pdf
Active Learning Strategies (in short ALS).pdfPatidar M
 
Field Attribute Index Feature in Odoo 17
Field Attribute Index Feature in Odoo 17Field Attribute Index Feature in Odoo 17
Field Attribute Index Feature in Odoo 17Celine George
 

Recently uploaded (20)

FINALS_OF_LEFT_ON_C'N_EL_DORADO_2024.pptx
FINALS_OF_LEFT_ON_C'N_EL_DORADO_2024.pptxFINALS_OF_LEFT_ON_C'N_EL_DORADO_2024.pptx
FINALS_OF_LEFT_ON_C'N_EL_DORADO_2024.pptx
 
What is Model Inheritance in Odoo 17 ERP
What is Model Inheritance in Odoo 17 ERPWhat is Model Inheritance in Odoo 17 ERP
What is Model Inheritance in Odoo 17 ERP
 
GRADE 4 - SUMMATIVE TEST QUARTER 4 ALL SUBJECTS
GRADE 4 - SUMMATIVE TEST QUARTER 4 ALL SUBJECTSGRADE 4 - SUMMATIVE TEST QUARTER 4 ALL SUBJECTS
GRADE 4 - SUMMATIVE TEST QUARTER 4 ALL SUBJECTS
 
Inclusivity Essentials_ Creating Accessible Websites for Nonprofits .pdf
Inclusivity Essentials_ Creating Accessible Websites for Nonprofits .pdfInclusivity Essentials_ Creating Accessible Websites for Nonprofits .pdf
Inclusivity Essentials_ Creating Accessible Websites for Nonprofits .pdf
 
Daily Lesson Plan in Mathematics Quarter 4
Daily Lesson Plan in Mathematics Quarter 4Daily Lesson Plan in Mathematics Quarter 4
Daily Lesson Plan in Mathematics Quarter 4
 
4.18.24 Movement Legacies, Reflection, and Review.pptx
4.18.24 Movement Legacies, Reflection, and Review.pptx4.18.24 Movement Legacies, Reflection, and Review.pptx
4.18.24 Movement Legacies, Reflection, and Review.pptx
 
YOUVE_GOT_EMAIL_PRELIMS_EL_DORADO_2024.pptx
YOUVE_GOT_EMAIL_PRELIMS_EL_DORADO_2024.pptxYOUVE_GOT_EMAIL_PRELIMS_EL_DORADO_2024.pptx
YOUVE_GOT_EMAIL_PRELIMS_EL_DORADO_2024.pptx
 
Raw materials used in Herbal Cosmetics.pptx
Raw materials used in Herbal Cosmetics.pptxRaw materials used in Herbal Cosmetics.pptx
Raw materials used in Herbal Cosmetics.pptx
 
YOUVE GOT EMAIL_FINALS_EL_DORADO_2024.pptx
YOUVE GOT EMAIL_FINALS_EL_DORADO_2024.pptxYOUVE GOT EMAIL_FINALS_EL_DORADO_2024.pptx
YOUVE GOT EMAIL_FINALS_EL_DORADO_2024.pptx
 
ENG 5 Q4 WEEk 1 DAY 1 Restate sentences heard in one’s own words. Use appropr...
ENG 5 Q4 WEEk 1 DAY 1 Restate sentences heard in one’s own words. Use appropr...ENG 5 Q4 WEEk 1 DAY 1 Restate sentences heard in one’s own words. Use appropr...
ENG 5 Q4 WEEk 1 DAY 1 Restate sentences heard in one’s own words. Use appropr...
 
Keynote by Prof. Wurzer at Nordex about IP-design
Keynote by Prof. Wurzer at Nordex about IP-designKeynote by Prof. Wurzer at Nordex about IP-design
Keynote by Prof. Wurzer at Nordex about IP-design
 
Activity 2-unit 2-update 2024. English translation
Activity 2-unit 2-update 2024. English translationActivity 2-unit 2-update 2024. English translation
Activity 2-unit 2-update 2024. English translation
 
Earth Day Presentation wow hello nice great
Earth Day Presentation wow hello nice greatEarth Day Presentation wow hello nice great
Earth Day Presentation wow hello nice great
 
Karra SKD Conference Presentation Revised.pptx
Karra SKD Conference Presentation Revised.pptxKarra SKD Conference Presentation Revised.pptx
Karra SKD Conference Presentation Revised.pptx
 
MULTIDISCIPLINRY NATURE OF THE ENVIRONMENTAL STUDIES.pptx
MULTIDISCIPLINRY NATURE OF THE ENVIRONMENTAL STUDIES.pptxMULTIDISCIPLINRY NATURE OF THE ENVIRONMENTAL STUDIES.pptx
MULTIDISCIPLINRY NATURE OF THE ENVIRONMENTAL STUDIES.pptx
 
Concurrency Control in Database Management system
Concurrency Control in Database Management systemConcurrency Control in Database Management system
Concurrency Control in Database Management system
 
Student Profile Sample - We help schools to connect the data they have, with ...
Student Profile Sample - We help schools to connect the data they have, with ...Student Profile Sample - We help schools to connect the data they have, with ...
Student Profile Sample - We help schools to connect the data they have, with ...
 
INTRODUCTION TO CATHOLIC CHRISTOLOGY.pptx
INTRODUCTION TO CATHOLIC CHRISTOLOGY.pptxINTRODUCTION TO CATHOLIC CHRISTOLOGY.pptx
INTRODUCTION TO CATHOLIC CHRISTOLOGY.pptx
 
Active Learning Strategies (in short ALS).pdf
Active Learning Strategies (in short ALS).pdfActive Learning Strategies (in short ALS).pdf
Active Learning Strategies (in short ALS).pdf
 
Field Attribute Index Feature in Odoo 17
Field Attribute Index Feature in Odoo 17Field Attribute Index Feature in Odoo 17
Field Attribute Index Feature in Odoo 17
 

investigations Diffusion and Osmosis

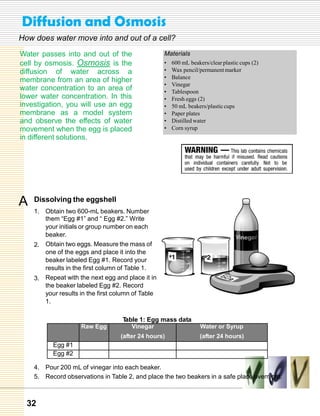
  • 1. Diffusion and Osmosis How does water move into and out of a cell? Water passes into and out of the cell by osmosis. Osmosis is the diffusion of water across a membrane from an area of higher water concentration to an area of lower water concentration. In this investigation, you will use an egg membrane as a model system and observe the effects of water movement when the egg is placed in different solutions. A Materials • • • • • • • • • • 600 mL beakers/clear plastic cups (2) Wax pencil/permanent marker Balance Vinegar Tablespoon Fresh eggs (2) 50 mL beakers/plastic cups Paper plates Distilled water Corn syrup Dissolving the eggshell 1. Obtain two 600-mL beakers. Number them “Egg #1” and “ Egg #2.” Write your initials or group number on each beaker. 2. Obtain two eggs. Measure the mass of one of the eggs and place it into the beaker labeled Egg #1. Record your results in the first column of Table 1. 3. Repeat with the next egg and place it in the beaker labeled Egg #2. Record your results in the first column of Table 1. . Raw Egg T able 1: Egg mass data Vinegar (after 24 hours) Water or Syrup (after 24 hours) Egg #1 Egg #2 4. Pour 200 mL of vinegar into each beaker. 5. Record observations in Table 2, and place the two beakers in a safe place overnight. 32
  • 2. Investigation 6A Diffusion and Osmosis . Egg #1 Egg #2 Egg #1 Egg #2 Egg #1 Egg #2 T able 2: Egg experiment observations Day Observations 1 1 2 2 3 3 6. Observe the eggs the next day, and record your observations in Table 2. 7. Slowly pour the vinegar out of each beaker. Be very careful not to rupture the egg cell membrane. 8. Carefully remove the egg using the tablespoon, rinse with water, and place each egg on its own labeled paper plate. 9. Measure the mass of each egg. 10. Record this information in the second column of Table 2. . B a. Stop and think What was the effect of placing both eggs into vinegar overnight? b. What happened to the mass of each egg after being placed into vinegar overnight? Use what you know about osmosis and diffusion to explain the results. c. If you think of the egg as a “cell,” what does the fluid inside of the egg represent? What does the membrane that surrounds the cell represent? d. In the next part of the investigation, you will place Egg #1 into a beaker containing distilled water and Egg #2 into a beaker containing corn syrup. Based on what you know, what do you think will happen to the mass of the egg when placed in distilled water overnight? In corn syrup overnight? C Placing the eggs into different solutions 1. Return the eggs to their respective beakers. 2. Pour distilled water into the Egg #1 beaker until the egg is completely covered. 3. Pour corn syrup into the Egg #2 beaker until the egg is completely covered. If the egg floats, place a cup with water on top of the egg to keep it submerged. 4. Place the two beakers in a safe place overnight. 5. After 24 hours, observe each egg, and record your observations in Table 2. 6. Slowly pour the water and syrup out of the respective beaker. Be very careful not to rupture the egg membrane. 33
  • 3. 7. Carefully remove the egg using the tablespoon, rinse with water, and place each egg on its own labeled paper plate. 8. Measure the mass of each egg. 9. Record this information in the third column of Table 1. 10. Return the eggs to their respective beakers, and wait for your teacher to collect them. D a. Thinking about what you observed In the Stop and think section above (question d), you were asked to predict what would happen to each egg in the experiment. How did your results compare with your prediction? b. Which beaker contained a greater concentration of water compared with the concentration of water in the egg, the one labeled Egg #1 or the one labeled Egg #2? c. After 24 hours, did Egg #1 contain more, less, or the same amount of water as it did before the experiment? What is your evidence? d. After 24 hours, did Egg #2 contain more, less, or the same amount of water as it did before the experiment? What is your evidence? e. Use the terms concentration, osmosis, diffusion to explain why water moved into one egg and out of the other. E Exploring on your own a. What would happen if you left the eggs in water and syrup for a longer period of time (another day, for example)? Is it possible to return the eggs to their original state before placing them into distilled water or corn syrup? b. What would happen if you placed the egg originally in corn syrup (Egg #2) into distilled water? Could you restore the egg to its original state? c. What would happen if you placed the egg originally in water (Egg #1) into syrup? Would it shrink? Try it. 34
  • 4. Investigation 6B Photosynthesis and Color 6B Photosynthesis and Color Does the color of light affect photosynthesis? Living organisms, both plant and animal, contain chemicals known as pigments. A pigment’s color is determined by the wavelengths of light that the pigment reflects. Plant leaves contain chlorophyll, a pigment that is vital to photosynthesis. In this investigation we will find out which colors of light are needed by chlorophyll to sustain photosynthesis. A Materials • • • • • • • • Four small potted plants Plant grow light (75 W) Red light (75 W) Blue light (75 W) Green light (75 W) Four light fixtures Water Thermometer Setting up Plants use sunlight in their natural habitat to produce energy through the process of photosynthesis. Sunlight is a pure white light, made up of all the colors together. What do you think would happen to plants if we didn’t use white light, but instead used individual colors of light? 1. Find a place in your classroom where you can set up the four lights and four small potted plants. You may need to place small cardboard dividers between the plants to make sure only the specific color of light you want falls on each plant. 2. Label each plant with the color of light. All of your plants should be in similar condition and approximately the same size. 3. Once the plant/light set up is in place, put a thermometer in one of the plant areas to monitor temperature. You won’t keep track of the temperature, but you will check it periodically to make sure the plants don’t get too hot. This may harm them and spoil the experiment. 35
  • 5. B a. Stop and think What is the experimental variable in this experiment? b. What are the control variables? c. Make a hypothesis stating how you think the color of light used will effect each plant. Think about the color of your plant. What color or colors is it reflecting? What colors or colors is it absorbing? C Doing the experiment 1. The experiment begins when the lights are turned on. Discuss with your teacher if you will be using a 12-hour timer to turn the lights on or off, if this will be done manually, or if they will be on 24 hours a day. 2. Decide with your group if and/or how you want to water your plants. 3. Check on your plants each day and record your observations in your journal. Use a data table like Table 1 below to record your observations. Include a column to describe the initial condition of your plants. . T able 1: Plant growth/health data Day Color Initial condition Change in condition Grow light Red Green Blue D a. Thinking about what you observed What color is your plant? If that particular color is getting to your eyes from the plant, is the plant reflecting or absorbing that color? b. What is the plant doing with the colors it absorbs? c. Which color(s) of light you tested seem to support photosynthesis? d. Which color(s) of light you tested did not seem to support photosynthesis? e. Starting from the sun, describe the process that allows you to see the color of your plant. f. Why do certain colors support photosynthesis while others do not? 36
  • 6. Investigation 7A Protozoans 7A Protozoans What are the characteristics of protozoans? Most organisms in the Kingdom Protozoa consist of a single cell. How do these organisms move and gather food? In this investigation, you will examine amoeba, paramecium and euglena using the light microscope. You will observe their movement and characteristics. You will also develop a hypothesis about how each organisms gets food. A Materials • • • • • • • • • Live euglena culture Live amoeba culture Live paramecium culture Depression slides Coverslips Corn syrup Light microscope Toothpicks Dropper Preparing slides of live protozoans Observing amoeba 1. Place two drops of water into the chamber of the depression slide. 2. Slowly place a dropper into the amoeba culture. Be sure to place the dropper at the bottom of the culture since the amoeba will be located at the bottom of the jar. 3. Remove the dropper and place a single drop of the culture into the chamber of your compression slide. 4. Carefully, place a cover slip on top of the chamber and place under the microscope. 5. Using your medium power, bring the amoeba into view. 6. Once you have found the amoeba, switch to your high-power objective. 7. Make a sketch of what you observe under the microscope in Table 1. 8. Observe the movement of the amoeba and record your observations in Table 1. Observing Paramecium and Euglena 1. Wash and thoroughly dry the chamber of the compression slide. 2. Repeat steps 1-3 above. 3. Place a drop of corn syrup into the chamber of the depression slide. Protozoa are very fast and corn syrup will slow the organisms so they may be viewed more easily under the microscope. 4. Place a single drop of paramecium culture into the chamber of the depression slide. 5. Using a toothpick carefully mix the corn syrup and the paramecium. 6. Carefully, place a cover slip on top of the chamber and place under the microscope. 7. Using your medium-power objective, bring the paramecium into view. 8. Once you have found the paramecium, switch to your high-power objective. 9. Sketch a picture of what you observe under the microscope in Table 1, paramecium. 10. Observe the movement of the paramecium and record your observations in Table 1. 11. Repeat the procedures this time using the euglena culture. 37
  • 7. . Amoeba T able 1: Protozoa observations Paramecium Observations: B a. Observations Euglena Observations: Thinking about what you observed Describe the way each organism (amoeba, paramecium, and euglena) moves. Which ones have structures for movement? Do those structures look like? b. Do any of the organisms have a structure that resembles a mouth? Make a hypothesis about how each organism feeds. c. Use the diagram (at left) to help you identify the structures of each organism. Label the structures you observed in your sketches. C Exploring on your own Protozoans are everywhere and will make their homes in a variety of water sources. Some protozoans cause sickness in humans. One species called Giardia lamblia is closely related to paramecium. It lives in freshwater sources. Research Giardia and write a short report. Use the key word “Giardia” in your Internet search. Include in your report the following information: a. Where is Giardia found? How do people contract the disease? b. What are the symptoms of the disease caused by Giardia? c. How is the disease treated? d. How can the disease caused by Giardia be prevented? 38
  • 8. Investigation 7B Investigating Pond Water 7B Investigating Pond Water Which microscopic organisms are found in pond water? If you took a single drop of water from a pond and looked at it under the microscope, you’d be lucky to find anything. To increase the number of organisms in your sample you can create a hay infusion. A hay infusion is a culture that uses water collected from a pond, stream, creek, or puddle and dried grass. You simply place dry grass a container of water and allow the culture to sit for approximately one week. At the end of the week, the culture will be teeming with different types of small microscopic organisms. In this investigation, you will make a hay infusion and then using what you have already learned, try to identify the microorganisms. A Materials • • • • • • • • • • Glass jar Pond or creek water Hay or dry grass Milk Yeast Depression slides Coverslips Corn syrup Light microscope Dropper Setting up 1. Place pond water into the glass jar until the jar is about half-filled. 2. Add several pieces of cut hay or dry grass to the jar. 3. Add a teaspoon of milk and a grain of yeast. 4. Loosely cover the jar with the lid. [Be sure not to tighten the lid of the jar completely since the organisms need oxygen.] 5. Place the jar in a warm place, in front of a window or in an incubator. 6. Check the hay infusion periodically, although it will take about a week for the organism growth to peak, spot checking the culture will ensure you see lots of different organisms. Safety tip: The hay infusion will contain a large number of bacteria. Make sure you wash your hands completely after handling the hay infusion, samples, and depression slides. 39
  • 9. B a. Stop and think What types of organisms do you think you will find under the microscope after a week? b. Why is it important not to tighten the lid of the jar completely? C Doing the experiment 1. Place a drop of water into your depression slide chamber. 2. Place a single drop of corn syrup into the well of the depression slide chamber. The corn syrup will slow the movement of the organisms without harming the organisms. Remove jar’s lid. Take a small drop of the 3. water from the top of the jar and place it into the depression slide chamber. Carefully, place a cover slip on top of the 4. chamber and place under the microscope. Using your low-power objective, bring the 5. sample into focus. It is important to remember that the organisms will be moving quickly, so this step can be tricky. Once you have found the correct plane of 6. focus, switch to the high-power objective. Make a sketch of what you observe under the microscope. It is possible you will see a 7. number of organisms, and this is good. Make a careful sketch of every organism you see. Once you have completed Steps 1-7, wash and thoroughly dry the chamber of the compression slide. 8. Repeat the procedures with drops of water taken from different areas of the jar. 9. 10. Once you have completed your drawings, try to identify the organisms you have observed in your hay infusion. A sheet of photos will be provided by your teacher. Use other resources such as books or the Internet if needed. 40
  • 10. Investigation 7B Investigating Pond Water . Sample Location: (top, middle, bottom) D a. T able 1: Hay infusion observations Sketch of the Organism Name of organism Thinking about what you observed How many different types of organisms did you identify? b. What type of information did you use to help you identify the different organisms in your hay infusion? c. Is there a difference between the types of organisms you observed at the bottom, middle, and top of the jar? d. What sample contained the largest number of different organisms? e. Which organisms belong to the Kingdom Protista? Which organisms do not? 41
  • 11. 8A Observing the Cell Cycle How much time is spent in different stages of the cell cycle? The life cycle of a cell is called the cell cycle. Interphase is the period a cell spends growing and performing its functions. Mitosis is the part of the cell cycle where the chromosomes are divided into two new nuclei. Two daughter cells are formed, each containing a complete set of chromosomes. Mitosis has 4 phases: prophase, metaphase, anaphase, and telophase. After mitosis, the cytoplasm and its contents divide, separating the daughter cells (cytokinesis). In this investigation, you will determine the percentage of time a cell spends in interphase and the four stages of mitosis. A Materials • • • • • Prepared whitefish blastula slides Prepared onion root tip slides Textbook Pencil for sketching Graph paper Setting up 1. Set up a microscope and turn on the light. 2. On the stage, place a slide containing a stained preparation of Allium (onion root tip). 3. Locate the growth zone of the onion root tip. It is just above the root cap at the very end. 4. Focus on low power, and then switch to medium or high power. Below are pictures of the four stages of mitosis. Use them to help you identify the different stages on the microscope slide. 42
  • 12. Investigation 8A B a. Observing the Cell Cycle Stop and think How do the chromosomes look at each stage of the cell cycle (interphase, prophase, metaphase, anaphase, and telophase)? b. Why is it important to recognize the differences in the appearance of the chromosomes at different stages? C Doing the experiment 1. Count the number of cells in interphase, prophase, metaphase, anaphase, and telophase. You’ll have to move the slide around several times until you have covered the entire growth region. Record your data in Table 1 below. 2. Add up the total number of cells you counted and enter that value in Table 1. 3. Determine the percentage of time each cell will spend in each stage of the cell cycle. Use this formula: (Number of cells in phase total number of cells) 100 Record your values in Table 1. T able 1: Number of cells and percentages Stage of cell cycle Number of cells in each stage Time spent in each stage (%) Interphas e Prophas e Metaphas e Anaphas T e elophase 4 D a. Thinking about what you observed Make a line or bar graph of the data in Table 1. Place time spent on the x-axis and number of cells on they y-axis. b. Of the four stages of mitosis, which one takes the most time to complete? Which is the shortest stage in duration? c. Cytokinesis is a stage in the cell cycle that happens right after mitosis. In this stage, the cytoplasm is divided and the two daughter cells are separated. See if you can find an example of cytokinesis on your Allium slide. d. Obtain a prepared slide of animal cells (whitefish blastula). Try to identify and sketch cells in different stages of the cell cycle. Make a sketch of a cell in interphase, prophase, metaphase, telophase, and anaphase. Try to identify and sketch cells in cytokinesis. e. How is cytokinesis different in the animal cell? 43
  • 13. 8B Modeling Mitosis and Meiosis How do sex cells end up with a haploid set of chromosomes? You may have seen fruit flies buzzing around a bowl of fruit. They are tiny, but if you look closely you may see red or white eyes. Like all living organisms, fruit flies grow and reproduce. The diploid number of chromosomes in fruit flies is 8. In this investigation you will simulate mitosis and meiosis in fruit flies. Through the simulation you will identify how fruit fly sex cells end up with only 4 chromosomes; a haploid set. A Materials • 16 pipe cleaners of 2 different colors and 4 matching lengths • Poster board or large piece of paper • Marker • O-shaped cereal • Colored pencils (red, green, blue, yellow) Setting up 1. Copy the chart (right) onto a piece of poster board. The circles represent a fruit fly body cell in different stages of the cell cycle and mitosis. 2. Your teacher will give you a set of pipe cleaners to represent chromosomes. One color will represent the mother and the other color will represent the father. Since chromosomes occur in homologous pairs, use the same length of pipe cleaner for each homologous pair. You should have two sets of four different lengths of pipe cleaners. 3. Begin by assembling a diploid set of chromosomes for a fruit fly as they exist during most of interphase (step 1 on the board). A diploid set contains pairs of homologous chromosomes. Each chromosome at this point will be a single strand. You will have an extra set of each length and color left over. Here is a diploid set: B a. Stop and think What is the diploid number of chromosomes in a fruit fly? b. How many homologous pairs of chromosomes does a fruit fly have? c. In the diagram (right), name the steps that are part of mitosis. d. Which steps are part of the rest of the cell cycle? 44
  • 14. Investigation 8B C Modeling Mitosis and Meiosis Modeling mitosis 1. In late interphase (step 2 on your board), the amount of DNA doubles. That means each chromosome now doubles. Select a matching pipe cleaner (same length and color) for each chromosome and slide both through a piece of cereal. You now should have a set of eight doubled chromosomes arranged in homologous pairs. 2. Review the mitosis diagram in Chapter 8 of your textbook and move the chromosomes through the rest of the steps on your board. D a. Applying your knowledge Fill in Table 1 with the correct information. T able 1: Cell cycle and mitosis in fruit flies Step Number of cells Number of chromosomes in each nucleus Number of homologous pairs in each nucleus Interphase Cytokinesis b. What is the purpose of mitosis? c. A diploid set of human chromosomes contains 23 homologous pairs (46 chromosomes). Fill in Table 2 with the correction information regarding human body cells. T able 2: Cell cycle and mitosis in humans Step Number of cells Number of chromosomes in each nucleus Number of homologous pairs in each nucleus Interphase Cytokinesis d. Why is it necessary to double the amount of genetic material before mitosis begins? e. The two daughter cells end up with an exact copy of the genetic material from the parent cell. How does your simulation support this statement? 45
  • 15. E Modeling meiosis Meiosis is the process of producing sex cells with a haploid set of chromosomes. Haploid means half the number of chromosomes as the original cell. A haploid cell contains one chromosome from each homologous pair. 1. Turn over your poster board and copy the diagram (right) onto the other side. Fill the entire space on the board with your drawing. 2. Begin by assembling a diploid set of chromosomes for the fruit fly as you did in part 1. Place the chromosomes, in homologous pairs, in the first nucleus on your poster. 3. Like mitosis, before meiosis begins, the chromosomes double. Add a similar pipe cleaner to each chromosome and attach with a piece of cereal as you did in part 1. 4. Unlike mitosis which has only one cell division, meiosis has two divisions (meiosis I and meiosis II). Using the meiosis diagram in Chapter 8 of your textbook as a guide, move your chromosomes through meiosis I and meiosis II. 5. Fill in Table 3 below as you move your chromosomes through the chart. T able 3: Meiosis Step Number of cells Number of chromosomes in each cell Number of homologous pairs in each cell Diploid or haploid number? Start of meiosis End of meiosis I End of meiosis II F a. Thinking about what you observed What happens to the homologous pairs of chromosomes in meiosis I? b. At the end of meiosis I, how does the number of chromosomes in each new cell compare to the original number of chromosomes in the parent cell? (Is it diploid or haploid?) c. At the end of meiosis II, how does the number of chromosomes in each new cell compare to the original number of chromosomes in the parent cell? 46
  • 16. Investigation 8B G Modeling Mitosis and Meiosis Exploring on your own If time permits, you can model what happens during fertilization. 1. Sketch the chart (right) onto a blank piece of paper. 2. Remove the chromosomes from a sex cell you created during the investigation and combine this with the chromosomes of a sex cell from a different group. This is less complicated if you combine with a group that has different color pipe cleaners from yours. a. What is the end result of fertilization in terms of chromosome number? b. Do the cells of the new organism have a diploid or haploid set of chromosomes? c. What would happen if the sperm cell and egg cell did not reduce the number of chromosomes before fertilization? Model this with two diploid sets of chromosomes. d. You have 23 pairs of chromosomes in your body cells. Why do your chromosomes occur in pairs? For each pair, where does each chromosome come from? 47
  • 17. 9A Observing Human T raits How much do traits vary in your classroom? Traits are physical characteristics you inherit from your parents. In this investigation, you will take an inventory of your observable traits and compare these to the observable traits of your classmates. You will then take inventory of students and teachers in your school. Finally, you will determine the frequency of each trait in your school’s population. A Materials • PTC paper • Pencils • Calculator Observing your own traits The graphic below shows seven different human traits. Each Study the chart below, then follow the procedures carefully. trait has two different forms. 1. Working with a partner, observe which form you have for trait A through F. Circle your form of each trait in Table 1. NOTE: For finger hair, even if you have only one hair on any of your mid-digits, you have finger hair. 2. Wash and dry your hands. For trait G, your teacher will give you and your partner a piece of PTC paper. Taste the paper and circle your form of the trait in Table 1. Safety tip: Never taste any substance in the laboratory unless directed by your teacher. 48
  • 18. Investigation 9A Observing Human Traits 1 Trait A. Earlobe B. Dimples C. Chin D. Hairline E. Finger hair F. Thumb G. PTC tasting B a. T able 1: Inventory of traits Form 1 Free Absent Cleft Widow’s peak Present Straight thumb Can taste Form 2 Attached Present No cleft Straight Absent Hitchhiker’s thumb Cannot taste Stop and think For earlobes only, how many students in your class do you think will share the same form (free or attached) as you? Explain your reasoning. b. Do you think any of your classmates will have the same form of all traits as you? Make a prediction about how many of your classmates will have the same form of all seven traits as you. C Collecting class data 1. Enter your results in the chart your teacher has placed on the chalkboard or overhead projector. 2. Record the numbers from the chart into columns 2 and 4 of Table 2 below. T able 2: Class data for observable traits Trait Number of Frequency of Number of Frequency of students with students with students with students with Form 1 Form 1 Form 2 Form 2 A. Earlobe B. Dimples C. Chin D. Hairline E. Finger hair F. Thumb G. PTC tasting 3. Calculate the frequency of each form of the trait for your class. Use this formula: (No. of students with form of trait T otal number of students in class) 100 4. Make a bar graph of the data in Table 2. Your graph should compare frequencies for each form of each trait. Put traits on the x-axis and frequency on the y-axis. 5 49
  • 19. D a. Thinking about what you observed For each trait, which form was most common, Form 1 or Form 2? b. Why do you think one form is more common than the other? c. Do you think your classroom population is typical of a larger population such as your entire school or community? Explain your answer. d. Traits are controlled by factors called genes. For each trait listed in Table 1, you get one gene from your mother and one gene from your father. For each trait, there is a dominant form and a recessive form. The dominant gene masks the effect of the recessive gene for the trait. Based on your class data, which form of each trait do you think is the dominant form? Explain your answer. e. The dominant and recessive forms for each trait you studied are listed below. Was the recessive form of any trait more frequent than the dominant form? Make a hypothesis that explains this result. Trait A. Earlobe B. Dimples C. Chin D. Hairline E. Finger hair F. Thumb G. PTC tasting E a. Dominant form Recessive form Free No dimples Cleft present Widow’s peak Attached Dimples present No cleft Straight Finger hair present Straight thumb Taster No finger hair Hitchhiker’s thumb Non-taster Exploring on your own Pick any trait (except for PTC tasting) and gather data about the trait from a larger population. Examples of a larger population include your school, neighborhood, and place of worship. Follow these steps: 1. Make a hypothesis about what you will observe. 2. Collect data from as many people as you can and record your results in a data table. 3. Graph your data. 4. Present your results to the class for discussion. b. Do you think people who are related to each other would show more similarity among the seven traits than unrelated people? Design an experiment to test your hypothesis. 3 4 50
  • 20. Investigation 9B Crazy Traits 9B Crazy T raits What role does chance play in an organism’s heredity? Your traits are determined by the genes you inherit from your parents. For each gene, you get at least one allele from your mother and one allele from your father. The alleles you end up with are determined by two factors: (1) the genotypes of your parents; and (2) the allele from each parent you inherit. The alleles you inherit from each parent are determined by chance. In this investigation, you will play a game that will help you learn about inheritance. A Materials • Crazy Traits game • Name tags • Markers Determining the genotype 1. The first trait you will flip for is gender. Choose the male sex chromosome coin (X on one side and Y on the other) and the female sex chromosome coin (X on both sides). Place both coins in the plastic cup and shake. Toss the coins onto the table and record your results in Table 1. 2. Next, flip coins to determine the allele for each of the other traits your creature inherits from each parent. In this activity, we will assume that both parents have the same genotype for all traits (Tt). You will need a blue (egg) coin with a capital T on one side and a lower case t on the other side. You will also a green (sperm) coin with a capital T on one side and a lower case t on the other side. 3. Flip the coins for the next trait—skin color. Place the coins in the plastic cup. Shake the cup and toss the two coins onto the lab table. The side that lands up on each coin represents the sperm and egg that unite during fertilization. Record the allele from each parent and genotype in columns 2, 3, and 4 of the first row of Table 1. 4. Repeat this procedure for traits 2 through 14. B a. Stop and Think What information do the letters on the sperm and egg coins indicate: alleles, genotype, or phenotype? b. For the sperm coin, what are the chances of getting a T or getting a t? State your answer as a fraction and a percent. c. For the egg coin, what are the chances of getting a T or getting a t? State your answer as a fraction or a percent. d. When both coins are flipped at once, what are your chances of getting each of the following combinations: TT, Tt, or tt? Make a punnett square to show the cross. State your answer for each as a fraction and a percent. 51
  • 21. . Trait 1. 2. 3. 4. 5. 6. 7. 8. 9. 10. 11. 12. T able 1: Genotypes and phenotypes of offspring for Part 1 Allele from Allele from Genotype Phenotype mother father Gender Skin color Leg Foot Arms Hands Eye color Eyebrows Beak Ears Antenna Antenna shape 13. Tail 14. Wings C Building your creature 1. Once you have completed columns 2 through 4 of Table 1, use Table 2 (next page) to look up the phenotype for each trait. Record the phenotype for each trait in column 5 of Table 1. 2. Once you have completed Table 1, select the correct body parts to build your creature. 3. Carefully assemble your creature. 4. Give your creature a name and make it a name tag. Write the gender of your creature on the name tag. 5. Place your creature on the table at the front of your classroom. D a. Thinking about what you observed Examine the creatures. Do any of them look exactly alike? Why or why not? b. How does this investigation explain why siblings may resemble each other, but never look exactly alike (unless they are identical twins)? c. Count the number of males and number of females. Does the number of each match the chances of getting a male or female in the game? Why or why not? d. Which trait(s) are examples of complete dominance? e. Which trait(s) are examples of incomplete dominance? f. Which trait(s) are examples of codominance? 52
  • 22. Investigation 9B Crazy Traits . Trait T able 2: Key to genotypes and phenotypes Genotypes and phenotypes 1. Gender XX - female XY - male 2. Skin color TT - red Tt - purple tt - blue 3. Leg TT - short Tt - short tt - long 4. Foot TT - webbed Tt - webbed tt - talons 5. Arms TT - long Tt - long tt - short 6. Hands TT - paws Tt - paws tt - claws 7. Eye color TT - red Tt - one red and one green tt - green 8. Eyebrows TT - unibrow Tt - unibrow tt - separate 9. Beak TT - trumpet Tt - trumpet tt - crusher 10. Ears TT - elephant Tt - elephant tt - mouse 11. Antenna TT - long Tt - long tt - short 12. Antenna shape TT - knob Tt - knob tt - star 13. Tail TT - long Tt - short tt - none 14. Wings TT - no wings Tt - no wings tt - wings E Exploring on your own If time permits, work with another group whose creature is the opposite gender. Follow the steps below to create offspring of the couple: 1. Record the genotypes of each parent in the first column of Table 3 on the next page. 2. First, toss for gender using the male and female sex chromosome coins. 3. For each trait, you’ll need to use the correct egg and sperm coins for each parent. Use the data in Table 1 to find the parents’ genotype for each trait. Then, select the egg and sperm coin that has the same alleles as the genotype. For example, if the father’s genotype for skin color is TT, choose the sperm coin that has a capital T on both sides of the coin. If the mother’s genotype for skin color is tt, place the egg coin that has a lower case t on both sides of the coin. 4. Place both coins in the plastic cup, shake, and toss out onto the table. Record your results in the fourth column of Table 3. 5. Use Table 2 to look up the phenotypes. Record the phenotypes of the offspring in the last column of Table 3. 53
  • 23. . Trait 1. 2. 3. 4. 5. 6. Gender Skin color Leg Foot Arms Hands 7. 8. 9. 10. 11. T able 3: Offspring genotypes and phenotypes for Part 5 Genotype of Genotype of Genotype of Phenotype of offspring mother for father for the offspring the trait trait (after flipping) Eye color Eyebrows Beak Ears Antenna 12. Antenna shape 13. Tail 14. Wings F a. Applying what you learned Which parent does your offspring share the most traits with, the mother, father, or both equally? b. Why do you need to choose different egg and sperm coins for each trait and for each parent? c. What is the process that flipping the sex cell coins represents? Why is this process important? d. There is always a 50% chance of having a male offspring. Explain why this statement is true. You may use a diagram to help explain. e. In part 1, you started off with both parents having identical genotypes for all traits. Use what you have learned in the investigation to explain why this is unrealistic in nature. f. CHALLENGE! Make punnett squares to show possible genotypes and phenotypes for each trait you flipped for in Part 5. For each, list the chances for each phenotype as a ratio and as a percent. 54
  • 24. Investigation 10A The DNA Molecule 10A The DNA Molecule What is the structure of the DNA molecule? Deoxyribonucleic acid (DNA) is the hereditary molecule. DNA is made of individual units called nucleotides. Each nucleotide is made of a phosphate group, a sugar (deoxyribose), and a nitrogen base. The DNA molecule looks like a twisted ladder. The phosphate and sugar form the sides of the molecule. Each rung contains a pair of bases held together by hydrogen bonds. There are four bases: thymine (T), adenine (A), guanine (G), and cytosine (C). T and A always pair up and G and C always pair up. In this investigation you will model the structure of DNA using beads to represent the different parts of the DNA molecule. Materials • • • • • • • Red pop beads White pop beads Yellow pop beads Green pop beads Orange pop beads Blue pop beads Clear plastic connectors . A Setting Up 1. Gather the required materials. Use Table 1 as a key for creating your DNA model. . T able 1: DNA model components Pop bead color Molecule Red Phosphate group White Sugar (deoxyribose) Bases: Blue Cytosine (C) Orange Guanine (G) Yellow Adenine (A) Green Thymine (T) 55
  • 25. B Doing the Experiment 1. Begin by creating two phosphate-sugar “backbones” that will provide the framework on which to build each strand of your DNA molecule. Connect alternating white and red pop beads. Each backbone should contain 10 red pop beads and 10 white pop beads. Repeat step 1 to create the second phosphate-sugar backbone. 2. Attach a base to each sugar on one of the phosphate-sugar backbones. We will call this 3. the original DNA strand. At this point, the order of the bases does not matter. Use blue to represent C, orange to represent G, yellow to represent A and green to represent T (see Table 1). Once you have created the original DNA strand, complete the first two columns of Table 4. 2. Place the color of the bead followed by the letter of the base in order as they appear in your model. . Original strand pop bead color T able 2: DNA molecule data Complimentary strand base complimentary base pop bead color 5. Once you have indicated the sequence of bases on the original DNA strand in Table 2, determine the base sequence for the complimentary DNA strand. Remember, T always pairs with A and G always pairs with C. 6. In Table 2, indicate the name of the complementary base and the color of the corresponding pop bead. 7. Using the second phosphate-sugar backbone that you created in step 2, make the complementary DNA strand using the information contained in Table 2. 8. Once you have created the complimentary DNA strand, use the clear plastic connectors to “bond” the base pairs together. These connectors represent the weak bonds that keep the base pairs together. 9. Draw a sketch of your DNA molecule in Table 3. 10. Hold the model from the top, and gently twist the DNA ladder to the right. You should see that the DNA looks like a spiral staircase. The model now represents the helical structure of DNA. Your teacher may instruct you to take your model and attach all the DNA models together to make a longer strand of DNA. Do not do this until instructed by your teacher. 56
  • 26. Investigation 10A The DNA Molecule . T able 3: DNA molecule sketch C a. Thinking about what you observed Which molecules make up the backbone of the DNA molecule? b. Why is DNA called “deoxyribose nucleic acid”? c. What type of bond keeps the bases paired together? d. Which base always pairs with adenine? Which base always pairs with cytosine? D Exploring on your own Watson and Crick were awarded the Nobel Prize for their work in determining the structure of DNA. However, the work of many scientists led to the final determination of the structure of DNA. One such scientist was Rosalind Franklin. Do some research (library or internet) to learn more about Rosalind Franklin. Try and figure out what she was studying and why this helped Watson and Crick determine the structure of DNA. Think about why her research might have gone unnoticed for so long. 57
  • 27. 10B DNA Forensics How can DNA be used to solve a “crime?” You have learned that DNA is the molecule that carries the hereditary information. Each individual is genetically unique, except in cases of identical twins, and as a result your DNA becomes a molecular fingerprint. This molecular fingerprint can be used to identify an individual with a great degree of certainty and is used in the field of forensic science. Scientists use DNA left at crime scenes to identify a person who may have been involved in a crime. In this Investigation, you will use DNA to solve a fictional crime. A Materials • • • • • • • • • Red pop beads White pop beads Yellow pop beads Green pop beads Orange pop beads Blue pop beads Clear plastic connectors DNA sequences Envelope containing the identity of the DNA sequence Doing the Experiment Today, someone left your teacher an apple with a note, “You are a super teacher!” But between the time the apple was left and the time your teacher returned to class, a bite has been taken out of it! Imagine that DNA has been collected from the “crime scene.” A DNA sample has also been collected from suspects. Your lab group will help solve the case by building a portion of a DNA molecule from one of the suspects. Then, you will compare your DNA model with others in the class. Can you solve the mystery? 1. Gather the required materials. Use Table 1 as a key for creating your DNA molecule. T able 1: DNA model components Pop bead color Molecule Red Phosphate group White Sugar (deoxyribose) Blue Cytosine Orange Guanine Yellow Adenine Green Thymine 2. Your teacher will give each group an envelope. The DNA sample number is printed on the outside. The sequence of bases on one strand is also provided. . . T able 2: DNA sample data DNA sample number: Number of bases: Number of sugar molecules: Number of phosphate molecules: 3. Begin by creating the phosphate and sugar backbone of the DNA molecule. Determine the number of bases and indicate this number in Table 2. 4. Recall that the bases attach to the sugar molecules. Calculate the number of sugar molecules that will be needed and record this in Table 2. Since the backbone is 58