What are the challenges in measuring pulic sector efficiency? - Julian Kelly, United-Kingdom
•
1 recomendación•479 vistas

This presentation was made by Julian Kelly, United-kingdom, at the 37th Annual Meeting of OECD Senior Budget Officials held in Stockholm on 9-10 June 2016

Recomendados
Recomendados
Más contenido relacionado
La actualidad más candente
La actualidad más candente (20)
Similar a What are the challenges in measuring pulic sector efficiency? - Julian Kelly, United-Kingdom
Similar a What are the challenges in measuring pulic sector efficiency? - Julian Kelly, United-Kingdom (20)
Más de OECD Governance
Más de OECD Governance (20)
Último
Último (20)
What are the challenges in measuring pulic sector efficiency? - Julian Kelly, United-Kingdom
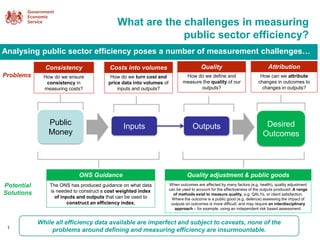
- 1. What are the challenges in measuring public sector efficiency? 1 While all efficiency data available are imperfect and subject to caveats, none of the problems around defining and measuring efficiency are insurmountable. Analysing public sector efficiency poses a number of measurement challenges… Public Money Inputs Outputs Desired Outcomes The ONS has produced guidance on what data is needed to construct a cost weighted index of inputs and outputs that can be used to construct an efficiency index. How can we attribute changes in outcomes to changes in outputs? How do we define and measure the quality of our outputs? How do we turn cost and price data into volumes of inputs and outputs? Problems Potential Solutions How do we ensure consistency in measuring costs? When outcomes are affected by many factors (e.g. health), quality adjustment can be used to account for the effectiveness of the outputs produced. A range of methods exist to measure quality, e.g. QALYs, or client satisfaction. Where the outcome is a public good (e.g. defence) assessing the impact of outputs on outcomes is more difficult, and may require an interdisciplinary approach – for example, using an independent risk based assessment. Consistency Costs into volumes ONS Guidance Quality Attribution Quality adjustment & public goods
- 2. What do the data show for frontline services? 2 Schools 80 90 100 110 120 130 140 150 160 1996 1997 1998 1999 2000 2001 2002 2003 2004 2005 2006 2007 2008 2009 2010 2011 2012 2013 Index,1996=100 Revised Outputs Revised Inputs Revised Productivity Original Outputs Original Inputs Original Productivity The wider evidence base suggests changes in performance are heavily influenced by factors outside the education system, such as parental engagement and the home learning environment. Source: ONS
- 3. 90 140 190 240 290 340 1974/75 1975/76 1976/77 1977/78 1978/79 1979/80 1980/81 1981/82 1982/83 1983/84 1984/85 1985/86 1986/87 1987/88 1988/89 1989/90 1990/91 1991/92 1992/93 1993/94 1994/95 1995/96 1996/97 1997/98 1998/99 1999/00 2000/01 2001/02 2002/03 2003/04 2004/05 2005/06 2006/07 2007/08 2008/09 2009/10 2010/11 2011/12 2012/13 2013/14 Index1975/76=100 NHS productivity in England 1974/75 – 2012/13 Source:DH Since 1975 NHS productivity hasrisen by an averageof 0.8 per cent per annum Between 2010/11 and 2013/14 it averaged 1.4 per cent per annum. Outputs Inputs Productivity 2009/10 2013/14 5.8% increase What do the data show for frontline services? 3 Outputs: a variety of measures, including in- and out-patients treated, GP consultations and prescriptions issued. These are quality adjusted using survival rates, patient surveys and waiting times. Inputs: an aggregate of labour input, purchased goods and services, and capital consumption (real terms). Much of the historic productivity increase has been driven by reduced average length of hospital stay and shifting activity to day cases. This allows fewer beds and nurses per episode, though the average acuity of patients in hospital increases. A combination of pay restraint, improved labour productivity, cuts in central budgets, and the abolition of some tiers of management have delivered unprecedented savings over the past four years. This has allowed the NHS to maintain the offer with funding growth around a quarter of long run trend. Health Services Geometric Averages per annum Change in input prices (real) Change in unit costs (real) Increase in Inputs Increase In Output 1975/76 to 2010/11 +1.4% +0.6% 2.5% 3.3% 2010/11 to 2013/14 -0.4% -1.8% 1.7% 3.1% The NHS has recently performed strongly on productivity – costs have fallen, and the input to output ratio has outperformed the long run trend. This is broadly consistent with the efficiency measure produced by the ONS.
- 4. What do the data show for transactional services? 4 40 60 80 100 120 140 160 2001/02=100 Outputs: volume of tax returns. Inputs: full time equivalent employees. Outputs Inputs Productivity It is impossible to produce a single headline measure of efficiency in tax collection, as the work of HMRC covers several areas and has changed radically in the past decade. One measure is the processing of physical tax returns, which shows that administrative productivity increased over the period 2004-2008, following the merger of Inland Revenue with HM Customs Excise. However, since 2008, tax inputs have become almost 90 per cent digital. This vastly reduces the amount of labour needed to process returns. HMRC created Tax Collection UK tax administration productivity, 1997-2008 Source: Dunleavy and Carrera, 2008 This study is based on publicly available data and the results are not necessarily endorsed by HMRC. By 2015, approximately half of HMRC’s budget will be allocated to compliance, tackling fraud and reducing error. Future efficiency gains will focus on data-led compliance: using data to predict where non- compliance might occur and more effectively target resources, as well as deploying a greater range of personalised digital services with a ‘once & done’ approach, reducing the need for customer contact. Source: HMRC
- 5. What next: Value Maps 5 What does the end product look like? An illustration of the end product is what DCLG has produced for its housing programmes. All Whitehall departments will have completed such value maps by the summer. The end product and the process of producing value maps is intended to: • Encourage departments to gather or make better use data on inputs, outputs and outcomes to assess efficiency. • Encourage departments to consider how efficiency might be improved, drawing on the drivers of efficiency developed by the Public Sector Efficiency Group. • Provide a method for reviewing efficiency consistently, transparently, regularly and simply helping Executive Teams to decide where to focus analytical efforts and drive improvement, backed up by peer review from other departments. Large scope for efficiency improvements Moderate scope for efficiency improvements Low scope for efficiency improvements Key: Scope for efficiency improvementsKey: Understanding of efficiency Unable to assess Help to Buy New Homes Bonus Affordable Housing Partial or no data and limited understanding of efficiency Some or good data but limited or no understanding of efficiency Good data and comprehensive understanding of current efficiency