International Price Comparison: UK v. 12 Countries
•
1 recomendación•2,431 vistas

Recomendados

Recomendados
Más contenido relacionado
Similar a International Price Comparison: UK v. 12 Countries
Similar a International Price Comparison: UK v. 12 Countries (20)
Más de Office of Health Economics
Más de Office of Health Economics (20)
Último
Último (20)
International Price Comparison: UK v. 12 Countries
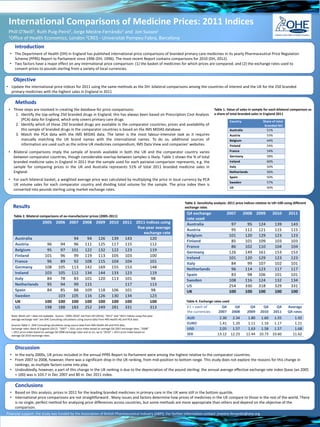
- 1. Introduction • The Department of Health (DH) in England has published international price comparisons of branded primary care medicines in its yearly Pharmaceutical Price Regulation Scheme (PPRS) Report to Parliament since 1996 (DH, 1996). The most recent Report contains comparisons for 2010 (DH, 2012). • Two factors have a major effect on any international price comparison: (1) the basket of medicines for which prices are compared; and (2) the exchange rates used to convert prices to pounds sterling from a variety of local currencies. Phill O’Neill1, Ruth Puig-Peiró2, Jorge Mestre-Ferrándiz1 and Jon Sussex1 1Office of Health Economics, London 2CRES - Universitat Pompeu Fabra, Barcelona International Comparisons of Medicine Prices: 2011 Indices Methods • Three steps are involved in creating the database for price comparisons: 1. Identify the top-selling 250 branded drugs in England; this has always been based on Prescription Cost Analysis (PCA) data for England, which only covers primary care drugs 2. Identify which of these 250 branded drugs are available in the comparator countries; prices and availability of this sample of branded drugs in the comparator countries is based on the IMS MIDAS database 3. Match the PCA data with the IMS MIDAS data. The latter is the most labour-intensive task as it requires manually matching the UK brand names with the international names. To do so, additional sources of information are used such as the online UK medicines compendium, IMS Data View and companies’ websites. • Bilateral comparisons imply the sample of brands available in both the UK and the comparator country varies between comparator countries, though considerable overlap between samples is likely. Table 1 shows the % of total branded medicine sales in England in 2011 that the sample used for each pairwise comparison represents, e.g. the sample for comparing prices in the UK and Australia represents 51% of total 2011 branded medicine sales in England. • For each bilateral basket, a weighted average price was calculated by multiplying the price in local currency by PCA UK volume sales for each comparator country and dividing total volume for the sample. The price index then is converted into pounds sterling using market exchange rates. Results Table 2. Bilateral comparisons of ex-manufacturer prices (2005-2011) Financial support: the study was funded by the Association of British Pharmaceutical Industry (ABPI). For further information contact: jmestre-ferrandiz@ohe.org Discussion • In the early 2000s, UK prices included in the annual PPRS Report to Parliament were among the highest relative to the comparator countries. • From 2007 to 2008, however, there was a significant drop in the UK ranking, from mid-position to bottom range. This study does not explore the reasons for this change in rankings, as multiple factors come into play. • Undoubtedly, however, a part of this change in the UK ranking is due to the depreciation of the pound sterling: the annual average effective exchange rate index (base Jan 2005 = 100) was is 103.7 in Dec 2007 and 80 in Dec 2011 index. Note: Blank cell = data not available . Source: “2005–2010” are from DH (2012); “2011” and “2011 indices using five-year average exchange rate” are OHE Consulting calculations using source data from IMS Health AG and PCA data. Objective • Update the international price indices for 2011 using the same methods as the DH: bilateral comparisons among the countries of interest and the UK for the 250 branded primary medicines with the highest sales in England in 2011 Table 1. Value of sales in sample for each bilateral comparison as a share of total branded sales in England 2011 2005 2006 2007 2008 2009 2010 2011 2011 indices using five-year average exchange rate Australia 94 94 126 139 143 120 Austria 96 94 96 111 125 117 115 112 Belgium 95 97 101 122 132 122 123 119 Finland 101 96 99 119 113 105 103 100 France 96 89 92 108 115 104 104 101 Germany 108 105 113 142 169 155 153 148 Ireland 103 105 112 134 144 133 123 119 Italy 84 78 83 101 120 113 101 98 Netherlands 95 94 99 115 117 113 Spain 84 85 88 109 118 106 101 98 Sweden 103 105 116 126 130 134 123 UK 100 100 100 100 100 100 100 100 US 198 188 183 252 249 281 331 313 Q4 exchange rate used 2007 2008 2009 2010 2011 Australia 97 95 124 139 143 Austria 95 112 121 115 115 Belgium 101 120 129 123 123 Finland 85 101 109 103 103 France 86 102 110 104 104 Germany 126 149 161 153 153 Ireland 101 120 129 123 123 Italy 84 99 107 102 101 Netherlands 96 114 123 117 117 Spain 83 98 106 101 101 Sweden 108 116 124 132 134 US 254 330 318 329 331 UK 100 100 100 100 100 Sources Table 3 : OHE Consulting calculation using source data from IMS Health AG and PCA data. Exchange rates: Bank of England (2012). ”2007” = 2011 price index based on average Q4 2007 exchange rates, “2008” = 2011 price index based on average Q4 2008 exchange rates and so on, up to “2010” = 2011 price index based on average Q4 2010 exchange rates. £1 = each of the currencies Q4 2007 Q4 2008 Q4 2009 Q4 2010 Q4 2011 Average Q4 rates AUD 2.30 2.34 1.80 1.60 1.55 1.92 EURO 1.41 1.20 1.11 1.16 1.17 1.21 USD 2.05 1.57 1.63 1.58 1.57 1.68 SEK 13.12 12.23 11.44 10.73 10.60 11.62 Conclusions • Based on this analysis, prices in 2011 for the leading branded medicines in primary care in the UK were still in the bottom quartile. • International price comparisons are not straightforward . Many issues and factors determine how prices of medicines in the UK compare to those in the rest of the world. There is no single, perfect method for analysing price differences across countries, but some methods are more appropriate than others and depend on the objective of the comparison. Country Share of total branded NIC Australia 51% Austria 53% Belgium 44% Finland 54% France 54% Germany 58% Ireland 60% Italy 50% Netherlands 56% Spain 50% Sweden 57% US 40% Table 3. Sensitivity analysis: 2011 price indices relative to UK=100 using different exchange rates Table 4. Exchange rates used