Direct-to-indirect band gap crossover for the BexZn1-xTe alloy
•
1 recomendación•510 vistas


Recomendados
Recomendados
Más contenido relacionado
La actualidad más candente
La actualidad más candente (19)
Similar a Direct-to-indirect band gap crossover for the BexZn1-xTe alloy
Similar a Direct-to-indirect band gap crossover for the BexZn1-xTe alloy (20)
Más de Oleg Maksimov
Más de Oleg Maksimov (20)
Último
Último (20)
Direct-to-indirect band gap crossover for the BexZn1-xTe alloy
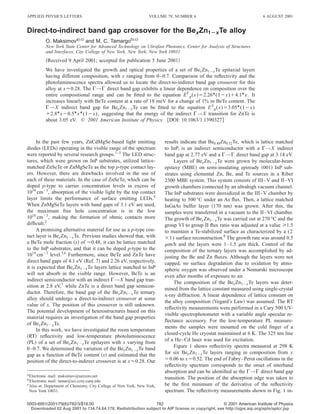
- 1. APPLIED PHYSICS LETTERS VOLUME 79, NUMBER 6 6 AUGUST 2001 Direct-to-indirect band gap crossover for the Bex Zn1À x Te alloy O. Maksimova),c) and M. C. Tamargob),c) New York State Center for Advanced Technology on Ultrafast Photonics, Center for Analysis of Structures and Interfaces, City College of New York, New York, New York 10031 ͑Received 9 April 2001; accepted for publication 5 June 2001͒ We have investigated the growth and optical properties of a set of Bex Zn1Ϫx Te epitaxial layers having different composition, with x ranging from 0–0.7. Comparison of the reflectivity and the photoluminescence spectra allowed us to locate the direct-to-indirect band gap crossover for this alloy at xϷ0.28. The ⌫→⌫ direct band gap exhibits a linear dependence on composition over the entire compositional range and can be fitted to the equation E ⌫ g (x)ϭ2.26* (1Ϫx)ϩ4.1* x. It increases linearly with BeTe content at a rate of 18 meV for a change of 1% in BeTe content. The ⌫→X indirect band gap for Bex Zn1Ϫx Te can be fitted to the equation E X g (x)ϭ3.05* (1Ϫx) ϩ2.8* xϪ0.5* x * (1Ϫx), suggesting that the energy of the indirect ⌫→X transition for ZnTe is about 3.05 eV. © 2001 American Institute of Physics. ͓DOI: 10.1063/1.1390327͔ In the past few years, ZnCdMgSe-based light emitting results indicate that Be0.48Zn0.52Te, which is lattice matched diodes ͑LEDs͒ operating in the visible range of the spectrum to InP, is an indirect semiconductor with a ⌫→X indirect were reported by several research groups.1–3 The LED struc- band gap at 2.77 eV and a ⌫→⌫ direct band gap at 3.14 eV. tures, which were grown on InP substrates, utilized lattice- Layers of Bex Zn1Ϫx Te were grown by molecular-beam matched ZnSeTe or ZnMgSeTe as the top p-type contact lay- epitaxy ͑MBE͒ on semi-insulating epiready ͑001͒ InP sub- ers. However, there are drawbacks involved in the use of strates using elemental Zn, Be, and Te sources in a Riber each of these materials. In the case of ZnSeTe, which can be 2300 MBE system. This system consists of III–V and II–VI doped p-type to carrier concentration levels in excess of growth chambers connected by an ultrahigh vacuum channel. 1019 cmϪ3, absorption of the visible light by the top contact The InP substrates were deoxidized in the III–V chamber by layer limits the performance of surface emitting LEDs.4 heating to 500 °C under an As flux. Then, a lattice matched When ZnMgSeTe layers with band gaps of 3.1 eV are used, InGaAs buffer layer ͑170 nm͒ was grown. After this, the the maximum free hole concentration is in the low samples were transferred in a vacuum to the II–VI chamber. 1018 cmϪ3, making the formation of ohmic contacts more The growth of Bex Zn1Ϫx Te was carried out at 270 °C and the difficult.2 group VI to group II flux ratio was adjusted at a value у1.5 A promising alternative material for use as a p-type con- to maintain a Te-stabilized surface as characterized by a (2 tact layer is Bex Zn1Ϫx Te. Previous studies showed that, with ϫ1) surface reconstruction.8 The growth rate was around 0.5 a BeTe mole fraction ͑x͒ of Ϸ0.48, it can be lattice matched m/h and the layers were 1–1.5 m thick. Control of the to the InP substrates, and that it can be doped p-type to the composition of the ternary layers was accomplished by ad- 1019 cmϪ3 level.5,6 Furthermore, since BeTe and ZnTe have justing the Be and Zn fluxes. Although the layers were not direct band gaps of 4.1 eV ͑Ref. 7͒ and 2.26 eV, respectively, capped, no surface degradation due to oxidation by atmo- it is expected that Bex Zn1Ϫx Te layers lattice matched to InP spheric oxygen was observed under a Nomarski microscope will not absorb in the visible range. However, BeTe is an even after months of exposure to air. indirect semiconductor with an indirect ⌫→X band gap tran- The composition of the Bex Zn1Ϫx Te layers was deter- sition at 2.8 eV,7 while ZnTe is a direct band gap semicon- mined from the lattice constant measured using single-crystal ductor. Therefore, the band gap of the Bex Zn1Ϫx Te ternary x-ray diffraction. A linear dependence of lattice constant on alloy should undergo a direct-to-indirect crossover at some the alloy composition ͑Vegard’s Law͒ was assumed. The RT value of x. The position of this crossover is still unknown. reflectivity measurements were performed in a Cary 500 UV- The potential development of heterostructures based on this visible spectrophotometer with a variable angle specular re- material requires an investigation of the band gap properties flectance accessory. For the low-temperature PL measure- of Bex Zn1Ϫx Te. ments the samples were mounted on the cold finger of a In this work, we have investigated the room temperature closed-cycle He cryostat maintained at 6 K. The 325 nm line ͑RT͒ reflectivity and low-temperature photoluminescence of a He–Cd laser was used for excitation. ͑PL͒ of a set of Bex Zn1Ϫx Te epilayers with x varying from 0–0.7. We determined the variation of the Bex Zn1Ϫx Te band Figure 1 shows reflectivity spectra measured at 298 K gap as a function of BeTe content ͑x͒ and estimated that the for six Bex Zn1Ϫx Te layers ranging in composition from x position of the direct-to-indirect crossover is at xϷ0.28. Our ϭ0.06 to xϭ0.52. The end of Fabry–Perot oscillations in the reflectivity spectrum corresponds to the onset of interband a͒ absorption and can be identified as the ⌫→⌫ direct band gap Electronic mail: maksimov@netzero.net b͒ transition. The position of the absorption edge was taken to Electronic mail: tamar@sci.ccny.cuny.edu c͒ Also at: Department of Chemistry, City College of New York, New York, be the first minimum of the derivative of the reflectivity New York 10031. spectrum. The reflectivity measurements shown in Fig. 1 in- 0003-6951/2001/79(6)/782/3/$18.00 782 © 2001 American Institute of Physics Downloaded 02 Aug 2001 to 134.74.64.178. Redistribution subject to AIP license or copyright, see http://ojps.aip.org/aplo/aplcr.jsp
- 2. Appl. Phys. Lett., Vol. 79, No. 6, 6 August 2001 O. Maksimov and M. C. Tamargo 783 FIG. 3. Direct band gap at 298 K from reflectivity data ͑open circles͒ and PL energy at 6 K ͑crosses͒ as a function of BeTe content ͑x͒ in Bex Zn1Ϫx Te. The direct and indirect band gaps for BeTe are taken from Ref. 7. The indirect band gap of ZnTe is taken from Ref. 9. The dashed line is a fit for the ⌫→X transition and the solid line is a fit for the ⌫→⌫ transition of FIG. 1. RT reflectivity spectra for several Bex Zn1Ϫx Te alloys of different Bex Zn1Ϫx Te alloys as a function of composition. compositions are shown. a value of xу0.28. It should be noted that the intensity of the dicate that the band gap continuously shifts to a higher en- PL decreased sharply as the BeTe content became larger than ergy as the Be concentration increases. The band gap energy that value, and continued to decrease as the Be content in- increases linearly with BeTe content at a rate of 18 meV for creased. a change of 1% in BeTe content. Based on their optical properties, the samples can be Figure 2 shows normalized PL spectra measured at 6 K divided into two different groups. For Bex Zn1Ϫx Te with x for the same group of samples. The PL spectra are dominated Ͻ0.28, the PL emission energy increases with Be content. In by narrow emission lines. In several spectra a second, usu- this group of samples, the PL emission energy, which is mea- ally weak peak is present at lower energy, about 50 meV sured at 6 K, is about 90 meV above the RT band gap value below the high-energy peak. It can be seen from the data in obtained from the reflectivity measurements, consistent with Fig. 2 that the energy of the dominant PL peak initially in- the expected variation of the band gap with temperature. creases with Be content and then becomes nearly constant at Thus, the PL emission in this group of samples is assigned to the ⌫→⌫ near bandedge emission. For the Bex Zn1Ϫx Te with xу0.28, the PL emission energy is nearly constant while the direct band gap value continues to increase linearly with composition. Therefore, our results suggest that the Bex Zn1Ϫx Te layers with xу0.28 are indirect band gap mate- rials. This conclusion is also supported by the reduced PL intensity observed for these samples. In Fig. 3, we have plotted the direct band gaps obtained from reflectivity measurements ͑open circles͒ and the PL emission energies ͑crosses͒ as a function of Be content for a larger set of samples that includes the six shown in Figs. 1 and 2. Using the RT band gap measured for ZnTe ͑2.263 eV͒ and the reported value for the direct band gap of BeTe ͑4.1 eV͒,7 the reflectivity data can be well fitted to the linear equation: E ⌫ g ͑ x ͒ ϭ2.263* ͑ 1Ϫx ͒ ϩ4.1* x for 0рxр1, ͑1͒ which describes the RT direct band gap dependence on com- position for this alloy. The same equation corrected for the temperature difference describes the behavior of 6 K PL data for samples with xϽ0.28. To analyze the PL data for xу0.28, we must consider FIG. 2. Low-temperature ͑6 K͒ PL spectra for several Bex Zn1Ϫx Te alloys of the ⌫→X band gap energy for the binary end points. The different compositions are shown. value for BeTe is well known to be at 2.8 eV.7 However, the Downloaded 02 Aug 2001 to 134.74.64.178. Redistribution subject to AIP license or copyright, see http://ojps.aip.org/aplo/aplcr.jsp
- 3. 784 Appl. Phys. Lett., Vol. 79, No. 6, 6 August 2001 O. Maksimov and M. C. Tamargo ⌫→X transition energy for ZnTe is not known precisely. BeTe content at a rate of 18 meV for a change of 1% in BeTe Recently, a value of 3.05 eV was reported,9 while a value of content for the entire compositional range. The dependence 3.45 eV was obtained using ab initio calculations.10 The val- of the indirect band gap on composition was also established ues the same authors report for the X→X transition ͓5.45 eV and a good fit was obtained when a value of 3.05 eV was ͑Ref. 9͒ and 5.63 eV ͑Ref. 10͔͒ are comparable to the values used for the ZnTe ⌫→X transition. Our results indicate that measured by other group ͓5.23 eV ͑Ref. 11͒ and 5.30 eV Be0.48Zn0.52Te, which is the composition that is lattice ͑Ref. 12͔͒. Assuming that the PL emission energies for the matched to InP, is an indirect semiconductor with a ⌫→X samples with x above 0.28 correspond to the ⌫→X indirect indirect band gap of 2.77 eV, and a ⌫→⌫ direct band gap of band gap transition, we have fitted the variation of the 3.14 eV. Therefore, it is well suited for use as a p-type con- ⌫→X indirect band gap with composition ͑x͒ to the equa- tact layer in LED structures emitting throughout the visible tion: range. E X g ͑ x ͒ ϭ3.05* ͑ 1Ϫx ͒ ϩ2.8* xϪ0.5* x * ͑ 1Ϫx ͒ The authors would like to acknowledge support from the for 0рxр1, ͑2͒ National Science Foundation through Grant Nos. DMR- 9805760 and DGE-9972892. The work was performed under where 0.5 eV is a bowing parameter. A good correlation of the auspices of the New York State Center for Advanced Eq. ͑2͒, with our data was obtained, while attempts to fit to Technology on Ultrafast Photonics and the Center for Analy- an equation that uses 3.45 eV as the ZnTe ⌫→X indirect sis of Structures and Interfaces. band gap was not successful. This supports our interpretation of the data and indicates that the ⌫→X band gap transition for ZnTe is about 3.05 eV. 1 M. C. Tamargo, W. Lin, S. P. Guo, Y. Guo, Y. Luo, and Y. C. Chen, J. Comparison of the reflectivity and PL data shows that Cryst. Growth 214, 1058 ͑2000͒. the direct-to-indirect crossover occurs at xϷ0.28. This result 2 W. Faschinger and J. Nurnberger, Appl. Phys. Lett. 77, 187 ͑2000͒. ¨ 3 implies that Be0.48Zn0.52Te, which is the alloy composition W. Shinozaki, I. Nomura, H. Shimbo, H. Hattori, T. Sano, S. B. Che, A. that is lattice matched to InP, is an indirect semiconductor Kikuchi, K. Shimomura, and K. Kishino, Jpn. J. Appl. Phys., Part 1 38, 2598 ͑1999͒. with a ⌫→X indirect band gap of 2.77 eV and a ⌫→⌫ direct 4 W. Lin, B. X. Yang, S. P. Guo, A. Elmoumni, F. Fernandez, and M. C. band gap of 3.14 eV. A previous report5 predicted that the Tamargo, Appl. Phys. Lett. 75, 2608 ͑1999͒. 5 direct-to-indirect crossover for Bex Zn1Ϫx Te alloy would oc- S. B. Che, I. Nomura, W. Shinozaki, A. Kikuchi, K. Shimomura, and K. cur at a much higher Be content (xϾ0.7). This prediction Kishino, J. Cryst. Growth 214, 321 ͑2000͒. 6 M. W. Cho, S. K. Hong, J. H. Chang, S. Saeki, M. Nakajima, and T. Yao, was based on the assumption that the ⌫→X ZnTe band gap J. Cryst. Growth 214Õ215, 487 ͑2000͒. is at 5.97 eV. Our data gives a clear evidence of the position 7 A. Waag, F. Fischer, H. J. Lugauer, Th. Litz, J. Laubender, U. Lunz, U. of the direct-to-indirect crossover and indicates that 5.97 eV Zehnder, W. Ossau, T. Gerhardt, M. Moller, and G. Landwehr, J. Appl. Phys. 80, 792 ͑1996͒. is not the correct value for the ⌫→X transition for ZnTe. 8 M. W. Cho, J. H. Chang, S. Saeki, and S. Q. Wang, and T. Yao, J. Vac. Sci. In summary, epitaxial layers of Bex Zn1Ϫx Te were grown Technol. B 18, 457 ͑2000͒. by MBE on InP substrates and their band structure and opti- 9 G. D. Lee, M. H. Lee, and J. Ihm, Phys. Rev. B 52, 1459 ͑1995͒; and cal properties were investigated. It was shown that references therein. 10 O. Zakharov, A. Rubio, X. Blase, M. L. Cohen, and S. G. Louie, Phys. Bex Zn1Ϫx Te has a direct band gap for low BeTe concentra- Rev. B 50, 10780 ͑1994͒. tions and becomes indirect, exhibiting a ⌫→X character, for 11 K. Sato and S. Adachi, J. Appl. Phys. 73, 926 ͑1993͒. xу0.28. The ⌫→⌫ direct band gap increases linearly with 12 K. Suzuki and S. Adachi, J. Appl. Phys. 82, 1320 ͑1997͒. Downloaded 02 Aug 2001 to 134.74.64.178. Redistribution subject to AIP license or copyright, see http://ojps.aip.org/aplo/aplcr.jsp