SlideShare a Scribd company logo
1 of 24
Download to read offline
Page 1
WIPAC MONTHLYThe Monthly Update from Water Industry Process Automation & Control
	www.wipac.org.uk												Issue 3/2017 - March 2017
Page 2
In this Issue
	 From the Editor....................................................................................................................	 3
	 Industry News.....................................................................................................................	 4 - 9		
	 Highlights of the news of the month from the global water industry centred around the successes of a few of the
	 companies in the global market.
	 Is it possible to use flow data to predict flow data........................................................ 	 10-14
	 In this month’s feature article, group manager - Oliver Grievson, has had a play with an extensive base of flow data
	 and looked to do what has been promised in the past - quite literally smooth data, in this case flow data. Some
	 interesting results came out of it
	
	 How the Water Industry learned to embrace data.......................................................... 	 15
	 In this article written by Amir Peleg of Takadu and Frank Cespedes of Harvard the discussion of the importance of data
	 is discussed looking at how data has been used to improve leakage but how not only technology but the people and
	 processes are essential parts of the journey
	 Smart Wastewater Networks from Micro to Macro........................................................ 	 16-18
	 March has been the month where Smart Wastewater Networks have been heavily discussed showing what is new
	 in the world of Smart Wastewater Networks. Bringing the key learning points from this month’s workshops and
	 conferences, Oliver Grievson also discusses the future of collection networks in the wastewater industry.
	 Developing an alternative to Coriolis Flow Measurement .................................................. 	 19-20
	 Coriolis Flow Measurement is something that the Water Industry hasn’t fully utilised, perhaps because of its cost or
	 the complexity involved. In this article from Flow Measurement Specialists Burkert an alternative to Coriolis in the form
	 of their Surface Acoustic Wave (SAW) technology is discussed.
	 A digital future for Severn Trent......................................................................................... 	 20-21
	 In this extended news article the developments of the digital innovations that have been taken on and utilised with the
	 UK Water Company - Severn Trent are discussed showing the forward looking approach to exploiting the digital approach
	 to the Water Industry
	
	 Workshops, Conferences & Seminars................................................................................... 	22-23	
	 The highlights of the conferences and workshops in the coming months
	
The picture on the front cover of this issue is the key graph from the predicting flow data article in this month’s issue. It questions
that, at least for total daily volume calculations, whether we need to record data every 16 minutes
WIPAC Monthly is a publication of the Water Industry Process Automation & Control Group. It is produced by the group
manager and WIPAC Monthly Editor, Oliver Grievson. This is a free publication for the benefit of the Water Industry and please feel
free to distribute to any who you may feel benefit.
All enquires about WIPAC Monthly, including those who want to publish news or articles within these pages, should be directed 		
to the publications editor, Oliver Grievson at olivergrievson@hotmail.com
Page 3
From the Editor
					
Has the time of the Smart Wastewater Network finally happened? If you are to believe the workshop and conference
that has taken place this month I think it is safe to finally say that the industry has at least made some in-roads into
the thoughts around putting intelligence into the network. A few years ago now I stood at the front of a relatively large
conference and was asked by an eminent Professor from one of the leading Universities in the UK
“We’ve been talking about the concept of the Smart Wastewater Network for years and we are still not any further
forward. What has changed now?”
At the time I said it was the drivers in the industry and that it would happen, of course in the UK it has. We have (or will
have) Event Duration Monitoring on the majority (if not all) of our combined storm outfalls and I am aware of at least
two of the Water & Sewerage Companies that are installing sensors in their thousands. On top of this more and more we
are hearing about sewer level monitoring, flow monitoring at pumping stations, current monitoring for asset monitoring,
automatic re-setting of pumps on top of pump reversal technology as well. All of these aspects are what I am terming the micro changes that we are making
to our wastewater network on top of this there are the more macro changes including the use of rainfall data to predict the future state of the network in
response to events. More is covered in the article, that I have written off the back of these events, later on in this issue.
Of course the most welcome news is the work that one of the UK Water & Sewerage Companies has taken when they released the news of what is presumable
their digital (Smart) strategy moving forward. Sitting at a conference earlier this month listening to Martin Kane of Severn Trent I heard what they have done
at their treatment works at Spernal in using the factory approach and using instrumentation to gather the data and turn it into information. Now the works
at Spernal isn’t huge, with a EU registered population of 85,004 (click here for details) but with a relatively small investment they have taken the works to a
point where they use the data to know what is going on. The result an engaged staff who have the information on hand to make an informed decision on how
to operate the works.
The challenge has always been for the “Smart” Water Industry has been to justify the benefits of the approach. How much will it cost is the cry and what are
the benefits? The reply has been very much - “Well, we think its going to be this but we are sure we will get more benefits that we think which may well mean
that we can reduce the ROI but we’ve not 100% sure,” The answer in an industry which always seems to have to operate with the prospects of lower bills and
tougher challenges means that margins matter and so the inevitable result is a degree of conservatism.
This “conservatism” was challenged in another event that I went to this month at the Worshipful Company of Water Conservators, the atmosphere was
wonderfully masonic with it being hosted at the Guildhall in London, the event was a debate on the death of the Water Companies if radical change was not
forthcoming in the next decade or so. For those of you who have any doubt on the result the alarmist prospect was defeated with the main argument being
that the digital era in the Water & Wastewater Industry will result in radical change of the way that we work which will change the very foundation of what
the industry is. Of course this is partly true however the core is the assets that we work at day after day with the process units built in concrete hardy likely to
change in the short term but through better information and better ways of operating their is a good chance that the way we interact with these assets will
change the way we do things. The fatal error in the argument was that the digital or smart water industry is not meant as a replacement for anything, it is there
as another tool to inform those who know what they are doing to have all the information to hand to make the right decision.
The Smart Water industry is something that is starting and gathering pace, people within the industry are trying the small things and the opportunities are
there for the good solutions. Alongside these little solutions are the great big hairy solutions that naturally alot slower for adoption but with case studies like
Severn Trent have at Spernal coming to the forefront are likely to become more and more popular as the benefits are seen. It is through work like that being
done at Severn Trent that the industry will be led into a “Smart Future.”
Have a good month
Oliver
Defra sets out cyber security strategy for water sector
DC Water And Xylem Celebrate The First Intelligent Wastewater
Pumping System In North America
The UK Government has published a cyber security strategy for the water sector, summarising what water and sewerage companies need to do to reduce the
risks of cyber attacks. Published by the Department for Environment, Food and Rural Affairs, the strategy, which focuses on attacks based around computers,
computerised systems or networks, is mainly aimed at water and sewerage companies in England.
It says there are “credible cyber threats to UK Critical National Infrastructure, including the water sector,” and that these could lead to “serious consequences,
particularly as increased automation and connectivity reduces the scope for standalone or manual operation of the water supply system.”
Recent reviews by government cyber experts have identified significant opportunities for the water sector to operate at a higher level of cyber security
maturity. The water-specific strategy is part of a government-wide response to the cyber threat, which complements the National Cyber Security Strategy
(2016). The strategic vision and objectives have incorporated significant contributions from the sector and aim to guide activities across the sector, including
water companies and government. It aims to achieve a vision by 2021 of a “secure, effective, and confident water sector, resilient to an ever-evolving cyber
threat.”
Key objectives within the strategy include understanding the threats; managing the risk from these threats; managing any incidents that arise in the best way
possible; and developing capabilities to increase future resistance and build cyber skills.
The cyber risk reviews identified a number of key areas in which the sector should focus its cyber security activities.
One of these is the architectural design/separation of Information Technology (IT) and Operational Technology (OT). The paper says that ideally IT and OT
systems or networks should be completely separated to prevent infections in IT systems spreading and impacting processes that could cause physical damage.
It also flags up the cyber risk from third parties, with company networks increasingly accessed by third parties such as equipment suppliers, software suppliers
and contractors who require the ability to upload software onto systems, make alterations and plug their equipment into the host network.
The paper says policies need to be in place to manage this risk, for instance by restricting the number of people with external accesses to a network and
ensuring that devices plugged in to the host network are not carrying malware.
The full strategy is available to download here
Xylem have presented to DC Water, this month the first installation in North America of Flygt Concertor, the world’s first wastewater pumping system with
integrated intelligence. DC Water, one of the nation’s leading water and wastewater innovators, has a well-established track record of piloting and adopting
leading-edge technologies to evolve its operations into smarter water infrastructure for the benefit of its customers and the community.
In the wake of a renewed interest in federal investments in infrastructure, DC Water and Xylem are coming together to highlight the urgent need for investing
in smart water infrastructure to maximize operational productivity and benefit customers. In a report released earlier this month, the American Society of Civil
Engineers estimated that the U.S. needs to invest a minimum of $123 billion per year in water infrastructure over the next 10 years to achieve a good state of
repair.
In order to advance research and development in the area of smart water infrastructure and advanced data analytics in the sector, Xylem and DC Water
today signed a Memorandum of Understanding to collaborate on future innovation initiatives. The two organizations expressed a commitment to accelerating
innovation through field-driven pilots that focus on increasing the productivity of managing water and wastewater and improve the resilience and sustainability
of those operations.
“In the U.S., our water and wastewater infrastructure faces a daunting investment gap that places these critical systems at risk and leaves our communities
vulnerable to the consequences of system failures,” said Patrick Decker, President and CEO of Xylem. “We are so pleased to be able to partner with DC Water – a
true industry leader – to address these challenges, leveraging technology to develop new, more sustainable solutions. Our Flygt Concertor is a great example of
the type of break-through technology that we believe will fundamentally alter the way water and wastewater is managed. Working together, we will be able to
bring those solutions to fruition even faster.”
George Hawkins, CEO and General Manager of DC Water, said, “At DC Water, we’re always looking down the road for the next innovation that will help us do our
job better, at less cost. This new technology accomplishes that and I’m excited about the implications not just for us, but for the industry as a whole. It’s also an
important demonstration of partnerships between the best elements of private sector innovation and public sector operational know-how, and I’m proud to be
on the forefront of this effort.”
Mr. Hawkins welcomed Xylem and guests to its Blue Plains Advanced Wastewater Treatment Plant today for a demonstration of the Flygt Concertor wastewater
technology, which was developed by Xylem in close collaboration with customers. This intelligent, connected solution significantly advances the sustainability
of the wastewater sector by consuming considerably less energy, reducing inventory needs, ensuring reliable, clog-free wastewater pumping while also reducing
the overall cost of ownership.
“DC Water is working on many innovations focused on leveraging digital technologies to maximize operation and maintenance efficiencies,” commented Biju
George, Chief Operating Officer of DC Water. “The Concertor pump will enable us to achieve this not only through the new capabilities of the pump itself but also
with the embedded data for efficient asset management.”
Page 4
Industry News
Big Data, IoT Poised To Address Water Infrastructure Gap
Cutting-edge, smart water solutions are gaining traction with municipal water utilities, which see data and analytics as critical tools for overcoming the age-
old issue of crumbling water infrastructure. Over $20B is slated for metering, data management, and analytics from 2016 to 2025, globally, according to
Bluefield Research.
At the root of this change is the mounting financial pressure that is forcing water utilities and municipalities to do more with less. This has sparked an uptick
in demand for innovative solutions to more cost-effectively manage billing and customer management, leakage rates, and energy consumption.
“By zeroing-in on key drivers of operating costs, water utilities are optimizing their operations with smart technologies,” according to Keith Hays, Vice
President of Bluefield Research. “The solutions are not new, as they draw from existing equipment, software, and analytics tools,” says Hays, “but a significant
hurdle will be integrating legacy systems with new software platforms.”
In some cases, the results have been significant: halving non-revenue water- leaks and billing errors- and reducing energy consumption from 20% to 40%.
As much as 30% of water utility operating expenditures can be improved almost immediately through more dynamic and real-time system monitoring,
according to Bluefield.
The smart water sector is expected to scale to $12B in the US and $11B in Europe by 2025. Other hotspots for smart water activity include Australia,
Singapore and Israel, where water stress and established utility network operators are more receptive to advanced technology adoption. European utilities
are at the forefront of smart water in terms of operational solutions, while the US leads in terms of metering.
Exhibit: Global Smart Water Projects (2nd Half 2016)
Bluefield has seen an uptick of M&A with larger, more diversified players like Honeywell, Trimble, and Xylem moving deeper into the sector. “Smart water
is bringing a wide range of new companies into the water industry, from multiple sectors and value chain positions, which is fitting for an industry opening
itself up to the massive potential,” according to Hays. “We expect to see more industry consolidation over the next 3-5 years, as technology firms build utility
track records and larger industrial players find synergies within their larger product portfolios,” says Hays.
Page 5
Latest Copernicus launch will improve services for users of land
and sea maps
The latest addition to the Copernicus satellite Earth observation family will halve the time needed to provide precision land-use data to benefit farmers,
builders, fishermen and anyone who needs rapid access to up-to-the-minute data on conditions on the ground.
Copernicus – Europe’s Earth observation programme – can now build up an image covering the entire planet in just 5 days, cutting the time needed to image the
globe by half. The latest Copernicus satellite (Sentinel-2B) was successfully launched on 7 March from Europe’s Spaceport in French Guiana. It joins Sentinel-2A,
which has been in orbit since 23 June 2015. The Copernicus Sentinel 2 mission is now complete.
Together, the two Sentinels produce high resolution data that is already being used to create satellite-enabled products and services. The European Union has
provided free, full and open access to the data.
The European Commission said that faster and more precise provision of data will bring concrete benefits to citizens worldwide. These include reduced costs
of precision farming services, increased productivity of fish farmers thanks to the monitoring of toxic algal blooms and savings for construction companies via
a work progress monitoring application.
In line with its Space Strategy for Europe, the Commission will continue to work on making access to space data easier, with the development of new
industry-led platforms. It is also planning to develop an ambitious awareness campaign about Copernicus and foster the uptake of space data, notably by
helping start-ups and supporting the emergence of European industrial space hubs and clusters in European regions.
Copernicus, a leading provider of Earth observation data across the globe, is already being used to help save lives at sea, improve response to natural disasters
such as earthquakes, forest fires or floods, and allows farmers to better manage their crops. The system collects data from earth observation satellites and
ground stations, airborne and sea-borne sensors.
For example, the European Commission’s Emergency Response Coordination Centre activated the EU Copernicus Emergency mapping service for damage
assessment grading maps for the most affected areas by the multiple earthquakes in central Italy since August 2016.
Copernicus processes data and provides users with reliable and up-to-date information through a set of services in six thematic areas:
•	 land monitoring
•	 marine monitoring
•	 atmosphere monitoring
•	 climate change
•	 emergency management response
•	 security
Most of these services are already operational and have been enabled by the earth observation data from the first Copernicus Sentinel satellites, as well as a
number of contribution missions from other operators.
With this latest launch, five Copernicus satellites are now in orbit (Sentinel 1A, 1B, 2A, 2B and 3A).
EU Vice-President Maroš Šefčovič described the launch as a ‘giant leap’ for Copernicus and good news for agriculture, climate and environment, the detection
of water pollution and the ability to cope with disasters.
Elżbieta Bieńkowska, Commissioner for Internal market, Industry, Entrepreneurship and SMEs said: “Today’s successful launch of a new Copernicus satellite
is another sign of the excellence of Europe in space. Copernicus is the most advanced Earth observation system in the world. With this launch more data will
become available to develop new and innovative services and applications.”
Sensus Smart Water System Improves Water Utilization For
Utilities And Customers
As utilities around the world seek to improve water utilization and help their customers become smarter about water usage, Sensus recognizes World Water
Day as an essential opportunity to deliver on these goals. A global provider of smart water systems—comprised of advanced metering technology, software and
the FlexNet® communication network—Sensus works with customers to enhance their water management efforts.
Improved leak detection and pressure management systems are proven ways for utilities to conserve water resources, reducing leaks by five percent and pipe
bursts by 10 percent, according to a Sensus research study titled “Water 20/20: Bringing Smart Water Networks Into Focus.” Utilities leveraging Sensus smart
water technologies go from reactive to proactive, identifying leaks and mitigating pressure issues before they lead to significant water loss. Sensus solutions
also help utilities improve service by enabling customers to adjust and eliminate unwanted behaviours while lowering their costs.
In recent examples of the use of Smart Water Metering customers & authorities have been alerted about leaks and unusual water leaks resulting in savings of
20% in Fontain City in Californina to “swimming pool” size leaks inYoungstown, Ohio. The main benefits though have been increased awareness of consumers
allowing the conversation about water conservation with the customer enabling not just reduced consumption but reduced leakage too.
Page 6
Endress+Hauser Acquires SensAction
Endress+Hauser has acquired SensAction AG, a manufacturer of innovative systems for measuring the concentration of liquids. With this move, the
Switzerland-based Group intends to strengthen its quality measurement portfolio. SensAction will remain headquartered in Coburg, Germany and keep the
current staff of 13 employees.
SensAction will operate as a division of the Endress+Hauser centre of competence for flow measurement technology headquartered in Reinach, Switzerland.
“This innovative technology is an excellent fit with our modern flow measurement portfolio,”says Dr Bernd-Josef Schäfer, Managing Director of Endress+
Hauser Flowtec AG. “It allows us to further expand our range of products for measuring quality parameters.”
Already, Coriolis flow measurement devices from Endress+Hauser can determine not only mass flow, but density as well. Electromagnetic
instruments are capable of measuring conductivity parallel to the volume flow. “These physical analysis parameters create direct value-add for the customer,”
emphasizes Bernd-Josef Schäfer. Endress+Hauser plans to integrate the SensAction instruments into its own program and open up new markets via the
Group’s international sales structures. In addition, plans are in place to eventually combine the technology direct with Endress+Hauser flow instruments.
Innovative technology
The systems from SensAction measure the concentration of liquids with the help of surface acoustic waves, which are high frequency sound waves whose
behaviour can be compared to seismic waves created by earthquakes. By analysing the transmission time and amplitude, the acoustic parameters of the
liquid, such as sound wave velocity, impedance and density, can be measured in order to quickly and precisely determine the concentration. Because they
contain no moving parts, the systems are maintenance-free and do not suffer from wear-and-tear.
Apart from developing and manufacturing concentration measurement systems, SensAction also offers supplementary services, such as software products
that rely on a laboratory measurement to provide a high degree of accuracy and user-friendliness for the customers’ applications. The key fields of application
for the SensAction instruments include concentration measurements for liquid process media.
The acquisition of SensAction will be effective retroactively from 1 January 2017. Both parties have agreed to not disclose the details of the transaction. Stefan
Rothballer and Michael Münch, two of SensAction’s founders, will continue to manage the innovative company’s business.
Sigfox And OleumTech Team Up To Streamline Asset Monitoring
Through Wireless Internet Of Things (IoT) Connectivity
Page 7
Sigfox, the world’s leading provider of connectivity for the Internet of Things (IoT), recently announced a partnership with OleumTech Corporation, a leading
provider of M2M communications and industrial automation solutions. As one of the largest Original Equipment Manufacturer (OEM) partnerships for Sigfox
to-date, global customers will soon benefit from out-of-the-box Low Power Wide Area (LPWA) wireless connectivity leveraging OleumTech’s patented self-
contained, battery-powered wireless transmitter technology.
OleumTech manufactures and distributes industrial wireless automation systems across sectors including Water and Energy. Their products have radically
transformed how companies gather data in the field, providing visibility to disparate assets, especially in remote, hazardous locations, enabling real-time
optimized decisions regarding resource deployment and regulatory compliance. With a global installed base of over 350,000 devices, OleumTech’s products
provide critical data for measurement variables such as pressure, flow, temperature, level, moisture, etc.
With the majority of industrial and utility assets isolated or too expensive to connect through tradition means, Sigfox’s LPWAN network provides a low cost
connectivity solution for the industry as a whole, enabling low device battery consumption and scalability on a global level. Through this partnership, cus-
tomers will benefit from the Sigfox managed connectivity layer so that asset monitoring is streamlined and the essential data is delivered in nearly real-time.
“We are proud to partner with a recognized leader in M2M communications and industrial automation solutions,” said Michael Orr, VP Sales and
Partnerships at Sigfox. IoT is well-positioned to transform the industry, optimizing everything from predictive maintenance to streamlining operations. As the
IoT connectivity layer, Sigfox offers innovative, scalable solutions to expedite data collection and improve operational efficiencies; enabling industry business
leaders like OleumTech to make better-informed decisions.”
“The partnership with Sigfox comes at an exciting time. We are rapidly growing our IoT portfolio and deploying new platforms to help our industrial customers
capitalize on the connected landscape and drive results for their business,” said Brent McAdams, Vice President, Strategic Initiatives at OleumTech. “Sigfox is
an ideal partner. Their rapidly expanding global footprint and cost-effective architecture is setting the standard for low power connectivity making it an ideal
platform for our self-contained battery powered technology, enabling all the benefits of IoT.”
The General Purpose line of OleumTech wireless instruments with embedded Sigfox connectivity will be available by the end of Q2 2017.
ABB and Sulzer in equipment servicing deal
ABB has agreed a deal with Sulzer Electro Mechanical Services UK (Ltd) which will see the latter providing workshop repair and maintenance services for its
large motors and generators.
Sulzer has been named a ‘loyalty partner’ of ABB, meaning that users of ABB’s 6.6 kV and above medium and high voltage motors and generators will be able
to benefit from the skills and facilities of Sulzer’s workshops in Birmingham and Falkirk. Sulzer offers inspection, remedial work, modification, repair and rewind
of ABB large machines, together with some field services.
Sulzer’s abilities include rebalancing of machines, motor rewinds, rotor repairs and manufacture of high voltage coils. Bringing these skills closer to ABB’s UK
customers will cut lead times for repairs and reduce costs.
The Loyalty Partner programme creates a network of local service partnerships to complement ABB’s own field services and regional service centres.
Peter Wright, field service product manager for ABB motors and generators, comments: “The aim is to create a complete value chain for ABB clients. This
will strengthen our joint position as collaboration through the Loyalty Partnership brings faster response and advanced service solutions closer to our local
markets.”
Sulzer was appointed following its successful completion of an appraisal procedure that all prospective ABB partners must pass. This assessed competence,
quality and the company’s ability to comply with ABB’s exacting standards.
“Although we considered several high quality candidates for this partnering role, our global alliance with Sulzer and its strong local relationship with the pump
business made it an obvious choice,” says Wright.
“The agreement with Sulzer means our customers get more service options in collaboration with ABB without compromising on quality.”
Among the field services that could be offered through Sulzer are ABB’s Life Expectancy Analysis Program (LEAP) and MACHsense. LEAP offers a range of
inspection services that optimise maintenance planning for electrical machines and predicts the remaining lifetime of the stator Insulation system. It helps
extend machine lifetime and minimizes downtime.
MACHsense is a condition monitoring service for electric motors that provides a warning of impending defects. As an early warning system, it provides time to
plan maintenance and reduces unplanned shutdowns.
UK sewer sensor research wins Australian prize
Researchers from two UK universities have won a major Australian innovation prize for their work on a
new type of sensor which has been used in Sydney’s sewers. The team from City, University of London and
Edinburgh Napier University won the 2017 Australian Water Association’s NSW Water Award for Research
Innovation.
Their collaborative research project focussed on the development of a new class of photonics-based
humidity sensors for Sydney Water’s use in the management and rehabilitation of deteriorated
concrete gravity sewers and corrosion at treatment facilities. The two UK universities produced
sensors with specialized, tailored coatings designed specifically to operate under the highly biofouling
and corrosive conditions in Sydney’s sewers. As a result of this successful research Sydney Water will
implement these sensors in a number of selected sewer locations and the findings will contribute to the
future design of sewers.
Professor Tong Sun, Professor of Sensor Engineering and Director of City’s Research Centre for Photonics & Instrumentation, said: “We are delighted that
our work with Sydney Water has been recognized with this Research Innovation Award at the recent Australian Water Association Awards Ceremony in New
South Wales. Our innovative fibre optic sensor technology, designed for and deployed in the city of Sydney, has enabled Sydney Water to undertake long term
monitoring in the harsh corrosive and biofouling conditions of the city’s sewers, offering major savings in terms of management and maintenance of this critical
asset.
“Through its international strategy, City, University of London, is committed to be the best at problem-solving in situations like this, operating wherever the
issues arise. We are pleased to be continuing our work with Sydney Water on a range of challenges to support the optimum management of their critical
infrastructure.”
The Australian Water Association is the national peak water organisation, delivering information, expertise and collaboration for sustainable water
management. Its membership includes professionals and practitioners working in utilities, science and research, energy and resources, manufacturing and
agriculture. It has an active branch network across all Australian States and Territories and maintain extensive international links, including with the International
Water Association.
Page 8
OTT Launches Feature-Packed ‘Hydromet Cloud’
The OTT Hydromet Group has launched a new web-based data management service
for remote monitoring stations. “Hydromet Cloud represents a step-change in data
management,” comments UK Managing Director Nigel Grimsley. “Subscribers to this
new service are provided with fast, simple access to both live and historical data, which
opens new opportunities for exploiting the value of ‘Big Data’.”
Packed with new features and highly cost-effective, Hydromet Cloud provides users
with easy access to secure data from field monitoring sites at any time and from almost
anywhere via hydrometcloud.eu or the Hydromet Cloud mobile App.Typical applications
include hydrology, meteorology and water quality.
Data are transmitted from field stations through a variety of methods including satellite,
cellular (GPRS/3G/4G) or wired internet connection, and stored/backed-up in the cloud.
Designed for flexibility, users are able to create their own dashboard to quickly
collate frequently viewed data, which can be displayed as plots, tables or values, and
exported in a variety of formats, which enables easy analysis of trends. This facility to
create a bespoke display is enhanced by a map view with colour-coded map pins (for alarm status), current data values and colour-coded parameter values
highlighting alarm status. Alarms are user-defined for values, rate of change etc. and alarm messages are issued automatically by email, text or push
notification on a mobile phone. Separate limits can be set for both warning and critical levels, and users can also create alarm distribution groups for
notifications.
The Hydromet Cloud mobile App provides a quick and easy opportunity to view the status of an entire network or an individual monitoring station, with
options to send/share data directly from a smartphone or tablet (iOS or Android).It is also possible to create and save ‘My Plots’ to quickly recall common plots
of one or more parameters graphically illustrating recent data.
Hydromet Cloud provides secure infrastructure to receive, decode, process, display, and store measurement data from nearly any remote monitoring station
via a cloud-based data hosting platform. Alternatively, for those wishing to conduct their own data processing, Hydromet Cloud delivers raw data (as it is
transmitted by the station) using a dedicated download page, which is updated as soon as the data arrives. The system is fully compatible with the latest OTT
and Sutron data logger/communication devices, in addition to a wide variety of OTT, Sutron, and Hydrolab sensors for water quantity and quality
measurements, as well as Lufft meteorological sensors, third-party sensors and IP cameras.
Summarising, Nigel says: “We are very excited about the opportunities that Hydromet Cloud will create for our customers. This is the first major new product
development since the acquisition of Sutron Corporation and is a great example of the synergy that has been created by merging the companies’ development
teams.
“Our customers know that data serves two purposes: one, to enable the analysis of background trends, and two to quickly and easily facilitate management
by exception when alarm conditions arise. Hydromet Cloud achieves both.”
The OTT Hydromet Group manufactures products that enable water professionals to monitor the planet’s most precious resource. Through the delivery of
accurate reliable data, OTT’s instruments and services provide essential tools to help protect the environment.
From precipitation through surface and ground water to marine monitoring applications, OTT’s measurement and communication technologies provide a
complete picture of the water cycle. Adcon Telemetry was acquired in 2011, and Sutron and Lufft joined the OTT Hydromet Group in 2015, which means that
the company is able to offer the best sensors and data handling technology for every application.
Completely focused on hydro-meteorology and water quality, OTT products have been market leaders for over 140 years and coupled with modern
communications technology provide remote access to continuous monitoring data.
Fieldbus International (Fint) Joins The ISA100 Wireless
Compliance Institute
The ISA100 Wireless Compliance Institute announced today that Fieldbus International (Fint), a global provider of fieldbus connectivity solutions, has joined
the ISA100 Wireless Compliance Institute.
Fint provides fieldbus network products and services to vendors and users in the process control and offshore industry. Fint specializes in products based on
the Foundation Fieldbus, Profibus, HART, WirelessHART and now ISA100 Wireless technology.
“We are pleased that Fint has joined the ISA100 Wireless ecosystem,” remarked Andre Ristaino, ISA100 WCI Managing Director. “Fint is well known for their
expertise in supporting industrial protocols and their engineering services for integrating technology, such as ISA100 Wireless into field devices and systems.”
“It is our ambition to advance this powerful technology by offering our products and services to manufacturers,” said Halvor Landet, Founder and CEO of Fint.
“Our products and services will enable manufacturers to operate on an ISA100 network in a straightforward way and with a bare minimum of investment.”
Page 9
Feature Article:
Is it possible to use flow data to
predict flow data?
Introduction
When you talk about the Smart Water industry there is a mantra – “data quality is king,” the sure-fire way to ruin any Smart Water project is to have data that
isn’t fit for purpose and is basically just bad quality. I have spent many a presentation up in front of an audience saying precisely this thing. Showing pictures
of poor quality installations, level based flow meters that have an interesting “tilt” to them or flumes that are peeling away from their concrete. Of course
this is true and you can’t make good quality come from nothing. However, I have frequently had people come up to me and disagree with me, the phrase that
comes to mind is if you have at least some good quality data the rest can be smoothed out. There is a person and a company within the industry who does a
huge amount with fuzzy logic and fuzzy sensing, this I understand as the “sensor” is created from multiple inputs and basically is created in a “Frankenstein”
sort of way patched from valve positions and other sensors that have an influence on the sensor that has broken down.
What I don’t understand is taking data that isn’t necessarily fantastic in the first place and using it to predict profiles of the way things are operating. Surely
this can’t be the case? So, what I decided to do is look at a large tract of good quality flow data and see if I could use that data, and that data alone, to see if I
could fit it into the following years data. The rest of this paper relates to the “musings that” I had with the flow data
The context
For this particular attempt to “play” with flow data I took ten years-worth of flow data from a large wastewater treatment works which has a dry weather flow
83,000m3/day (approx. 22 million US gal/day). The data came from a single ultrasonic flow meter over a large flume, the data quality over the ten years of
data was excellent with a data reliability of 99.92% over the ten-year period.
The data itself covered the period from 2005 – 15 and what I hoped to achieve from manipulating this data was being able to use the data set using simple
statistical function to see if it could be fitted to match the data that was produced in 2016. Now I am not a mathematician and so the statistics that were used
were basic.
Starting at a simple beginning I thought I would average the entire ten year data set removing the 29th February from the data set so as to remove this
temporal oddity and see what result I would get. The result can be seen graphically in figure 1 below:
Figure 1: Actual Flow (Blue) versus Simple Average Flows (Orange)
What can be seen from figure 1 is that simple average is a bit basic a statistical function to use to predict the flows with potentially the root cause of this being
the fact that ten years of average data does not represent a true situation. The major factor is of course weather which is not “typical”. It can be seen that
“average” data does not adequately predict wet weather or even dry data with storms in the January to March period being missed and the dry period
between the beginning of July and the end of October being missed.
So, building on this I looked at the ten year’s worth of data averaged it across the year and averaged the ten years-worth of data and took all of the years
which were “drier” than the average. For this particular data set this equated to five years of data. I then averaged the flow data across these five years and
got the results as shown in figure 2:
Page 10
Figure 2 Actual Flow versus Dry Year Flows
Figure 2 shows a closer match than by using a simple average with periods of the year closely matching flows for periods of the year. Although storms are
obviously not picked up the fit is improved but is certainly not representing the true situation. The next thought was whether there is a better a fit in data with
the wet weather years which in the context of this study was years where the average flow data was greater than the ten-year average, which also equated to
using five years work of data. The results of the “wet year comparison is shown in figure 3.
Figure 3: Average versus Wet Year Flows
In figure 3 it can be seen that the flows have a satisfactory match up until about May - June 2016 and then they diverge by a significant amount by greater
than the divergence in the dry year averages. The next question is whether the flow data is in fact somewhere in between. Would the average data within the
ten-year period provide a closer match? Taking the five years closest to the average of the ten-year data produced results which are shown in figure 4:
Figure 4 Average Flows versus a 5 -year average
Page 11
Using a five-year average manages a closer match in the flow data until the end of June where like the wet year data there is a divergence from the actual flow
data. At this point it became obvious that using total daily volume data and using simple statistics was not going to fully work and it was probably related to the
periodicity of the data that was being used. From this the divergences from the actual data needed to be accounted for in the flow data otherwise wet and dry
periods would not be picked up and divergences from the actual figure would continue to create errors within the data. By comparing the average across the
ten years of data in weekly periods and comparing this to the same week in 2016 would produce a factor for each week. This factor was then applied to each
individual days-worth of data with its week within the year. Figure 5 shows the results
Figure 5 Actual Flow Data versus average factorised data
Figure 5 of course shows a much better fit in data as it is actually using the 2016 data and applying a correction factor. In terms of the work that has been done
so far it could be said to be “cheating” however the use of the technique is actually quite useful as it could be used on a week by week basis to fill in the gaps
of the “odd” day. It is a case where basic statistics can be used to “smooth” flow data.
Looking at all of the graphs it is difficult to show how successful the techniques have been in predicting the flow data?
In the UK, we of course have the Monitoring Certification Scheme or MCERTS, under this scheme the uncertainty of flow data is allowed to be plus or minus
8%. Although this isn’t a good comparison it is the best quality standard that could perhaps be applied. Table 1 below shows the number of days in the year
that were predicted within the plus or minus 8% criteria.
Table 1: Success of the different techniques
Statistical Technique No of days within 8% % of the year within 8%
Simple Average 91 24.9%
Dry Year 106 29.0%
Wet Year 66 18.1%
5 Year Average 86 23.6%
Weekly Average Factor 223 61.1%
Going a step further
All of the data and the work that has been used so far has been based upon the total daily volumes but of course to really be able to predict the data it is
necessary to get a much better resolution of flow data – i.e. the 15 minute data that is typically used in the UK (and around the world). The nest question to ask
is to whether by going into a lot more detailed data would provide a much better quality of prediction?
For this part of the study individual days were examined and the cause of deviation was examined in the 15 minute data to see if there were any periods of the
day that were causing a particular problem. Figures 6,7,8, 9 below show the results of a bad day where nothing but the weekly factor average worked, a good
day where all techniques were within 8 % and days were the dry day statistic work and a day where the wet day statistic worked.
Page 12
Figure 6 Day which shows poor agreement
Figure 7 Day which shows good agreement across the statistical techniques
Figure 8 Day which shows good agreement with the dry year statistical technique
Technique Agreement
Simple Average -17.2%
Wet Year -18.1%
Dry Year 16.4%
5 Year Average 23.0%
Weekly Average Factor 5.0%
Technique Agreement
Simple Average -5.6%
Wet Year -6.2%
Dry Year 5.1%
5 Year Average 3.6%
Weekly Average Factor -5.4%
Technique Agreement
Simple Average -5.3%
Wet Year -12.6%
Dry Year -0.8%
5 Year Average -.3.3%
Weekly Average Factor -9.6%
Page 13
Figure 9 Day which shows good agreement with a wet year statistic
The last technique that is going to be used in this paper is to use data at different periodicity during the day and seeing how much of a fit can be applied. Taking
data from 1,3,6,12 & 24 hours and applying this to calculate a total daily volume produced the data as shown in figure 10.
Figure 10: Scatter-graph of accuracy for hourly, 3 hourly, 6 hourly, 12 hourly and daily flow figures used to calculate the total daily flow volume
	
From this data it can see that by using hourly data the quality of the total daily volume Is highly accurate with every single piece of data falling between -3.3
-4.5% uncertainty. This would be classed as acceptable data for the whole years-worth of data. If 3hourly data is used only 2 days of data would fall outside the
acceptable uncertainty for use rising to 17 days using 6 hourly data.
Discussion
Using good quality data on a relatively easy site it was possible to predict total daily volumes using the data that was available. The most successful technique
that was used was to use within day data. It was very interesting that hourly data near perfectly matched 15 minute data which challenges the fact as to why
we, as an industry, need to use 15 minute data. Why can’t we use hourly data? Of course the answer is that it depends upon what the data is used for but as
can be seen in this case for total daily volume there is no reason why not.
The most successful technique when the temporal resolution used daily data was to apply a weekly factor but of course this paper is missing crucial elements
in this technique that could make the quality of the predictions much more accurate and that is of course rainfall data. Without the rainfall data a total of 223
days fell within the 8% uncertainty if other factors were taken into account this could potentially could be much more accurate.
This paper at the end of it used simple statistical techniques to see if there is a potential of using data to smooth data, to predict what the data should be should
physical methods of flow measurement should fail. The answer at least in this simplistic format is that it can be to a certain extent. However, in this case the
quality of the data to start off with was very good. The next challenge is to stretch the hypothesis and see if it breaks or not.
Technique Agreement
Simple Average 6.6%
Wet Year 0.7%
Dry Year -11.5%
5 Year Average -7.0%
Weekly Average Factor -9.9%
Page 14
The water industry is using digital technologies and analytics to derive more value from its physical assets. The need for this sector to change and evolve could
not be greater: The organizations that manage water supplies around the world are facing critical issues, and water scarcity is chief among them. Because of
changes in our lifestyles, including increased consumption of grain, meat, and cotton clothes, growth in water consumption per capita has doubled over the
last century. And demand is increasing. According to a 2016 report from the UNEP-hosted International Resource Panel, water demand will outstrip supply by
40% by 2030. During the same period, according to the World Economic Forum, water infrastructure faces a huge $26 trillion funding shortfall. If not addressed,
water scarcity will squeeze food and energy supply chains, and stall economic growth.
To help solve this problem, organizations are using digital technologies and data analytics to improve leak detection. According to the World Bank, the
world loses about 25-35% of water due to leaks and bursts, and the annual value of this non-revenue water — water produced and lost by utilities — is
$14 billion. Organizations are also using these tools to improve maintenance, infrastructure planning, water conservation, and customer service (including
repair efficiencies and pricing).
Although members of the water industry have found success using digital technologies and analytics, they’ve also faced challenges when trying to transform
the roles and mindsets of their employees and their internal- and customer-facing processes. But those that have managed to integrate their technological
advances with two other key elements — people and processes — have created more than data; they’ve also created value for their enterprises and society.
People: Good leaders know that using and interpreting data is not only a search for insights; it’s also about enlisting the hearts and minds of the people who
must act on those insights. The challenge is that employees are used to doing things in a certain way, and aren’t always quick to change. For example, despite
the social and efficiency value of using predictive analytics to prevent water leaks, many utility managers view themselves as heroes for responding after the
leak has occurred. As one U.S. executive explains, “Most current practice is to wait for the service-failure event and judge performance by reacting to it, because
the utility doesn’t get credit from regulators or the media for preventing leaks that the public doesn’t know about.”
Regulatory incentives often exacerbate this behaviour. In many parts of the world, the increased operational and infrastructure costs are simply passed on to
consumers. In other regions, however, (e.g. Australia, Israel, the U.K.), regulators steeply fine utilities for inefficiencies – and it’s no coincidence that a number
of utilities in these countries have been leaders in adopting new digital tools.
But even with proper incentives, there are still challenges. For example, many U.S. utilities have installed smart meters — an investment that can easily surpass
$60 million in cities with 150,000 water connections, or about 15% of average annual utility revenue and water rates. But after making this investment and
charging consumers for it, there were false alerts about leaks, which caused expensive repairs and claims processing. The law of unintended consequences
was also alive in operations: because of the initial problems, the field transmissions group distrusted the data — even after the IT problem was diagnosed and
resolved – and therefore required additional training to assuage their doubts.
This is why it’s imperative to change roles, break down silos, and adopt new decision support systems when implementing new technologies. A water
authority in Australia, which deployed a software solution for improving network efficiency, is a case in point. Its managerial team first formed a working group
of personnel from business units across the organization — from retail and asset management to planning and maintenance crews. The group met weekly and
by doing so they recognized that the software detected faulty incidents and provided a focal point to collect information (e.g., types of problems, magnitude,
location, etc.) to make better decisions in other areas of the business. As a result, they created procedures that shortened the average repair cycle by 66%,
saving millions annually.
Longer term, the information allowed the team to make more focused investments based on types and frequency of problems in each zone, and the ability to
compare — and negotiate better terms with — vendors based on quality and performance.
Processes: As with other sectors, water utilities are going through a shift from treating users as connections who pay bills, to customers that have needs,
habits, and strong opinions if things go wrong. And data analytics is enabling them to provide faster and more effective responses. “We can compare the
efficiency in each of the six sectors making up our network and evaluate the response time it takes to identify potential damage, ensuring faster repair times,”
an executive at one of Romania’s leading water utilities told us. “As well as smarter insights, the event management system ensures better managerial attention
to continuous improvement in our operations and service to customers, and helps to prevent large-scale damage from hidden leaks.”
But in order to achieve those outcomes, the Romanian utility had to change its organizational processes and metrics. The utility had to re-define company
metrics goals and create weekly and monthly processes for reviewing performance-against-goals. The software provided relevant data — e.g., the start time
of a leak and when it was fixed, based on real-time information, not when reports were submitted. But it was new customer-facing processes such as setting
repair-cycle targets and comparing performance-against-goal by region, which created a healthy sense of internal competition and led to more productive
behaviours.
These issues aren’t unique to the water industry; they’re also relevant to companies in other industries that are using data and digital tools that are increasingly
available.
For example, sales is the focus of potentially big improvements via new tools that can provide better lead generation, forecasting, and targeting. But in order
to take full advantage of these tools, sales organizations will need to change their compensation incentives, internal processes, and the skill sets of their staffs,
among other things.
More generally, while most current talk about big data seems to assume the replacement of physical assets by digital technologies, a larger and more impactful
trend is the use of online tools to improve physical asset utilization in off-line businesses, as in the water industry. In that context, the role of data is not to make
a manager sound analytical. Its role is to help make better decisions and drive value for the company. And you can’t do that only with technology or analytics,
no matter how good they are.
Article:
How the Water Industry Learned to
Embrace Data
Page 15
Article:
Smart Wastewater Networks from
Micro to Macro
What does it mean for a wastewater network to be “Smart?” What is the Wastewater Industry hoping to achieve by going on a “Smart” Journey? It is a
subject that has rattled around the water and wastewater industries for many years and yet most of the focus has been on the potable water network side of
the business where the obvious gain is reducing non-revenue water. However in the past few years the value of acting more “intelligently” in the wastewater
network…nay the wastewater system has come more to the forefront as the value of taking a similar journey to our potable water colleagues comes to bear.
The question is though, where do we start? The wastewater network is a complex system as it has multiple inlets and multiple outputs (if you take storm
overflows) in to context. The answer from some of the Water & Sewerage Companies (WASCs) and consultants working with them has been to take a number
of different approaches as we have recently heard at a number of conferences and workshops in the area of Smart Wastewater Networks.
Starting small and from the ground up
The major problem is understanding what exactly the problem is and from where it comes
from and in doing so devising a strategy for its resolution. Is the problem related to
•	 Flooding of both internal & external properties
•	 Pollution incident detection and management
•	 Alarm handling and response
•	 Blockages & sewer misuse
•	 Asset reliability & the cost of running the network
•	 Sewer capacity and storm overflows
•	 All of the above
In truth, it is a combination of all of the above and there are various teams in all of the
WASCs handling different aspects of what has to be done to protect the customer and the
environment.
One of the major issues is that of sewer misuse be it from fats, oils & greases to the
wonderful aspects of what people throw down the supposed “wet bin,” any network
technician in the industry will talk about FOG and unflushables as a major problem that has
been attributed to 50% of all pollution incidents and 66% of all flooding incidents for one of
the UKs WASCs. The solution is of course education and working with customers to understand the consequences of putting the wrong thing down the drain.
Despite this there are technological solutions to the problem as well. A recent SWIG workshop heard from one engineer his vision of building the technological
solution up from the bottom by using a combination of pump reversal modules that reverse the pump to clear blockages on an automatic basis, to restarting
pumps to providing flow meters to detect whether a pump is actually working or not. The effect is to increase the technician visibility of what is going on in the
network and enable them to be more effective in their diagnosis of issues protecting the customer in a more efficient manner but also protecting their Health
& Safety by ensuring they are not called out to a false incident in remote areas in the middle of the night.
And getting bigger….
Working on the small scale has its value but of course it won’t resolve all situations and there is a place for increased monitoring in the wastewater network
with the major benefit being the protection of the Environment. This is where the Event Duration Monitoring programme comes in that is one of the focuses of
the Water & Sewerage Companies this Asset Management Period (AMP). It stems from a Ministerial Direction that promised the monitoring of the “majority”
of storm overflows by 2020. The knowledge about these assets and their performance has been questioned and the subsequent impact on the environment
a big question that the Minister and the Environment Agency want answered to find out the inherent problems that lie in the wastewater collection network.
Over the next few years teams of people will install thousands of monitors prioritised so that the highest impact areas are completed first to monitor when,
where and for how long spills from the wastewater network are happening.
The first monitors have been installed and a year’s worth of
data collected and approximately 12% of combined storm
overflows warrant further investigation based upon their
current performance and depending upon the results drive
further investment within the network infrastructure. The
thing for the future is to see what impact any schemes have
on the holistic environment to see what improvements can
be made and what impact this has on the holistic water
environment and the quality of future discharges from our
wastewater treatment works.
Page 16
Figure 1: Some of the problems in the Network from blockages to pump
wear to seals stopping working. Cost range into millions of pounds (From
Lorenzo Pompa - The benefits of using automation in the network)
Figure 2: The % of CSO spilling from the first year of EDM Data (From Phil Hulme - Application of storm overflow
Event Duration Monitoring Data)
…..and bigger
Taking a step on from the monitoring of the network the next question that has to be asked is what we can do to provide a more strategic management of
the wastewater network. It is an approach that has been taken in Europe for many years. The multiple reports by UKWIR & Mouchel on Active System Control
describe in detail what work needs to be done and what has been done in other countries. A great example of this is the work in Denmark that has been done
to provide an overall management of the wastewater network using high speed modelling techniques that allows the wastewater network to be managed more
effectively.
An example of this is the work that was done in the Southern Water
region of the UK in the Eastney project that has used a combination of
modelling techniques and rainfall radar as part of the solution to mitigate
the risk of flooding within the area. This was part of a much wider
solution that included green infrastructure but the Smart
Wastewater Network gives the company advanced warning of what is
going to happen moving forward and allows the company to make
decisions on methods of operation of the pumping station which is a
critical part of the overall wastewater treatment system.
The individual parts of this project form building blocks to what the Smart
Wastewater Network is made up of including (in a simplified way):
•	 Weather radar and modern rain gauges
•	 Sewer Level Monitors
•	 Centralised sewer network model capable of fast simulation
•	 Communication and telemetry systems to tie it all together
The weaknesses if anything is the quality of the weather radar systems
but this data as a service is a solution that others within the Water
Industry are looking at – a couple of years ago high quality XRF weather
radars were investigated by the University of Delft and weather data and
prediction has become a data service within the Water Industry. It is the
impact of the weather radar and using the data from the rain gauges that
will allow for predicative models to look at the impact onto the “Smart
Network” to help the industry to manage the flows that we receive.
The future of Smart Wastewater Networks – a holistic approach
The ultimate aim of a “Smart Wastewater Network” is to help the water industry to make a better, informed decision about how to operate the wastewater
system by facilitating the flow of wastewater through the entire system all the way from the customer’s toilet, through collection, into treatment and out to
reuse or recycle in such a way that we optimise not just the cost of the whole process by the impact that it has on both people and the environment.
Operationally, this is by limiting the incidents and events such as pollutions and flooding to either zero,
the brave aim of the future, or to as near to zero as we can possibly get. This can be achieved and we
are seeing water companies take this approach now with a number of different technologies. All the
way from a simple “Customer Flood Alarm” that warns of rising levels in areas of known problems so
that issues can be dealt with priority to systems that stop pump blockages and warn of problems such
as using pump reversing, monitoring of pump currents and using flow meters to give a true picture of
what is happening.
The strategic direction is looking at the much wider more encompassing systems and the advantage
here is to limit the capital build of detention tanks in the network and storm tanks within the treatment
works. The best case of this was in Barcelona where a Smart Wastewater Network was constructed for
the Olympics in 1992. The alternative was a vast detention tank under the centre of the city and the
Smart Wastewater Network approach was the considerably cheaper option.
From a holistic point of view the treatment works must be brought into the equation too and it is at this
point, bringing together two aspects of the industry – network and treatment, where the real savings can be made by controlling the flow of water through the
whole system and limiting the environmental impact of the wastewater systems that we can truly get more for less.
So, what does this wastewater system of the future look like?
In normal day to day conditions the smart wastewater network of the future controls flows flattening out the flows that are received at the wastewater
treatment works, monitoring how much time sewage spends in the network but also aiming for a completely flat flow profile at the treatment works, with
regular automated flushing cycles to ensure that the sewer keeps as debris free as possible controlled by sewer level monitors to pick up unusual levels that
might highlight blockages starting to develop. Various tools are used to keep the problems at bay such as pump-reversing and flow monitoring to ensure that
the flows keep moving and pumps don’t block. Where problems are starting to appear and hot spots start to develop this drives an alert to look into potential
sewer misuse. Combined Storm Overflows from the system are dry.
Figure 4: - A customer “sewage alarm” (From Rachel
Cunningham - Smart Initiatives to prevent flooding)
Page 17
Figure 3: The building blocks of Smart Catchment Management from real time data to modelling to
operational forecasts will play and element in the future (From Jody Cockcroft - Portsmouth Flood
Alleviation Scheme
Flows pass forward to the treatment system where the relatively uniform flows enable an efficiency in the treatment and the virtual elimination of the need for
treating peak flows. This enables a uniform production through the process which further improves the treatment efficiency.
The system predicts a rainfall event and this is where the intelligence of the system kick in. The prediction is that the sewer in its current state can’t manage all
of the flows within a 6 hour period and the system re-calculates and ramps up flows minimised so that the required capacity of the sewer is available with an
appropriate safety margin. The flows are managed and held within the sewers. The CSOs are still dry. The rain-storm continues longer than predicted and this
causes a potential problem at a customer’s premises. This causes an alert in the control centre and allocates a team to resolve the issue for the customer so
that an incident doesn’t happen.
Now this is a fictional, potential, system of the future but what we have heard at the various workshops and conferences is that this is a future that in
reality isn’t that far away. The technology exists from the sewer alarms, pump-reversing systems and the potential for network flow monitoring as well as event
duration monitoring on the network as well as the customer flood protection alarms. Taking a step up in complexity the weather radar systems, network model
and active system controls systems also exist and finally the analytics and visualisation systems also exist to so that the vast amount of data that is inevitably
produced is shown in a way that can be understood and actioned upon.
It’s a system that is starting to be developed by some of the Water Companies and more recently we have seen the development of the factory approach that
was famously mentioned in the STOWA report of the wastewater treatment works of 2030. Arguably things have gone in a slightly different direction and the
energy, water & nutrient factories have their “production efficiency monitoring system,” which any other industry would consider its absence, at best, unwise.
The approach is of course working fantastically well and the extension of this approach to the wastewater network is just another step to a “Smart Industry”
future.
IBM and Dublin City University Water Institute Collaborate to
Advance IoT Research for Water Management
IBM have announced this month with the Dublin City University (DCU) Water Institute a collaborative research pilot to leverage Internet of Things (IoT
) technologies for environmental monitoring and management. The deployment of DCU sensors with IBM’s machine learning and cognitive IoT
technologies will aim to help protect and conserve natural resources and address environmental management issues such as water quality for both freshwater
and marine environments.
IBM’s cognitive IoT technologies are able to provide deep learning capabilities for sensor platforms, which ensure quality and reliable data capture under a range
of environmental conditions. Advanced analytics embedded in IoT-based sensor platforms, or the sensors themselves, can help detect subtle trends or early
detection of environmental changes that may be crucial to public health and safety or remediation efforts.
The collaboration brings together IBM Research efforts in the area of cognitive IoT-based environmental solutions with DCU’s Water Institute expertise and
leadership in environmental sensing via the university’s National Centre for Sensor Research (NCSR). As a part of the program, IBM has joined the DCU Water
Institute Industry Advisory Council.
IBM scientists are working on integrated IoT solutions to support a myriad of sensors to help better understand and ultimately manage a multitude of
ecosystem challenges. These may include water quality changes due to natural, artificial, or climate-related effects. Sensors can measure physical, chemical, and
biological parameters to help better understand changes in the environment. Applications may include improved management of pollution from sources such
as agricultural or storm water runoff that can affect lakes, rivers, estuaries and marine ecosystems.
IBM and DCU Water Institute will be selectively piloting these technologies in Ireland and in the United States. The first sensors are being deployed on Lake
George in New York State in conjunction with the ongoing Jefferson Project at Lake George.
“Over the next few years, we believe that Internet of Things technologies will play an important role in helping protect the environment and natural resources.
At IBM Research, we are excited to leverage IBM’s expertise in cognitive and IoT environmental monitoring and management with the DCU Water Institute to
help advance the future of water management,” said Harry Kolar, Distinguished Engineer, IBM Research.
The collaboration will focus on newly developed DCU sensor technologies that can have the potential for monitoring several key aspects of water quality at
costs significantly lower than current commercial technologies. This new generation of sensors, when combined with IBM’s environmental IoT platform may
eventually help provide significant benefits for water management on a global scale.
“The technologies developed during this important collaboration will aim to disrupt the current norms of costly sensors limiting their distribution at IoT scale to
provide really valuable information which supports better decision-making about our valuable water resource,” said Professor Fiona Regan, Director of the DCU
Water Institute.
The DCU Water Institute aims to develop technology-based solutions to facilitate greater water stewardship, translating technologies developed in the NCSR to
the water domain. DCU Water Institute scientists and engineers are developing novel sensor and data analytics technologies to improve how we monitor water
quality.
Page 18
Article:
Developing an alternative
to Coriolis flow measurement
Coriolis flowmeters first came into commercial use in the 1970s and ever since they have been developed and
refined to meet a growing number of applications across a wide range of industries. However, where fluid
density is not required, there is an alternative that offers all of the accuracy of Coriolis as well as addressing
many of its substantial drawbacks.
Developed by fluid control experts at Bürkert, the FLOWave product uses Surface Acoustic Wave (SAW)
technology to deliver precision flow measurements from a smooth, uninterrupted flow-through pipe section
- meeting all the requirements of a hygienic application.
The demand for more advanced, non-contact measurement technology has seen the rise in ultrasonic,
electro-magnetic and Coriolis technology and each of these have their place. However, even these devices
have limitations including non-conducting liquids or those containing bubbles or debris. Ultimately it may be
the location, space or orientation that may determine the most suitable design for a particular application.
Challenging the constraints of flow measurement
Coriolis flowmeters are regarded as the top specification flowmeter due to their versatile capabilities for both
fluids and gases. However, the initial cost of such devices can be very high and they do have some constraints.
The design requires the flow direction to be determined before installation and once installed there will be a pressure loss across the flowmeter, depending
on the specification. In addition, the designer may have to choose between drainability and accuracy since the more accurate bent-tube Coriolis flowmeter is
difficult to drain and may present a contamination issue. In such cases it may be necessary to specify the straight-tube Coriolis device to ensure hygiene
standards are met, but this can be at the expense of accuracy.
In terms of liquid flow measurement, there is a clear opening for a lower cost device which can deliver a compact, non-contact measurement which is accurate
irrespective of media characteristics, flow direction and flow conditions. In answer to that designers at Bürkert have developed SAW technology to create an
extremely compact device that has the same hygienic properties and cleanability as the rest of the process pipework.
Accuracy without compromise
Until now, it has been difficult to match the accuracy levels
demonstrated by Coriolis, without introducing other weaknesses to
the application. Magmeters rely on the process fluid being conductive,
while other designs require components to be in direct contact with
the fluid, making it difficult to meet the necessary hygiene standards.
Accuracy and repeatability often rely on laminar flow which can require
certain lengths of straight pipe upstream of the flowmeter. Continued
testing and development of the FLOWave product has minimised
this requirement. In addition, the use of Bürkert’s Teach-In function
introduces automatic calibration that can maximise accuracy, even in
applications that require short pipe runs.
Another issue that dominates discussions around flowmeter selection
is weight, especially in process skids, where it needs to be minimised in
order to retain the portability of the skid. The basic design of Coriolis
flowmeters does put them at a disadvantage, in some cases a DN25 unit
can weigh over 15 kg, compared to just 2.4 kg for the Bürkert product.
In situations where the flowmeter needs to be removed from the
installation for any reason, such as cleaning, the implications for manual handling need to be considered. It may require additional mechanical assistance,
which will add to the overall time for maintenance or cleaning.
Finally, any discussion regarding Coriolis would not be complete without some mention of the initial cost. Due to the technology and the scale of these
flowmeters, even the most basic specification can represent a significant investment. Furthermore, the energy consumption of the two oscillators is
considerably higher than more modern flowmeters such as the FLOWave.
Figure 1: The FLOWave product uses Surface
Acoustic Wave (SAW) technology to deliver precision
flow measurements from a smooth, uninterrupted
flow-through pipe section.
Figure 2: The FLOWave works regardless of flow direction and conductivity of the medium, and will
evolve to measure multiple parameters.
Page 19
Improving technology to reduce costs
FLOWave offers a way to measure the flow of a liquid and its temperature without installing a large, expensive, and energy-draining piece of equipment. As well
as being a leap forward in terms of size and energy use, FLOWave is free from parts in the measuring tube.
This cuts the risk of contaminating the medium to zero while also eliminating pressure loss, leakage, and dead zones. FLOWave works regardless of flow
direction and conductivity of the medium, and will evolve to measure multiple parameters.
From the outset, FLOWave aimed to resolve the traditional issues associated with the Coriolis flowmeter, such as cleanability, pressure drop, weight, cost and
energy consumption. At the same time, the designers were also keen to launch a product that could be improved over time, using more reference data to refine
the measurement algorithms for different types of media, which is very much the case with FLOWave.
This innovative product already addresses many of the challenges set for it by making improvements on existing precision flow measurement technology,
specifically Coriolis. However, it is also set to continue to be developed further, to widen its appeal for other applications and help more process engineers
achieve their goals in a more cost effective manner.
A digital future for Severn Trent Water
Severn Trent PLC has held a Digital, Innovation & Technology showcase event for investors outlining how cutting-edge digital technologies are transforming
the business and driving value for customers, employees and shareholders.
Severn Trent said that by using cutting-edge digital technology and innovation it is driving improvements in customer outcome delivery incentives, developing
a more efficient workforce and underpinning its ability to generate totex efficiencies.
Digital technology is also being used to enhance Severn Trent’s understanding of its network and prioritise investments to position its asset base for the
current and future regulatory periods.
Severn Trent told investors that its digital strategy is making a huge difference today and that it was continuing to drive and embed a digital future. All of the
investments pay back on a two year basis.
The water company has also established a new customer management portal which collates diverse sources of information into a single, insightful view of the
customer. It also has a multi-channel offering for customer contact in place, including self service, web chat and social media. According to Severn Trent, it is
currently the only water company with 24/7 availability for all calls, not just emergencies.
The water company is targeting a significant annualised run rate totex reduction of £20 million via a range of improvements e.g. reducing operating costs, less
travel time, shorter time per job and more efficient use of chemicals and consumables.
Severn Trent said it is taking smarter investment decisions through a range of measures:
•	 Improving data capture of asset health and maintenance tasks
•	 Using analytics to predict asset deterioration
•	 Reducing risks by real-time water quality measurement and insight
•	 Creating a culture to embrace new technologies, including satellite imaging, to continually reduce costs and risks.
Digital technologies now being used across the company include new apps and devices, a new network modelling system, new quality analytics, connecting
sensors and analytics to prevent flooding and pollution and the development of satellite imaging. The firm is also looking at developing opportunities for
further efficiency through innovation, such as drone inspection.
Apps play a key role
A wide range of apps are now being used by Severn Trent, including:
•	 new fieldworker apps and devices
•	 new stores apps and centres
•	 new treatment works app
•	 new colleague app for customer ODIs
•	 supply chain now on fieldworker app
•	 new risk management app
The new devices being used, with easier to use fieldworker applications, improved connectivity and greater mobility, include the latest version of Panasonic’s
Toughbook.
Severn Trent’s own internal app team have built two new applications for use in the field;
SiteSnap
Page 20
•	 Simplifies the creation of 100,000 traffic management sketches per year
•	 Reduces the number of permit application rejections
•	 Saves technicians 20 minutes per day, equating to £360k per year
SiteView
•	 App records evidence of compliance with strict Highways Authority requirements
•	 Severn Trent expects to avoid £250k per year in fixed penalty notices
The utility has also consolidated its stores into three regional distribution centres and six satellite stores and implemented new stock management
technology. Bar-coded stock control has been used to create a supermarket style self-service experience. The new system has improved stock availability,
reduced risks and enabled better supplier discounts, generating savings of £1.2 million per year through improved stock availability and reduced one-off
purchases.
Looking for new opportunities to use satellite technology
In other areas of the business, Severn Trent is exploring options to use satellite technology to enhance asset monitoring and inspection regimes. The firm is
actively looking for new opportunities to use cutting-edge satellite technology. The first pilot has the potential to help identify leakage locations and will help
reduce the cost to resolve leaks. The technology works by identifying interactions of soil and chlorinated water – Severn Trent said it would seek to roll it out
further if it could demonstrate a strong return on investment.
Expanding use of data and analytics
New high-speed data loggers are also being deployed around the network to support a move to prediction and prevention. The loggers provide real-time
information directly to the control room, enabling the identification of pressure spikes which can lead to asset failure. The technology helps identify the root
cause of failure to assist prevention and enables proactive intervention to prevent assets from deteriorating – avoiding £1.5m in customer ODI penalties.
Severn Trent said it is using the wealth of data in its systems to build analytical capabilities and help analyse the network, expanding the use of data and
analytics to support overall management of asset health.
In its wastewater network, the water company is using an operational decision management tool to help identify blockages in the network and automate
decision making. Data from 1,000+ loggers combined with historic data and weather information can be used to identify when a sewer is most likely to be
blocked. The system helps prevent flooding and pollution incidents, improving Severn Trent’s predictive capability by 33%, reducing pollution incident by 50 per
year and avoiding £3 million in penalties.
Intelligent pumping stations to optimise pumping operations
The company is also looking at intelligent pumping stations and catchment control – a network pumping station trial is utilising machine learning, automation
and remote control to optimise pumping operations. Severn Trent is also collaborating with the supply chain to create intelligent assets within the network –
the overall aim is to optimise the network by utilising the large amount of latent storage.
Severn Trent’s new app-based Operational Risk Management (ST-ORM) system allows easy recording of operational risks identified and enables employees to
record all operational risks, real-time, wherever they are on mobile devices. The firm is forecasting £400k per year totex saving through proactive risk mitigation.
New drone technology is also being used to inspect assets - applications including asset inspections, leading to savings from absence of scaffolding and
minimised health and safety risks.
Estimated inspection cost savings of £300k per year and the utility is also currently exploring other uses, such as checking that treatment processes are
optimised.
Pushing forward with technological advancements can continually drive down costs and risks
Liv Garfield, Chief Executive Severn Trent PLC, said:
“I am delighted to be showcasing how we are truly digital in what has been perceived to be an analogue sector and driving clear value for all our stakeholders.
Being at the frontier of adopting digital technology and innovation positions ourselves to drive value in our company which leads to a better experience for our
customers and strong financial rewards for our shareholders.”
“Digital technology and innovation enables us to provide our core products; water, waste and retail services at the right costs and to the right quality. It makes
us work more efficiently, helps manage our energy costs, and optimises the way we buy and use consumables. It also helps to reduce our cost to serve and bad
debt management.”
“We are committed to maintaining our upper-quartile position versus our peers in our waste business and moving to upper quartile in our water and retail
business, and I am excited to be able to show just how digital is being used to do this. By pushing forward with technological advancements - all of which pay
back under two years - we believe we can continually drive down costs and risks in our business and build an enduring track record of high operational and
financial performance now and into the future.”
Page 21
Don’t miss the upcoming SWAN 7th Annual Conference to be held 9th
-10th
May, 2017 at the Tower Hotel in London. This
year’s conference will focus on creating smart, resilient water and wastewater systems, encompassing four key pillars:
•	 Safe water quality
•	 Reliable service
•	 Secure systems
•	 Efficient operations
This two-day event will feature 20 leading, global water utilities, including speakers from Veolia, Suez, PUB, American
Water, Unitywater, Essbio, AEGEA, FCC Aqualia, Vitens, City of Dakar, Taiwan Water Corporation, and the OECD.
SWAN is pleased to offer conference attendees a special rate of £185 inc VAT (inc breakfast) at the Tower Hotel. Note,
this rate will only be available until March 10th.
View the agenda here
Register here
Proudly Sponsored by
Page 22
April 2017
Smart Water Systems
24th
-25th
April 2017
London, UK
Hosted by the SMi Group
May/ June 2017
Specification & Installation of Sensors
3rd
May 2017
Principality Stadium, Cardiff, Wales
Hosted by the Sensors for Water Interest Group
SWAN Conference 2017
9th
-10th
May 2017
Tower Hotel, London UK
Hosted by the SWAN Forum
Leakage
24rd
May 2017
NEL, Glasgow, Scotland
Hosted by the Sensors for Water Interest Group
12th
Specialized Conference in ICA
11th
-14th
June 2017
Quebec City, Canada
Hosted by the International Water Association
July 2017
Low Cost Sensors
5rd
July 2017
University of Southampton, UK
Hosted by the Sensors for Water Interest Group
September 2017
Sensing in Water 2017
27th
-28th
September 2017
Nottingham Belfry, Nottingham, UK
Hosted by the Sensors for Water Interest Group
October 2017
Wetsus Congress
9th
- 10th
October 2017
Leeuwarden, Holland
Hosted by Wetsus
Page 23
Conferences, Events,
Seminars & Studies
Conferences, Seminars & Events
Specification & Installation of Sensors: Giving the
sensor the best chance
Where: 	 Principality Stadium, Cardiff
When: 		 3rd
May 2017
Getting reliable data from sensors and instruments relies on three key
steps – getting the right instrument for the job, installing it correctly and
performing appropriate on-going maintenance and calibration. This event
focuses on the first two steps. To get the right instrument needs a good
specification and understanding of the application. We will look at the role of
Standards, from MCERTS to ISOs, from the viewpoints of users and suppliers,
exploring whether they can be a barrier or an aide in improving quality and
innovation. We will also look at the role that robust technical evaluation can
play in procurement of instrumentation against a user specification for a
particular application. Good installation practice is also key to good
performance. Some of the latest findings related to installation of flowmeters
and other instruments will be presented.
Leakage
Where: 	 NEL Glasgow
When: 		 24rd
May 2017
Leakage of water from the distribution network continues to challenge the
water industry. Water companies are focussed on managing leakage to levels
that are acceptable to customers and justifiable on economic grounds. The
industry is also concerned about the long term resilience of water supply, and
see the need for lower levels of leakage to improve resilience. At the same
time, many water companies have incentivised targets to reduce leakage
further.
Therefore, there is a need for reliable and accurate measurement of leakage
in the distribution system; from the point of abstraction, through the treat-
ment process, and up to the customers’ stop tap. Improved measurements are
needed in terms of quantifying leakage in different areas, accurately pinpoint-
ing leakage in the network, and prioritising leakage repairs.
Sensors, measurement systems and data analytics play an important part
in managing and reducing leakage. This workshop will bring together water
companies, researchers and the supply chain to explore how new technologies
and systems can help to reduce leakage and save water.
Sponsored by
APRIL
2017
COPTHORNE TARA HOTEL, LONDON, UK
www.smart-water-systems.com
Register online or fax your registration to +44 (0) 870 9090 712 or call +44 (0) 870 9090 711
SPECIAL RATES AVAILABLE FOR UTILITY & PUBLIC SECTOR ORGANISATIONS | GROUP DISCOUNTS AVAILABLE
HIGHLIGHTS IN 2017:
• The hidden value of Data and Information –
innovative solutions to improve your strategies
• The water industry after the Smart Meter
Roll Outs – learn about the most recent
developments and challenges water utilities
are facing
• The Scottish concept of a Hydro Nation –
improving water economy by addressing the
value of water resources
• International data insight – an experience
report on Real-Time Demand forecast and Big
Data challenges
• Customer-focused engagement programmes
to improve satisfaction – how these
developments are changing customer service
SMi presents its 6th annual Conference on…
Smart Water
Systems
Addressing the latest Smart Water
Management issues and Data-Driven solutions
REGISTER BY 16TH DECEMBER TO SAVE £400 | REGISTER BY 31ST JANUARY TO SAVE £200 | REGISTER BY 28TH FEBRUARY TO SAVE £100
@UtilitiesSMi
#SmartWaterSystems
CHAIRMAN FOR 2017:
• Jeremy Heath, Innovation Manager, Sutton and East Surrey
Water plc
FEATURED SPEAKERS INCLUDE:
• Ali Fanshawe, Metering Strategy Manager, Thames Water
• Andy Smith, Regional Optimisation Manager, Anglian Water
• Jon Rathjen, Group Leader Water Industry Division, Scottish
Government
• Ben Earl, Water Efficiency Manager, Southern Water
• Ken Black, Optimisation Manager, Northumbrian Water
• Antonio Sanchez Zaplana, Engineer Manager, Aguas de
Alicante
• Mike Bishop, Head of Operational Control and
Development, Dwr Cymru Welsh Water
A: Customer and Stakeholder Engagement in the Digital Age:
How can new technologies and their application transform
your key relationships
08.30 – 12.30
Hosted by: Chris Wallace, Director and Founder, WallaceTransform
B: The fundamentals of Data & Information in the
Smart Water Industry
13.30 – 17.30
Hosted by: Oliver Grievson, Group Manager, Water Industry Process
Automation and Control Group
PLUS TWO INTERACTIVE HALF-DAY POST-CONFERENCE WORKSHOPS | WEDNESDAY 26TH APRIL 2017
CONFERENCE:
24TH - 25TH
WORKSHOPS: 26TH
Page 24

More Related Content

Viewers also liked

Principios Lean: Una perspectiva histórica desde las cadenas de producción ha...
Principios Lean: Una perspectiva histórica desde las cadenas de producción ha...Principios Lean: Una perspectiva histórica desde las cadenas de producción ha...
Principios Lean: Una perspectiva histórica desde las cadenas de producción ha...Lean IT Association
 
IBM Presents the Notes Domino Roadmap and a Deep Dive into Feature Pack 8
IBM Presents the Notes Domino Roadmap and a Deep Dive into Feature Pack 8IBM Presents the Notes Domino Roadmap and a Deep Dive into Feature Pack 8
IBM Presents the Notes Domino Roadmap and a Deep Dive into Feature Pack 8Teamstudio
 
Sintesis informativa 30 de marzo 2017
Sintesis informativa 30 de marzo 2017Sintesis informativa 30 de marzo 2017
Sintesis informativa 30 de marzo 2017megaradioexpress
 
Pathways to smoking care for cancer patients (P-SCIP): Stage 1
Pathways to smoking care for cancer patients (P-SCIP): Stage 1Pathways to smoking care for cancer patients (P-SCIP): Stage 1
Pathways to smoking care for cancer patients (P-SCIP): Stage 1Cancer Institute NSW
 
Lawyer in Vietnam Oliver Massmann Transfer Pricing in Mergers and Acquisitio...
Lawyer in  Vietnam Oliver Massmann Transfer Pricing in Mergers and Acquisitio...Lawyer in  Vietnam Oliver Massmann Transfer Pricing in Mergers and Acquisitio...
Lawyer in Vietnam Oliver Massmann Transfer Pricing in Mergers and Acquisitio...Dr. Oliver Massmann
 
Hellink - Un jeu vidéo de sensibilisation aux Humanités Numériques
Hellink - Un jeu vidéo de sensibilisation aux Humanités NumériquesHellink - Un jeu vidéo de sensibilisation aux Humanités Numériques
Hellink - Un jeu vidéo de sensibilisation aux Humanités NumériquesMyriam Gorsse
 
Fire effects on concrete
Fire effects on concreteFire effects on concrete
Fire effects on concreteKhattar Aoun
 
برنامج Teacher kit
 برنامج Teacher kit  برنامج Teacher kit
برنامج Teacher kit Saad ALsahali
 
Análisis de los aspectos legales de OSS (version 2017)
Análisis de los aspectos legales de OSS (version 2017)Análisis de los aspectos legales de OSS (version 2017)
Análisis de los aspectos legales de OSS (version 2017)Iwan van der Kleijn
 

Viewers also liked (11)

WIPAC Monthly - February 2017
WIPAC Monthly - February 2017WIPAC Monthly - February 2017
WIPAC Monthly - February 2017
 
Principios Lean: Una perspectiva histórica desde las cadenas de producción ha...
Principios Lean: Una perspectiva histórica desde las cadenas de producción ha...Principios Lean: Una perspectiva histórica desde las cadenas de producción ha...
Principios Lean: Una perspectiva histórica desde las cadenas de producción ha...
 
IBM Presents the Notes Domino Roadmap and a Deep Dive into Feature Pack 8
IBM Presents the Notes Domino Roadmap and a Deep Dive into Feature Pack 8IBM Presents the Notes Domino Roadmap and a Deep Dive into Feature Pack 8
IBM Presents the Notes Domino Roadmap and a Deep Dive into Feature Pack 8
 
Sintesis informativa 30 de marzo 2017
Sintesis informativa 30 de marzo 2017Sintesis informativa 30 de marzo 2017
Sintesis informativa 30 de marzo 2017
 
Pathways to smoking care for cancer patients (P-SCIP): Stage 1
Pathways to smoking care for cancer patients (P-SCIP): Stage 1Pathways to smoking care for cancer patients (P-SCIP): Stage 1
Pathways to smoking care for cancer patients (P-SCIP): Stage 1
 
A woman ahead of her time
A woman ahead of her timeA woman ahead of her time
A woman ahead of her time
 
Lawyer in Vietnam Oliver Massmann Transfer Pricing in Mergers and Acquisitio...
Lawyer in  Vietnam Oliver Massmann Transfer Pricing in Mergers and Acquisitio...Lawyer in  Vietnam Oliver Massmann Transfer Pricing in Mergers and Acquisitio...
Lawyer in Vietnam Oliver Massmann Transfer Pricing in Mergers and Acquisitio...
 
Hellink - Un jeu vidéo de sensibilisation aux Humanités Numériques
Hellink - Un jeu vidéo de sensibilisation aux Humanités NumériquesHellink - Un jeu vidéo de sensibilisation aux Humanités Numériques
Hellink - Un jeu vidéo de sensibilisation aux Humanités Numériques
 
Fire effects on concrete
Fire effects on concreteFire effects on concrete
Fire effects on concrete
 
برنامج Teacher kit
 برنامج Teacher kit  برنامج Teacher kit
برنامج Teacher kit
 
Análisis de los aspectos legales de OSS (version 2017)
Análisis de los aspectos legales de OSS (version 2017)Análisis de los aspectos legales de OSS (version 2017)
Análisis de los aspectos legales de OSS (version 2017)
 

More from Water Industry Process Automation & Control

More from Water Industry Process Automation & Control (20)

WIPAC Monthly Magazine - February 2024
WIPAC Monthly Magazine  -  February 2024WIPAC Monthly Magazine  -  February 2024
WIPAC Monthly Magazine - February 2024
 
WIPAC Monthly - January 2024.pdf
WIPAC Monthly - January 2024.pdfWIPAC Monthly - January 2024.pdf
WIPAC Monthly - January 2024.pdf
 
WIPAC Monthly - November & December 2023
WIPAC Monthly - November & December  2023WIPAC Monthly - November & December  2023
WIPAC Monthly - November & December 2023
 
WIPAC Monthly - October 2023
WIPAC Monthly - October 2023WIPAC Monthly - October 2023
WIPAC Monthly - October 2023
 
WIPAC Monthly - September 2023
WIPAC Monthly - September 2023WIPAC Monthly - September 2023
WIPAC Monthly - September 2023
 
WIPAC Monthly - August 2023.pdf
WIPAC Monthly - August 2023.pdfWIPAC Monthly - August 2023.pdf
WIPAC Monthly - August 2023.pdf
 
WIPAC Monthly - July 2023.pdf
WIPAC Monthly - July 2023.pdfWIPAC Monthly - July 2023.pdf
WIPAC Monthly - July 2023.pdf
 
WIPAC Monthly - June 2023.pdf
WIPAC Monthly - June 2023.pdfWIPAC Monthly - June 2023.pdf
WIPAC Monthly - June 2023.pdf
 
WIPAC Monthly - May 2023.pdf
WIPAC Monthly - May 2023.pdfWIPAC Monthly - May 2023.pdf
WIPAC Monthly - May 2023.pdf
 
WIPAC Monthly - April 2023.pdf
WIPAC Monthly - April 2023.pdfWIPAC Monthly - April 2023.pdf
WIPAC Monthly - April 2023.pdf
 
WIPAC Monthly - March 2023.pdf
WIPAC Monthly - March 2023.pdfWIPAC Monthly - March 2023.pdf
WIPAC Monthly - March 2023.pdf
 
WIPAC Monthly - February 2023.pdf
WIPAC Monthly - February 2023.pdfWIPAC Monthly - February 2023.pdf
WIPAC Monthly - February 2023.pdf
 
WIPAC Monthly - January 2023.pdf
WIPAC Monthly - January 2023.pdfWIPAC Monthly - January 2023.pdf
WIPAC Monthly - January 2023.pdf
 
WIPAC Monthly - December 2022.pdf
WIPAC Monthly - December 2022.pdfWIPAC Monthly - December 2022.pdf
WIPAC Monthly - December 2022.pdf
 
WIPAC Monthly - October 2022.pdf
WIPAC Monthly - October 2022.pdfWIPAC Monthly - October 2022.pdf
WIPAC Monthly - October 2022.pdf
 
WIPAC Monthly - September 2022.pdf
WIPAC Monthly - September 2022.pdfWIPAC Monthly - September 2022.pdf
WIPAC Monthly - September 2022.pdf
 
WIPAC Monthly - August 2022.pdf
WIPAC Monthly - August 2022.pdfWIPAC Monthly - August 2022.pdf
WIPAC Monthly - August 2022.pdf
 
WIPAC Monthly - July 2022.pdf
WIPAC Monthly - July 2022.pdfWIPAC Monthly - July 2022.pdf
WIPAC Monthly - July 2022.pdf
 
WIPAC Monthly - June 2022.pdf
WIPAC Monthly - June 2022.pdfWIPAC Monthly - June 2022.pdf
WIPAC Monthly - June 2022.pdf
 
WIPAC Monthly - May 2022
WIPAC Monthly - May 2022WIPAC Monthly - May 2022
WIPAC Monthly - May 2022
 

Recently uploaded

Sachpazis Costas: Geotechnical Engineering: A student's Perspective Introduction
Sachpazis Costas: Geotechnical Engineering: A student's Perspective IntroductionSachpazis Costas: Geotechnical Engineering: A student's Perspective Introduction
Sachpazis Costas: Geotechnical Engineering: A student's Perspective IntroductionDr.Costas Sachpazis
 
Transport layer issues and challenges - Guide
Transport layer issues and challenges - GuideTransport layer issues and challenges - Guide
Transport layer issues and challenges - GuideGOPINATHS437943
 
Introduction-To-Agricultural-Surveillance-Rover.pptx
Introduction-To-Agricultural-Surveillance-Rover.pptxIntroduction-To-Agricultural-Surveillance-Rover.pptx
Introduction-To-Agricultural-Surveillance-Rover.pptxk795866
 
Call Girls Narol 7397865700 Independent Call Girls
Call Girls Narol 7397865700 Independent Call GirlsCall Girls Narol 7397865700 Independent Call Girls
Call Girls Narol 7397865700 Independent Call Girlsssuser7cb4ff
 
Introduction to Machine Learning Unit-3 for II MECH
Introduction to Machine Learning Unit-3 for II MECHIntroduction to Machine Learning Unit-3 for II MECH
Introduction to Machine Learning Unit-3 for II MECHC Sai Kiran
 
Instrumentation, measurement and control of bio process parameters ( Temperat...
Instrumentation, measurement and control of bio process parameters ( Temperat...Instrumentation, measurement and control of bio process parameters ( Temperat...
Instrumentation, measurement and control of bio process parameters ( Temperat...121011101441
 
computer application and construction management
computer application and construction managementcomputer application and construction management
computer application and construction managementMariconPadriquez1
 
Call Girls Delhi {Jodhpur} 9711199012 high profile service
Call Girls Delhi {Jodhpur} 9711199012 high profile serviceCall Girls Delhi {Jodhpur} 9711199012 high profile service
Call Girls Delhi {Jodhpur} 9711199012 high profile servicerehmti665
 
Software and Systems Engineering Standards: Verification and Validation of Sy...
Software and Systems Engineering Standards: Verification and Validation of Sy...Software and Systems Engineering Standards: Verification and Validation of Sy...
Software and Systems Engineering Standards: Verification and Validation of Sy...VICTOR MAESTRE RAMIREZ
 
Correctly Loading Incremental Data at Scale
Correctly Loading Incremental Data at ScaleCorrectly Loading Incremental Data at Scale
Correctly Loading Incremental Data at ScaleAlluxio, Inc.
 
Why does (not) Kafka need fsync: Eliminating tail latency spikes caused by fsync
Why does (not) Kafka need fsync: Eliminating tail latency spikes caused by fsyncWhy does (not) Kafka need fsync: Eliminating tail latency spikes caused by fsync
Why does (not) Kafka need fsync: Eliminating tail latency spikes caused by fsyncssuser2ae721
 
Indian Dairy Industry Present Status and.ppt
Indian Dairy Industry Present Status and.pptIndian Dairy Industry Present Status and.ppt
Indian Dairy Industry Present Status and.pptMadan Karki
 
Earthing details of Electrical Substation
Earthing details of Electrical SubstationEarthing details of Electrical Substation
Earthing details of Electrical Substationstephanwindworld
 
Concrete Mix Design - IS 10262-2019 - .pptx
Concrete Mix Design - IS 10262-2019 - .pptxConcrete Mix Design - IS 10262-2019 - .pptx
Concrete Mix Design - IS 10262-2019 - .pptxKartikeyaDwivedi3
 
welding defects observed during the welding
welding defects observed during the weldingwelding defects observed during the welding
welding defects observed during the weldingMuhammadUzairLiaqat
 
Work Experience-Dalton Park.pptxfvvvvvvv
Work Experience-Dalton Park.pptxfvvvvvvvWork Experience-Dalton Park.pptxfvvvvvvv
Work Experience-Dalton Park.pptxfvvvvvvvLewisJB
 
CCS355 Neural Networks & Deep Learning Unit 1 PDF notes with Question bank .pdf
CCS355 Neural Networks & Deep Learning Unit 1 PDF notes with Question bank .pdfCCS355 Neural Networks & Deep Learning Unit 1 PDF notes with Question bank .pdf
CCS355 Neural Networks & Deep Learning Unit 1 PDF notes with Question bank .pdfAsst.prof M.Gokilavani
 

Recently uploaded (20)

Sachpazis Costas: Geotechnical Engineering: A student's Perspective Introduction
Sachpazis Costas: Geotechnical Engineering: A student's Perspective IntroductionSachpazis Costas: Geotechnical Engineering: A student's Perspective Introduction
Sachpazis Costas: Geotechnical Engineering: A student's Perspective Introduction
 
Transport layer issues and challenges - Guide
Transport layer issues and challenges - GuideTransport layer issues and challenges - Guide
Transport layer issues and challenges - Guide
 
🔝9953056974🔝!!-YOUNG call girls in Rajendra Nagar Escort rvice Shot 2000 nigh...
🔝9953056974🔝!!-YOUNG call girls in Rajendra Nagar Escort rvice Shot 2000 nigh...🔝9953056974🔝!!-YOUNG call girls in Rajendra Nagar Escort rvice Shot 2000 nigh...
🔝9953056974🔝!!-YOUNG call girls in Rajendra Nagar Escort rvice Shot 2000 nigh...
 
Introduction-To-Agricultural-Surveillance-Rover.pptx
Introduction-To-Agricultural-Surveillance-Rover.pptxIntroduction-To-Agricultural-Surveillance-Rover.pptx
Introduction-To-Agricultural-Surveillance-Rover.pptx
 
Call Girls Narol 7397865700 Independent Call Girls
Call Girls Narol 7397865700 Independent Call GirlsCall Girls Narol 7397865700 Independent Call Girls
Call Girls Narol 7397865700 Independent Call Girls
 
young call girls in Rajiv Chowk🔝 9953056974 🔝 Delhi escort Service
young call girls in Rajiv Chowk🔝 9953056974 🔝 Delhi escort Serviceyoung call girls in Rajiv Chowk🔝 9953056974 🔝 Delhi escort Service
young call girls in Rajiv Chowk🔝 9953056974 🔝 Delhi escort Service
 
Introduction to Machine Learning Unit-3 for II MECH
Introduction to Machine Learning Unit-3 for II MECHIntroduction to Machine Learning Unit-3 for II MECH
Introduction to Machine Learning Unit-3 for II MECH
 
Instrumentation, measurement and control of bio process parameters ( Temperat...
Instrumentation, measurement and control of bio process parameters ( Temperat...Instrumentation, measurement and control of bio process parameters ( Temperat...
Instrumentation, measurement and control of bio process parameters ( Temperat...
 
computer application and construction management
computer application and construction managementcomputer application and construction management
computer application and construction management
 
Call Girls Delhi {Jodhpur} 9711199012 high profile service
Call Girls Delhi {Jodhpur} 9711199012 high profile serviceCall Girls Delhi {Jodhpur} 9711199012 high profile service
Call Girls Delhi {Jodhpur} 9711199012 high profile service
 
Software and Systems Engineering Standards: Verification and Validation of Sy...
Software and Systems Engineering Standards: Verification and Validation of Sy...Software and Systems Engineering Standards: Verification and Validation of Sy...
Software and Systems Engineering Standards: Verification and Validation of Sy...
 
Correctly Loading Incremental Data at Scale
Correctly Loading Incremental Data at ScaleCorrectly Loading Incremental Data at Scale
Correctly Loading Incremental Data at Scale
 
Why does (not) Kafka need fsync: Eliminating tail latency spikes caused by fsync
Why does (not) Kafka need fsync: Eliminating tail latency spikes caused by fsyncWhy does (not) Kafka need fsync: Eliminating tail latency spikes caused by fsync
Why does (not) Kafka need fsync: Eliminating tail latency spikes caused by fsync
 
Indian Dairy Industry Present Status and.ppt
Indian Dairy Industry Present Status and.pptIndian Dairy Industry Present Status and.ppt
Indian Dairy Industry Present Status and.ppt
 
Earthing details of Electrical Substation
Earthing details of Electrical SubstationEarthing details of Electrical Substation
Earthing details of Electrical Substation
 
Concrete Mix Design - IS 10262-2019 - .pptx
Concrete Mix Design - IS 10262-2019 - .pptxConcrete Mix Design - IS 10262-2019 - .pptx
Concrete Mix Design - IS 10262-2019 - .pptx
 
welding defects observed during the welding
welding defects observed during the weldingwelding defects observed during the welding
welding defects observed during the welding
 
Exploring_Network_Security_with_JA3_by_Rakesh Seal.pptx
Exploring_Network_Security_with_JA3_by_Rakesh Seal.pptxExploring_Network_Security_with_JA3_by_Rakesh Seal.pptx
Exploring_Network_Security_with_JA3_by_Rakesh Seal.pptx
 
Work Experience-Dalton Park.pptxfvvvvvvv
Work Experience-Dalton Park.pptxfvvvvvvvWork Experience-Dalton Park.pptxfvvvvvvv
Work Experience-Dalton Park.pptxfvvvvvvv
 
CCS355 Neural Networks & Deep Learning Unit 1 PDF notes with Question bank .pdf
CCS355 Neural Networks & Deep Learning Unit 1 PDF notes with Question bank .pdfCCS355 Neural Networks & Deep Learning Unit 1 PDF notes with Question bank .pdf
CCS355 Neural Networks & Deep Learning Unit 1 PDF notes with Question bank .pdf
 

WIPAC Monthly - March 2017

  • 1. Page 1 WIPAC MONTHLYThe Monthly Update from Water Industry Process Automation & Control www.wipac.org.uk Issue 3/2017 - March 2017
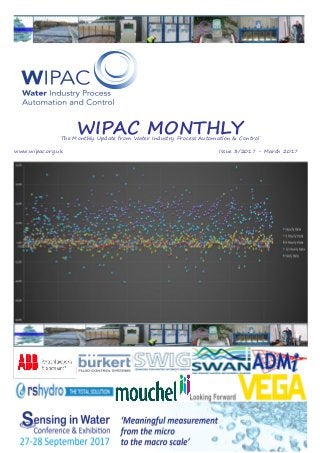
  • 2. Page 2 In this Issue From the Editor.................................................................................................................... 3 Industry News..................................................................................................................... 4 - 9 Highlights of the news of the month from the global water industry centred around the successes of a few of the companies in the global market. Is it possible to use flow data to predict flow data........................................................ 10-14 In this month’s feature article, group manager - Oliver Grievson, has had a play with an extensive base of flow data and looked to do what has been promised in the past - quite literally smooth data, in this case flow data. Some interesting results came out of it How the Water Industry learned to embrace data.......................................................... 15 In this article written by Amir Peleg of Takadu and Frank Cespedes of Harvard the discussion of the importance of data is discussed looking at how data has been used to improve leakage but how not only technology but the people and processes are essential parts of the journey Smart Wastewater Networks from Micro to Macro........................................................ 16-18 March has been the month where Smart Wastewater Networks have been heavily discussed showing what is new in the world of Smart Wastewater Networks. Bringing the key learning points from this month’s workshops and conferences, Oliver Grievson also discusses the future of collection networks in the wastewater industry. Developing an alternative to Coriolis Flow Measurement .................................................. 19-20 Coriolis Flow Measurement is something that the Water Industry hasn’t fully utilised, perhaps because of its cost or the complexity involved. In this article from Flow Measurement Specialists Burkert an alternative to Coriolis in the form of their Surface Acoustic Wave (SAW) technology is discussed. A digital future for Severn Trent......................................................................................... 20-21 In this extended news article the developments of the digital innovations that have been taken on and utilised with the UK Water Company - Severn Trent are discussed showing the forward looking approach to exploiting the digital approach to the Water Industry Workshops, Conferences & Seminars................................................................................... 22-23 The highlights of the conferences and workshops in the coming months The picture on the front cover of this issue is the key graph from the predicting flow data article in this month’s issue. It questions that, at least for total daily volume calculations, whether we need to record data every 16 minutes WIPAC Monthly is a publication of the Water Industry Process Automation & Control Group. It is produced by the group manager and WIPAC Monthly Editor, Oliver Grievson. This is a free publication for the benefit of the Water Industry and please feel free to distribute to any who you may feel benefit. All enquires about WIPAC Monthly, including those who want to publish news or articles within these pages, should be directed to the publications editor, Oliver Grievson at olivergrievson@hotmail.com
  • 3. Page 3 From the Editor Has the time of the Smart Wastewater Network finally happened? If you are to believe the workshop and conference that has taken place this month I think it is safe to finally say that the industry has at least made some in-roads into the thoughts around putting intelligence into the network. A few years ago now I stood at the front of a relatively large conference and was asked by an eminent Professor from one of the leading Universities in the UK “We’ve been talking about the concept of the Smart Wastewater Network for years and we are still not any further forward. What has changed now?” At the time I said it was the drivers in the industry and that it would happen, of course in the UK it has. We have (or will have) Event Duration Monitoring on the majority (if not all) of our combined storm outfalls and I am aware of at least two of the Water & Sewerage Companies that are installing sensors in their thousands. On top of this more and more we are hearing about sewer level monitoring, flow monitoring at pumping stations, current monitoring for asset monitoring, automatic re-setting of pumps on top of pump reversal technology as well. All of these aspects are what I am terming the micro changes that we are making to our wastewater network on top of this there are the more macro changes including the use of rainfall data to predict the future state of the network in response to events. More is covered in the article, that I have written off the back of these events, later on in this issue. Of course the most welcome news is the work that one of the UK Water & Sewerage Companies has taken when they released the news of what is presumable their digital (Smart) strategy moving forward. Sitting at a conference earlier this month listening to Martin Kane of Severn Trent I heard what they have done at their treatment works at Spernal in using the factory approach and using instrumentation to gather the data and turn it into information. Now the works at Spernal isn’t huge, with a EU registered population of 85,004 (click here for details) but with a relatively small investment they have taken the works to a point where they use the data to know what is going on. The result an engaged staff who have the information on hand to make an informed decision on how to operate the works. The challenge has always been for the “Smart” Water Industry has been to justify the benefits of the approach. How much will it cost is the cry and what are the benefits? The reply has been very much - “Well, we think its going to be this but we are sure we will get more benefits that we think which may well mean that we can reduce the ROI but we’ve not 100% sure,” The answer in an industry which always seems to have to operate with the prospects of lower bills and tougher challenges means that margins matter and so the inevitable result is a degree of conservatism. This “conservatism” was challenged in another event that I went to this month at the Worshipful Company of Water Conservators, the atmosphere was wonderfully masonic with it being hosted at the Guildhall in London, the event was a debate on the death of the Water Companies if radical change was not forthcoming in the next decade or so. For those of you who have any doubt on the result the alarmist prospect was defeated with the main argument being that the digital era in the Water & Wastewater Industry will result in radical change of the way that we work which will change the very foundation of what the industry is. Of course this is partly true however the core is the assets that we work at day after day with the process units built in concrete hardy likely to change in the short term but through better information and better ways of operating their is a good chance that the way we interact with these assets will change the way we do things. The fatal error in the argument was that the digital or smart water industry is not meant as a replacement for anything, it is there as another tool to inform those who know what they are doing to have all the information to hand to make the right decision. The Smart Water industry is something that is starting and gathering pace, people within the industry are trying the small things and the opportunities are there for the good solutions. Alongside these little solutions are the great big hairy solutions that naturally alot slower for adoption but with case studies like Severn Trent have at Spernal coming to the forefront are likely to become more and more popular as the benefits are seen. It is through work like that being done at Severn Trent that the industry will be led into a “Smart Future.” Have a good month Oliver
  • 4. Defra sets out cyber security strategy for water sector DC Water And Xylem Celebrate The First Intelligent Wastewater Pumping System In North America The UK Government has published a cyber security strategy for the water sector, summarising what water and sewerage companies need to do to reduce the risks of cyber attacks. Published by the Department for Environment, Food and Rural Affairs, the strategy, which focuses on attacks based around computers, computerised systems or networks, is mainly aimed at water and sewerage companies in England. It says there are “credible cyber threats to UK Critical National Infrastructure, including the water sector,” and that these could lead to “serious consequences, particularly as increased automation and connectivity reduces the scope for standalone or manual operation of the water supply system.” Recent reviews by government cyber experts have identified significant opportunities for the water sector to operate at a higher level of cyber security maturity. The water-specific strategy is part of a government-wide response to the cyber threat, which complements the National Cyber Security Strategy (2016). The strategic vision and objectives have incorporated significant contributions from the sector and aim to guide activities across the sector, including water companies and government. It aims to achieve a vision by 2021 of a “secure, effective, and confident water sector, resilient to an ever-evolving cyber threat.” Key objectives within the strategy include understanding the threats; managing the risk from these threats; managing any incidents that arise in the best way possible; and developing capabilities to increase future resistance and build cyber skills. The cyber risk reviews identified a number of key areas in which the sector should focus its cyber security activities. One of these is the architectural design/separation of Information Technology (IT) and Operational Technology (OT). The paper says that ideally IT and OT systems or networks should be completely separated to prevent infections in IT systems spreading and impacting processes that could cause physical damage. It also flags up the cyber risk from third parties, with company networks increasingly accessed by third parties such as equipment suppliers, software suppliers and contractors who require the ability to upload software onto systems, make alterations and plug their equipment into the host network. The paper says policies need to be in place to manage this risk, for instance by restricting the number of people with external accesses to a network and ensuring that devices plugged in to the host network are not carrying malware. The full strategy is available to download here Xylem have presented to DC Water, this month the first installation in North America of Flygt Concertor, the world’s first wastewater pumping system with integrated intelligence. DC Water, one of the nation’s leading water and wastewater innovators, has a well-established track record of piloting and adopting leading-edge technologies to evolve its operations into smarter water infrastructure for the benefit of its customers and the community. In the wake of a renewed interest in federal investments in infrastructure, DC Water and Xylem are coming together to highlight the urgent need for investing in smart water infrastructure to maximize operational productivity and benefit customers. In a report released earlier this month, the American Society of Civil Engineers estimated that the U.S. needs to invest a minimum of $123 billion per year in water infrastructure over the next 10 years to achieve a good state of repair. In order to advance research and development in the area of smart water infrastructure and advanced data analytics in the sector, Xylem and DC Water today signed a Memorandum of Understanding to collaborate on future innovation initiatives. The two organizations expressed a commitment to accelerating innovation through field-driven pilots that focus on increasing the productivity of managing water and wastewater and improve the resilience and sustainability of those operations. “In the U.S., our water and wastewater infrastructure faces a daunting investment gap that places these critical systems at risk and leaves our communities vulnerable to the consequences of system failures,” said Patrick Decker, President and CEO of Xylem. “We are so pleased to be able to partner with DC Water – a true industry leader – to address these challenges, leveraging technology to develop new, more sustainable solutions. Our Flygt Concertor is a great example of the type of break-through technology that we believe will fundamentally alter the way water and wastewater is managed. Working together, we will be able to bring those solutions to fruition even faster.” George Hawkins, CEO and General Manager of DC Water, said, “At DC Water, we’re always looking down the road for the next innovation that will help us do our job better, at less cost. This new technology accomplishes that and I’m excited about the implications not just for us, but for the industry as a whole. It’s also an important demonstration of partnerships between the best elements of private sector innovation and public sector operational know-how, and I’m proud to be on the forefront of this effort.” Mr. Hawkins welcomed Xylem and guests to its Blue Plains Advanced Wastewater Treatment Plant today for a demonstration of the Flygt Concertor wastewater technology, which was developed by Xylem in close collaboration with customers. This intelligent, connected solution significantly advances the sustainability of the wastewater sector by consuming considerably less energy, reducing inventory needs, ensuring reliable, clog-free wastewater pumping while also reducing the overall cost of ownership. “DC Water is working on many innovations focused on leveraging digital technologies to maximize operation and maintenance efficiencies,” commented Biju George, Chief Operating Officer of DC Water. “The Concertor pump will enable us to achieve this not only through the new capabilities of the pump itself but also with the embedded data for efficient asset management.” Page 4 Industry News
  • 5. Big Data, IoT Poised To Address Water Infrastructure Gap Cutting-edge, smart water solutions are gaining traction with municipal water utilities, which see data and analytics as critical tools for overcoming the age- old issue of crumbling water infrastructure. Over $20B is slated for metering, data management, and analytics from 2016 to 2025, globally, according to Bluefield Research. At the root of this change is the mounting financial pressure that is forcing water utilities and municipalities to do more with less. This has sparked an uptick in demand for innovative solutions to more cost-effectively manage billing and customer management, leakage rates, and energy consumption. “By zeroing-in on key drivers of operating costs, water utilities are optimizing their operations with smart technologies,” according to Keith Hays, Vice President of Bluefield Research. “The solutions are not new, as they draw from existing equipment, software, and analytics tools,” says Hays, “but a significant hurdle will be integrating legacy systems with new software platforms.” In some cases, the results have been significant: halving non-revenue water- leaks and billing errors- and reducing energy consumption from 20% to 40%. As much as 30% of water utility operating expenditures can be improved almost immediately through more dynamic and real-time system monitoring, according to Bluefield. The smart water sector is expected to scale to $12B in the US and $11B in Europe by 2025. Other hotspots for smart water activity include Australia, Singapore and Israel, where water stress and established utility network operators are more receptive to advanced technology adoption. European utilities are at the forefront of smart water in terms of operational solutions, while the US leads in terms of metering. Exhibit: Global Smart Water Projects (2nd Half 2016) Bluefield has seen an uptick of M&A with larger, more diversified players like Honeywell, Trimble, and Xylem moving deeper into the sector. “Smart water is bringing a wide range of new companies into the water industry, from multiple sectors and value chain positions, which is fitting for an industry opening itself up to the massive potential,” according to Hays. “We expect to see more industry consolidation over the next 3-5 years, as technology firms build utility track records and larger industrial players find synergies within their larger product portfolios,” says Hays. Page 5
  • 6. Latest Copernicus launch will improve services for users of land and sea maps The latest addition to the Copernicus satellite Earth observation family will halve the time needed to provide precision land-use data to benefit farmers, builders, fishermen and anyone who needs rapid access to up-to-the-minute data on conditions on the ground. Copernicus – Europe’s Earth observation programme – can now build up an image covering the entire planet in just 5 days, cutting the time needed to image the globe by half. The latest Copernicus satellite (Sentinel-2B) was successfully launched on 7 March from Europe’s Spaceport in French Guiana. It joins Sentinel-2A, which has been in orbit since 23 June 2015. The Copernicus Sentinel 2 mission is now complete. Together, the two Sentinels produce high resolution data that is already being used to create satellite-enabled products and services. The European Union has provided free, full and open access to the data. The European Commission said that faster and more precise provision of data will bring concrete benefits to citizens worldwide. These include reduced costs of precision farming services, increased productivity of fish farmers thanks to the monitoring of toxic algal blooms and savings for construction companies via a work progress monitoring application. In line with its Space Strategy for Europe, the Commission will continue to work on making access to space data easier, with the development of new industry-led platforms. It is also planning to develop an ambitious awareness campaign about Copernicus and foster the uptake of space data, notably by helping start-ups and supporting the emergence of European industrial space hubs and clusters in European regions. Copernicus, a leading provider of Earth observation data across the globe, is already being used to help save lives at sea, improve response to natural disasters such as earthquakes, forest fires or floods, and allows farmers to better manage their crops. The system collects data from earth observation satellites and ground stations, airborne and sea-borne sensors. For example, the European Commission’s Emergency Response Coordination Centre activated the EU Copernicus Emergency mapping service for damage assessment grading maps for the most affected areas by the multiple earthquakes in central Italy since August 2016. Copernicus processes data and provides users with reliable and up-to-date information through a set of services in six thematic areas: • land monitoring • marine monitoring • atmosphere monitoring • climate change • emergency management response • security Most of these services are already operational and have been enabled by the earth observation data from the first Copernicus Sentinel satellites, as well as a number of contribution missions from other operators. With this latest launch, five Copernicus satellites are now in orbit (Sentinel 1A, 1B, 2A, 2B and 3A). EU Vice-President Maroš Šefčovič described the launch as a ‘giant leap’ for Copernicus and good news for agriculture, climate and environment, the detection of water pollution and the ability to cope with disasters. Elżbieta Bieńkowska, Commissioner for Internal market, Industry, Entrepreneurship and SMEs said: “Today’s successful launch of a new Copernicus satellite is another sign of the excellence of Europe in space. Copernicus is the most advanced Earth observation system in the world. With this launch more data will become available to develop new and innovative services and applications.” Sensus Smart Water System Improves Water Utilization For Utilities And Customers As utilities around the world seek to improve water utilization and help their customers become smarter about water usage, Sensus recognizes World Water Day as an essential opportunity to deliver on these goals. A global provider of smart water systems—comprised of advanced metering technology, software and the FlexNet® communication network—Sensus works with customers to enhance their water management efforts. Improved leak detection and pressure management systems are proven ways for utilities to conserve water resources, reducing leaks by five percent and pipe bursts by 10 percent, according to a Sensus research study titled “Water 20/20: Bringing Smart Water Networks Into Focus.” Utilities leveraging Sensus smart water technologies go from reactive to proactive, identifying leaks and mitigating pressure issues before they lead to significant water loss. Sensus solutions also help utilities improve service by enabling customers to adjust and eliminate unwanted behaviours while lowering their costs. In recent examples of the use of Smart Water Metering customers & authorities have been alerted about leaks and unusual water leaks resulting in savings of 20% in Fontain City in Californina to “swimming pool” size leaks inYoungstown, Ohio. The main benefits though have been increased awareness of consumers allowing the conversation about water conservation with the customer enabling not just reduced consumption but reduced leakage too. Page 6
  • 7. Endress+Hauser Acquires SensAction Endress+Hauser has acquired SensAction AG, a manufacturer of innovative systems for measuring the concentration of liquids. With this move, the Switzerland-based Group intends to strengthen its quality measurement portfolio. SensAction will remain headquartered in Coburg, Germany and keep the current staff of 13 employees. SensAction will operate as a division of the Endress+Hauser centre of competence for flow measurement technology headquartered in Reinach, Switzerland. “This innovative technology is an excellent fit with our modern flow measurement portfolio,”says Dr Bernd-Josef Schäfer, Managing Director of Endress+ Hauser Flowtec AG. “It allows us to further expand our range of products for measuring quality parameters.” Already, Coriolis flow measurement devices from Endress+Hauser can determine not only mass flow, but density as well. Electromagnetic instruments are capable of measuring conductivity parallel to the volume flow. “These physical analysis parameters create direct value-add for the customer,” emphasizes Bernd-Josef Schäfer. Endress+Hauser plans to integrate the SensAction instruments into its own program and open up new markets via the Group’s international sales structures. In addition, plans are in place to eventually combine the technology direct with Endress+Hauser flow instruments. Innovative technology The systems from SensAction measure the concentration of liquids with the help of surface acoustic waves, which are high frequency sound waves whose behaviour can be compared to seismic waves created by earthquakes. By analysing the transmission time and amplitude, the acoustic parameters of the liquid, such as sound wave velocity, impedance and density, can be measured in order to quickly and precisely determine the concentration. Because they contain no moving parts, the systems are maintenance-free and do not suffer from wear-and-tear. Apart from developing and manufacturing concentration measurement systems, SensAction also offers supplementary services, such as software products that rely on a laboratory measurement to provide a high degree of accuracy and user-friendliness for the customers’ applications. The key fields of application for the SensAction instruments include concentration measurements for liquid process media. The acquisition of SensAction will be effective retroactively from 1 January 2017. Both parties have agreed to not disclose the details of the transaction. Stefan Rothballer and Michael Münch, two of SensAction’s founders, will continue to manage the innovative company’s business. Sigfox And OleumTech Team Up To Streamline Asset Monitoring Through Wireless Internet Of Things (IoT) Connectivity Page 7 Sigfox, the world’s leading provider of connectivity for the Internet of Things (IoT), recently announced a partnership with OleumTech Corporation, a leading provider of M2M communications and industrial automation solutions. As one of the largest Original Equipment Manufacturer (OEM) partnerships for Sigfox to-date, global customers will soon benefit from out-of-the-box Low Power Wide Area (LPWA) wireless connectivity leveraging OleumTech’s patented self- contained, battery-powered wireless transmitter technology. OleumTech manufactures and distributes industrial wireless automation systems across sectors including Water and Energy. Their products have radically transformed how companies gather data in the field, providing visibility to disparate assets, especially in remote, hazardous locations, enabling real-time optimized decisions regarding resource deployment and regulatory compliance. With a global installed base of over 350,000 devices, OleumTech’s products provide critical data for measurement variables such as pressure, flow, temperature, level, moisture, etc. With the majority of industrial and utility assets isolated or too expensive to connect through tradition means, Sigfox’s LPWAN network provides a low cost connectivity solution for the industry as a whole, enabling low device battery consumption and scalability on a global level. Through this partnership, cus- tomers will benefit from the Sigfox managed connectivity layer so that asset monitoring is streamlined and the essential data is delivered in nearly real-time. “We are proud to partner with a recognized leader in M2M communications and industrial automation solutions,” said Michael Orr, VP Sales and Partnerships at Sigfox. IoT is well-positioned to transform the industry, optimizing everything from predictive maintenance to streamlining operations. As the IoT connectivity layer, Sigfox offers innovative, scalable solutions to expedite data collection and improve operational efficiencies; enabling industry business leaders like OleumTech to make better-informed decisions.” “The partnership with Sigfox comes at an exciting time. We are rapidly growing our IoT portfolio and deploying new platforms to help our industrial customers capitalize on the connected landscape and drive results for their business,” said Brent McAdams, Vice President, Strategic Initiatives at OleumTech. “Sigfox is an ideal partner. Their rapidly expanding global footprint and cost-effective architecture is setting the standard for low power connectivity making it an ideal platform for our self-contained battery powered technology, enabling all the benefits of IoT.” The General Purpose line of OleumTech wireless instruments with embedded Sigfox connectivity will be available by the end of Q2 2017.
  • 8. ABB and Sulzer in equipment servicing deal ABB has agreed a deal with Sulzer Electro Mechanical Services UK (Ltd) which will see the latter providing workshop repair and maintenance services for its large motors and generators. Sulzer has been named a ‘loyalty partner’ of ABB, meaning that users of ABB’s 6.6 kV and above medium and high voltage motors and generators will be able to benefit from the skills and facilities of Sulzer’s workshops in Birmingham and Falkirk. Sulzer offers inspection, remedial work, modification, repair and rewind of ABB large machines, together with some field services. Sulzer’s abilities include rebalancing of machines, motor rewinds, rotor repairs and manufacture of high voltage coils. Bringing these skills closer to ABB’s UK customers will cut lead times for repairs and reduce costs. The Loyalty Partner programme creates a network of local service partnerships to complement ABB’s own field services and regional service centres. Peter Wright, field service product manager for ABB motors and generators, comments: “The aim is to create a complete value chain for ABB clients. This will strengthen our joint position as collaboration through the Loyalty Partnership brings faster response and advanced service solutions closer to our local markets.” Sulzer was appointed following its successful completion of an appraisal procedure that all prospective ABB partners must pass. This assessed competence, quality and the company’s ability to comply with ABB’s exacting standards. “Although we considered several high quality candidates for this partnering role, our global alliance with Sulzer and its strong local relationship with the pump business made it an obvious choice,” says Wright. “The agreement with Sulzer means our customers get more service options in collaboration with ABB without compromising on quality.” Among the field services that could be offered through Sulzer are ABB’s Life Expectancy Analysis Program (LEAP) and MACHsense. LEAP offers a range of inspection services that optimise maintenance planning for electrical machines and predicts the remaining lifetime of the stator Insulation system. It helps extend machine lifetime and minimizes downtime. MACHsense is a condition monitoring service for electric motors that provides a warning of impending defects. As an early warning system, it provides time to plan maintenance and reduces unplanned shutdowns. UK sewer sensor research wins Australian prize Researchers from two UK universities have won a major Australian innovation prize for their work on a new type of sensor which has been used in Sydney’s sewers. The team from City, University of London and Edinburgh Napier University won the 2017 Australian Water Association’s NSW Water Award for Research Innovation. Their collaborative research project focussed on the development of a new class of photonics-based humidity sensors for Sydney Water’s use in the management and rehabilitation of deteriorated concrete gravity sewers and corrosion at treatment facilities. The two UK universities produced sensors with specialized, tailored coatings designed specifically to operate under the highly biofouling and corrosive conditions in Sydney’s sewers. As a result of this successful research Sydney Water will implement these sensors in a number of selected sewer locations and the findings will contribute to the future design of sewers. Professor Tong Sun, Professor of Sensor Engineering and Director of City’s Research Centre for Photonics & Instrumentation, said: “We are delighted that our work with Sydney Water has been recognized with this Research Innovation Award at the recent Australian Water Association Awards Ceremony in New South Wales. Our innovative fibre optic sensor technology, designed for and deployed in the city of Sydney, has enabled Sydney Water to undertake long term monitoring in the harsh corrosive and biofouling conditions of the city’s sewers, offering major savings in terms of management and maintenance of this critical asset. “Through its international strategy, City, University of London, is committed to be the best at problem-solving in situations like this, operating wherever the issues arise. We are pleased to be continuing our work with Sydney Water on a range of challenges to support the optimum management of their critical infrastructure.” The Australian Water Association is the national peak water organisation, delivering information, expertise and collaboration for sustainable water management. Its membership includes professionals and practitioners working in utilities, science and research, energy and resources, manufacturing and agriculture. It has an active branch network across all Australian States and Territories and maintain extensive international links, including with the International Water Association. Page 8
  • 9. OTT Launches Feature-Packed ‘Hydromet Cloud’ The OTT Hydromet Group has launched a new web-based data management service for remote monitoring stations. “Hydromet Cloud represents a step-change in data management,” comments UK Managing Director Nigel Grimsley. “Subscribers to this new service are provided with fast, simple access to both live and historical data, which opens new opportunities for exploiting the value of ‘Big Data’.” Packed with new features and highly cost-effective, Hydromet Cloud provides users with easy access to secure data from field monitoring sites at any time and from almost anywhere via hydrometcloud.eu or the Hydromet Cloud mobile App.Typical applications include hydrology, meteorology and water quality. Data are transmitted from field stations through a variety of methods including satellite, cellular (GPRS/3G/4G) or wired internet connection, and stored/backed-up in the cloud. Designed for flexibility, users are able to create their own dashboard to quickly collate frequently viewed data, which can be displayed as plots, tables or values, and exported in a variety of formats, which enables easy analysis of trends. This facility to create a bespoke display is enhanced by a map view with colour-coded map pins (for alarm status), current data values and colour-coded parameter values highlighting alarm status. Alarms are user-defined for values, rate of change etc. and alarm messages are issued automatically by email, text or push notification on a mobile phone. Separate limits can be set for both warning and critical levels, and users can also create alarm distribution groups for notifications. The Hydromet Cloud mobile App provides a quick and easy opportunity to view the status of an entire network or an individual monitoring station, with options to send/share data directly from a smartphone or tablet (iOS or Android).It is also possible to create and save ‘My Plots’ to quickly recall common plots of one or more parameters graphically illustrating recent data. Hydromet Cloud provides secure infrastructure to receive, decode, process, display, and store measurement data from nearly any remote monitoring station via a cloud-based data hosting platform. Alternatively, for those wishing to conduct their own data processing, Hydromet Cloud delivers raw data (as it is transmitted by the station) using a dedicated download page, which is updated as soon as the data arrives. The system is fully compatible with the latest OTT and Sutron data logger/communication devices, in addition to a wide variety of OTT, Sutron, and Hydrolab sensors for water quantity and quality measurements, as well as Lufft meteorological sensors, third-party sensors and IP cameras. Summarising, Nigel says: “We are very excited about the opportunities that Hydromet Cloud will create for our customers. This is the first major new product development since the acquisition of Sutron Corporation and is a great example of the synergy that has been created by merging the companies’ development teams. “Our customers know that data serves two purposes: one, to enable the analysis of background trends, and two to quickly and easily facilitate management by exception when alarm conditions arise. Hydromet Cloud achieves both.” The OTT Hydromet Group manufactures products that enable water professionals to monitor the planet’s most precious resource. Through the delivery of accurate reliable data, OTT’s instruments and services provide essential tools to help protect the environment. From precipitation through surface and ground water to marine monitoring applications, OTT’s measurement and communication technologies provide a complete picture of the water cycle. Adcon Telemetry was acquired in 2011, and Sutron and Lufft joined the OTT Hydromet Group in 2015, which means that the company is able to offer the best sensors and data handling technology for every application. Completely focused on hydro-meteorology and water quality, OTT products have been market leaders for over 140 years and coupled with modern communications technology provide remote access to continuous monitoring data. Fieldbus International (Fint) Joins The ISA100 Wireless Compliance Institute The ISA100 Wireless Compliance Institute announced today that Fieldbus International (Fint), a global provider of fieldbus connectivity solutions, has joined the ISA100 Wireless Compliance Institute. Fint provides fieldbus network products and services to vendors and users in the process control and offshore industry. Fint specializes in products based on the Foundation Fieldbus, Profibus, HART, WirelessHART and now ISA100 Wireless technology. “We are pleased that Fint has joined the ISA100 Wireless ecosystem,” remarked Andre Ristaino, ISA100 WCI Managing Director. “Fint is well known for their expertise in supporting industrial protocols and their engineering services for integrating technology, such as ISA100 Wireless into field devices and systems.” “It is our ambition to advance this powerful technology by offering our products and services to manufacturers,” said Halvor Landet, Founder and CEO of Fint. “Our products and services will enable manufacturers to operate on an ISA100 network in a straightforward way and with a bare minimum of investment.” Page 9
  • 10. Feature Article: Is it possible to use flow data to predict flow data? Introduction When you talk about the Smart Water industry there is a mantra – “data quality is king,” the sure-fire way to ruin any Smart Water project is to have data that isn’t fit for purpose and is basically just bad quality. I have spent many a presentation up in front of an audience saying precisely this thing. Showing pictures of poor quality installations, level based flow meters that have an interesting “tilt” to them or flumes that are peeling away from their concrete. Of course this is true and you can’t make good quality come from nothing. However, I have frequently had people come up to me and disagree with me, the phrase that comes to mind is if you have at least some good quality data the rest can be smoothed out. There is a person and a company within the industry who does a huge amount with fuzzy logic and fuzzy sensing, this I understand as the “sensor” is created from multiple inputs and basically is created in a “Frankenstein” sort of way patched from valve positions and other sensors that have an influence on the sensor that has broken down. What I don’t understand is taking data that isn’t necessarily fantastic in the first place and using it to predict profiles of the way things are operating. Surely this can’t be the case? So, what I decided to do is look at a large tract of good quality flow data and see if I could use that data, and that data alone, to see if I could fit it into the following years data. The rest of this paper relates to the “musings that” I had with the flow data The context For this particular attempt to “play” with flow data I took ten years-worth of flow data from a large wastewater treatment works which has a dry weather flow 83,000m3/day (approx. 22 million US gal/day). The data came from a single ultrasonic flow meter over a large flume, the data quality over the ten years of data was excellent with a data reliability of 99.92% over the ten-year period. The data itself covered the period from 2005 – 15 and what I hoped to achieve from manipulating this data was being able to use the data set using simple statistical function to see if it could be fitted to match the data that was produced in 2016. Now I am not a mathematician and so the statistics that were used were basic. Starting at a simple beginning I thought I would average the entire ten year data set removing the 29th February from the data set so as to remove this temporal oddity and see what result I would get. The result can be seen graphically in figure 1 below: Figure 1: Actual Flow (Blue) versus Simple Average Flows (Orange) What can be seen from figure 1 is that simple average is a bit basic a statistical function to use to predict the flows with potentially the root cause of this being the fact that ten years of average data does not represent a true situation. The major factor is of course weather which is not “typical”. It can be seen that “average” data does not adequately predict wet weather or even dry data with storms in the January to March period being missed and the dry period between the beginning of July and the end of October being missed. So, building on this I looked at the ten year’s worth of data averaged it across the year and averaged the ten years-worth of data and took all of the years which were “drier” than the average. For this particular data set this equated to five years of data. I then averaged the flow data across these five years and got the results as shown in figure 2: Page 10
  • 11. Figure 2 Actual Flow versus Dry Year Flows Figure 2 shows a closer match than by using a simple average with periods of the year closely matching flows for periods of the year. Although storms are obviously not picked up the fit is improved but is certainly not representing the true situation. The next thought was whether there is a better a fit in data with the wet weather years which in the context of this study was years where the average flow data was greater than the ten-year average, which also equated to using five years work of data. The results of the “wet year comparison is shown in figure 3. Figure 3: Average versus Wet Year Flows In figure 3 it can be seen that the flows have a satisfactory match up until about May - June 2016 and then they diverge by a significant amount by greater than the divergence in the dry year averages. The next question is whether the flow data is in fact somewhere in between. Would the average data within the ten-year period provide a closer match? Taking the five years closest to the average of the ten-year data produced results which are shown in figure 4: Figure 4 Average Flows versus a 5 -year average Page 11
  • 12. Using a five-year average manages a closer match in the flow data until the end of June where like the wet year data there is a divergence from the actual flow data. At this point it became obvious that using total daily volume data and using simple statistics was not going to fully work and it was probably related to the periodicity of the data that was being used. From this the divergences from the actual data needed to be accounted for in the flow data otherwise wet and dry periods would not be picked up and divergences from the actual figure would continue to create errors within the data. By comparing the average across the ten years of data in weekly periods and comparing this to the same week in 2016 would produce a factor for each week. This factor was then applied to each individual days-worth of data with its week within the year. Figure 5 shows the results Figure 5 Actual Flow Data versus average factorised data Figure 5 of course shows a much better fit in data as it is actually using the 2016 data and applying a correction factor. In terms of the work that has been done so far it could be said to be “cheating” however the use of the technique is actually quite useful as it could be used on a week by week basis to fill in the gaps of the “odd” day. It is a case where basic statistics can be used to “smooth” flow data. Looking at all of the graphs it is difficult to show how successful the techniques have been in predicting the flow data? In the UK, we of course have the Monitoring Certification Scheme or MCERTS, under this scheme the uncertainty of flow data is allowed to be plus or minus 8%. Although this isn’t a good comparison it is the best quality standard that could perhaps be applied. Table 1 below shows the number of days in the year that were predicted within the plus or minus 8% criteria. Table 1: Success of the different techniques Statistical Technique No of days within 8% % of the year within 8% Simple Average 91 24.9% Dry Year 106 29.0% Wet Year 66 18.1% 5 Year Average 86 23.6% Weekly Average Factor 223 61.1% Going a step further All of the data and the work that has been used so far has been based upon the total daily volumes but of course to really be able to predict the data it is necessary to get a much better resolution of flow data – i.e. the 15 minute data that is typically used in the UK (and around the world). The nest question to ask is to whether by going into a lot more detailed data would provide a much better quality of prediction? For this part of the study individual days were examined and the cause of deviation was examined in the 15 minute data to see if there were any periods of the day that were causing a particular problem. Figures 6,7,8, 9 below show the results of a bad day where nothing but the weekly factor average worked, a good day where all techniques were within 8 % and days were the dry day statistic work and a day where the wet day statistic worked. Page 12
  • 13. Figure 6 Day which shows poor agreement Figure 7 Day which shows good agreement across the statistical techniques Figure 8 Day which shows good agreement with the dry year statistical technique Technique Agreement Simple Average -17.2% Wet Year -18.1% Dry Year 16.4% 5 Year Average 23.0% Weekly Average Factor 5.0% Technique Agreement Simple Average -5.6% Wet Year -6.2% Dry Year 5.1% 5 Year Average 3.6% Weekly Average Factor -5.4% Technique Agreement Simple Average -5.3% Wet Year -12.6% Dry Year -0.8% 5 Year Average -.3.3% Weekly Average Factor -9.6% Page 13
  • 14. Figure 9 Day which shows good agreement with a wet year statistic The last technique that is going to be used in this paper is to use data at different periodicity during the day and seeing how much of a fit can be applied. Taking data from 1,3,6,12 & 24 hours and applying this to calculate a total daily volume produced the data as shown in figure 10. Figure 10: Scatter-graph of accuracy for hourly, 3 hourly, 6 hourly, 12 hourly and daily flow figures used to calculate the total daily flow volume From this data it can see that by using hourly data the quality of the total daily volume Is highly accurate with every single piece of data falling between -3.3 -4.5% uncertainty. This would be classed as acceptable data for the whole years-worth of data. If 3hourly data is used only 2 days of data would fall outside the acceptable uncertainty for use rising to 17 days using 6 hourly data. Discussion Using good quality data on a relatively easy site it was possible to predict total daily volumes using the data that was available. The most successful technique that was used was to use within day data. It was very interesting that hourly data near perfectly matched 15 minute data which challenges the fact as to why we, as an industry, need to use 15 minute data. Why can’t we use hourly data? Of course the answer is that it depends upon what the data is used for but as can be seen in this case for total daily volume there is no reason why not. The most successful technique when the temporal resolution used daily data was to apply a weekly factor but of course this paper is missing crucial elements in this technique that could make the quality of the predictions much more accurate and that is of course rainfall data. Without the rainfall data a total of 223 days fell within the 8% uncertainty if other factors were taken into account this could potentially could be much more accurate. This paper at the end of it used simple statistical techniques to see if there is a potential of using data to smooth data, to predict what the data should be should physical methods of flow measurement should fail. The answer at least in this simplistic format is that it can be to a certain extent. However, in this case the quality of the data to start off with was very good. The next challenge is to stretch the hypothesis and see if it breaks or not. Technique Agreement Simple Average 6.6% Wet Year 0.7% Dry Year -11.5% 5 Year Average -7.0% Weekly Average Factor -9.9% Page 14
  • 15. The water industry is using digital technologies and analytics to derive more value from its physical assets. The need for this sector to change and evolve could not be greater: The organizations that manage water supplies around the world are facing critical issues, and water scarcity is chief among them. Because of changes in our lifestyles, including increased consumption of grain, meat, and cotton clothes, growth in water consumption per capita has doubled over the last century. And demand is increasing. According to a 2016 report from the UNEP-hosted International Resource Panel, water demand will outstrip supply by 40% by 2030. During the same period, according to the World Economic Forum, water infrastructure faces a huge $26 trillion funding shortfall. If not addressed, water scarcity will squeeze food and energy supply chains, and stall economic growth. To help solve this problem, organizations are using digital technologies and data analytics to improve leak detection. According to the World Bank, the world loses about 25-35% of water due to leaks and bursts, and the annual value of this non-revenue water — water produced and lost by utilities — is $14 billion. Organizations are also using these tools to improve maintenance, infrastructure planning, water conservation, and customer service (including repair efficiencies and pricing). Although members of the water industry have found success using digital technologies and analytics, they’ve also faced challenges when trying to transform the roles and mindsets of their employees and their internal- and customer-facing processes. But those that have managed to integrate their technological advances with two other key elements — people and processes — have created more than data; they’ve also created value for their enterprises and society. People: Good leaders know that using and interpreting data is not only a search for insights; it’s also about enlisting the hearts and minds of the people who must act on those insights. The challenge is that employees are used to doing things in a certain way, and aren’t always quick to change. For example, despite the social and efficiency value of using predictive analytics to prevent water leaks, many utility managers view themselves as heroes for responding after the leak has occurred. As one U.S. executive explains, “Most current practice is to wait for the service-failure event and judge performance by reacting to it, because the utility doesn’t get credit from regulators or the media for preventing leaks that the public doesn’t know about.” Regulatory incentives often exacerbate this behaviour. In many parts of the world, the increased operational and infrastructure costs are simply passed on to consumers. In other regions, however, (e.g. Australia, Israel, the U.K.), regulators steeply fine utilities for inefficiencies – and it’s no coincidence that a number of utilities in these countries have been leaders in adopting new digital tools. But even with proper incentives, there are still challenges. For example, many U.S. utilities have installed smart meters — an investment that can easily surpass $60 million in cities with 150,000 water connections, or about 15% of average annual utility revenue and water rates. But after making this investment and charging consumers for it, there were false alerts about leaks, which caused expensive repairs and claims processing. The law of unintended consequences was also alive in operations: because of the initial problems, the field transmissions group distrusted the data — even after the IT problem was diagnosed and resolved – and therefore required additional training to assuage their doubts. This is why it’s imperative to change roles, break down silos, and adopt new decision support systems when implementing new technologies. A water authority in Australia, which deployed a software solution for improving network efficiency, is a case in point. Its managerial team first formed a working group of personnel from business units across the organization — from retail and asset management to planning and maintenance crews. The group met weekly and by doing so they recognized that the software detected faulty incidents and provided a focal point to collect information (e.g., types of problems, magnitude, location, etc.) to make better decisions in other areas of the business. As a result, they created procedures that shortened the average repair cycle by 66%, saving millions annually. Longer term, the information allowed the team to make more focused investments based on types and frequency of problems in each zone, and the ability to compare — and negotiate better terms with — vendors based on quality and performance. Processes: As with other sectors, water utilities are going through a shift from treating users as connections who pay bills, to customers that have needs, habits, and strong opinions if things go wrong. And data analytics is enabling them to provide faster and more effective responses. “We can compare the efficiency in each of the six sectors making up our network and evaluate the response time it takes to identify potential damage, ensuring faster repair times,” an executive at one of Romania’s leading water utilities told us. “As well as smarter insights, the event management system ensures better managerial attention to continuous improvement in our operations and service to customers, and helps to prevent large-scale damage from hidden leaks.” But in order to achieve those outcomes, the Romanian utility had to change its organizational processes and metrics. The utility had to re-define company metrics goals and create weekly and monthly processes for reviewing performance-against-goals. The software provided relevant data — e.g., the start time of a leak and when it was fixed, based on real-time information, not when reports were submitted. But it was new customer-facing processes such as setting repair-cycle targets and comparing performance-against-goal by region, which created a healthy sense of internal competition and led to more productive behaviours. These issues aren’t unique to the water industry; they’re also relevant to companies in other industries that are using data and digital tools that are increasingly available. For example, sales is the focus of potentially big improvements via new tools that can provide better lead generation, forecasting, and targeting. But in order to take full advantage of these tools, sales organizations will need to change their compensation incentives, internal processes, and the skill sets of their staffs, among other things. More generally, while most current talk about big data seems to assume the replacement of physical assets by digital technologies, a larger and more impactful trend is the use of online tools to improve physical asset utilization in off-line businesses, as in the water industry. In that context, the role of data is not to make a manager sound analytical. Its role is to help make better decisions and drive value for the company. And you can’t do that only with technology or analytics, no matter how good they are. Article: How the Water Industry Learned to Embrace Data Page 15
  • 16. Article: Smart Wastewater Networks from Micro to Macro What does it mean for a wastewater network to be “Smart?” What is the Wastewater Industry hoping to achieve by going on a “Smart” Journey? It is a subject that has rattled around the water and wastewater industries for many years and yet most of the focus has been on the potable water network side of the business where the obvious gain is reducing non-revenue water. However in the past few years the value of acting more “intelligently” in the wastewater network…nay the wastewater system has come more to the forefront as the value of taking a similar journey to our potable water colleagues comes to bear. The question is though, where do we start? The wastewater network is a complex system as it has multiple inlets and multiple outputs (if you take storm overflows) in to context. The answer from some of the Water & Sewerage Companies (WASCs) and consultants working with them has been to take a number of different approaches as we have recently heard at a number of conferences and workshops in the area of Smart Wastewater Networks. Starting small and from the ground up The major problem is understanding what exactly the problem is and from where it comes from and in doing so devising a strategy for its resolution. Is the problem related to • Flooding of both internal & external properties • Pollution incident detection and management • Alarm handling and response • Blockages & sewer misuse • Asset reliability & the cost of running the network • Sewer capacity and storm overflows • All of the above In truth, it is a combination of all of the above and there are various teams in all of the WASCs handling different aspects of what has to be done to protect the customer and the environment. One of the major issues is that of sewer misuse be it from fats, oils & greases to the wonderful aspects of what people throw down the supposed “wet bin,” any network technician in the industry will talk about FOG and unflushables as a major problem that has been attributed to 50% of all pollution incidents and 66% of all flooding incidents for one of the UKs WASCs. The solution is of course education and working with customers to understand the consequences of putting the wrong thing down the drain. Despite this there are technological solutions to the problem as well. A recent SWIG workshop heard from one engineer his vision of building the technological solution up from the bottom by using a combination of pump reversal modules that reverse the pump to clear blockages on an automatic basis, to restarting pumps to providing flow meters to detect whether a pump is actually working or not. The effect is to increase the technician visibility of what is going on in the network and enable them to be more effective in their diagnosis of issues protecting the customer in a more efficient manner but also protecting their Health & Safety by ensuring they are not called out to a false incident in remote areas in the middle of the night. And getting bigger…. Working on the small scale has its value but of course it won’t resolve all situations and there is a place for increased monitoring in the wastewater network with the major benefit being the protection of the Environment. This is where the Event Duration Monitoring programme comes in that is one of the focuses of the Water & Sewerage Companies this Asset Management Period (AMP). It stems from a Ministerial Direction that promised the monitoring of the “majority” of storm overflows by 2020. The knowledge about these assets and their performance has been questioned and the subsequent impact on the environment a big question that the Minister and the Environment Agency want answered to find out the inherent problems that lie in the wastewater collection network. Over the next few years teams of people will install thousands of monitors prioritised so that the highest impact areas are completed first to monitor when, where and for how long spills from the wastewater network are happening. The first monitors have been installed and a year’s worth of data collected and approximately 12% of combined storm overflows warrant further investigation based upon their current performance and depending upon the results drive further investment within the network infrastructure. The thing for the future is to see what impact any schemes have on the holistic environment to see what improvements can be made and what impact this has on the holistic water environment and the quality of future discharges from our wastewater treatment works. Page 16 Figure 1: Some of the problems in the Network from blockages to pump wear to seals stopping working. Cost range into millions of pounds (From Lorenzo Pompa - The benefits of using automation in the network) Figure 2: The % of CSO spilling from the first year of EDM Data (From Phil Hulme - Application of storm overflow Event Duration Monitoring Data)
  • 17. …..and bigger Taking a step on from the monitoring of the network the next question that has to be asked is what we can do to provide a more strategic management of the wastewater network. It is an approach that has been taken in Europe for many years. The multiple reports by UKWIR & Mouchel on Active System Control describe in detail what work needs to be done and what has been done in other countries. A great example of this is the work in Denmark that has been done to provide an overall management of the wastewater network using high speed modelling techniques that allows the wastewater network to be managed more effectively. An example of this is the work that was done in the Southern Water region of the UK in the Eastney project that has used a combination of modelling techniques and rainfall radar as part of the solution to mitigate the risk of flooding within the area. This was part of a much wider solution that included green infrastructure but the Smart Wastewater Network gives the company advanced warning of what is going to happen moving forward and allows the company to make decisions on methods of operation of the pumping station which is a critical part of the overall wastewater treatment system. The individual parts of this project form building blocks to what the Smart Wastewater Network is made up of including (in a simplified way): • Weather radar and modern rain gauges • Sewer Level Monitors • Centralised sewer network model capable of fast simulation • Communication and telemetry systems to tie it all together The weaknesses if anything is the quality of the weather radar systems but this data as a service is a solution that others within the Water Industry are looking at – a couple of years ago high quality XRF weather radars were investigated by the University of Delft and weather data and prediction has become a data service within the Water Industry. It is the impact of the weather radar and using the data from the rain gauges that will allow for predicative models to look at the impact onto the “Smart Network” to help the industry to manage the flows that we receive. The future of Smart Wastewater Networks – a holistic approach The ultimate aim of a “Smart Wastewater Network” is to help the water industry to make a better, informed decision about how to operate the wastewater system by facilitating the flow of wastewater through the entire system all the way from the customer’s toilet, through collection, into treatment and out to reuse or recycle in such a way that we optimise not just the cost of the whole process by the impact that it has on both people and the environment. Operationally, this is by limiting the incidents and events such as pollutions and flooding to either zero, the brave aim of the future, or to as near to zero as we can possibly get. This can be achieved and we are seeing water companies take this approach now with a number of different technologies. All the way from a simple “Customer Flood Alarm” that warns of rising levels in areas of known problems so that issues can be dealt with priority to systems that stop pump blockages and warn of problems such as using pump reversing, monitoring of pump currents and using flow meters to give a true picture of what is happening. The strategic direction is looking at the much wider more encompassing systems and the advantage here is to limit the capital build of detention tanks in the network and storm tanks within the treatment works. The best case of this was in Barcelona where a Smart Wastewater Network was constructed for the Olympics in 1992. The alternative was a vast detention tank under the centre of the city and the Smart Wastewater Network approach was the considerably cheaper option. From a holistic point of view the treatment works must be brought into the equation too and it is at this point, bringing together two aspects of the industry – network and treatment, where the real savings can be made by controlling the flow of water through the whole system and limiting the environmental impact of the wastewater systems that we can truly get more for less. So, what does this wastewater system of the future look like? In normal day to day conditions the smart wastewater network of the future controls flows flattening out the flows that are received at the wastewater treatment works, monitoring how much time sewage spends in the network but also aiming for a completely flat flow profile at the treatment works, with regular automated flushing cycles to ensure that the sewer keeps as debris free as possible controlled by sewer level monitors to pick up unusual levels that might highlight blockages starting to develop. Various tools are used to keep the problems at bay such as pump-reversing and flow monitoring to ensure that the flows keep moving and pumps don’t block. Where problems are starting to appear and hot spots start to develop this drives an alert to look into potential sewer misuse. Combined Storm Overflows from the system are dry. Figure 4: - A customer “sewage alarm” (From Rachel Cunningham - Smart Initiatives to prevent flooding) Page 17 Figure 3: The building blocks of Smart Catchment Management from real time data to modelling to operational forecasts will play and element in the future (From Jody Cockcroft - Portsmouth Flood Alleviation Scheme
  • 18. Flows pass forward to the treatment system where the relatively uniform flows enable an efficiency in the treatment and the virtual elimination of the need for treating peak flows. This enables a uniform production through the process which further improves the treatment efficiency. The system predicts a rainfall event and this is where the intelligence of the system kick in. The prediction is that the sewer in its current state can’t manage all of the flows within a 6 hour period and the system re-calculates and ramps up flows minimised so that the required capacity of the sewer is available with an appropriate safety margin. The flows are managed and held within the sewers. The CSOs are still dry. The rain-storm continues longer than predicted and this causes a potential problem at a customer’s premises. This causes an alert in the control centre and allocates a team to resolve the issue for the customer so that an incident doesn’t happen. Now this is a fictional, potential, system of the future but what we have heard at the various workshops and conferences is that this is a future that in reality isn’t that far away. The technology exists from the sewer alarms, pump-reversing systems and the potential for network flow monitoring as well as event duration monitoring on the network as well as the customer flood protection alarms. Taking a step up in complexity the weather radar systems, network model and active system controls systems also exist and finally the analytics and visualisation systems also exist to so that the vast amount of data that is inevitably produced is shown in a way that can be understood and actioned upon. It’s a system that is starting to be developed by some of the Water Companies and more recently we have seen the development of the factory approach that was famously mentioned in the STOWA report of the wastewater treatment works of 2030. Arguably things have gone in a slightly different direction and the energy, water & nutrient factories have their “production efficiency monitoring system,” which any other industry would consider its absence, at best, unwise. The approach is of course working fantastically well and the extension of this approach to the wastewater network is just another step to a “Smart Industry” future. IBM and Dublin City University Water Institute Collaborate to Advance IoT Research for Water Management IBM have announced this month with the Dublin City University (DCU) Water Institute a collaborative research pilot to leverage Internet of Things (IoT ) technologies for environmental monitoring and management. The deployment of DCU sensors with IBM’s machine learning and cognitive IoT technologies will aim to help protect and conserve natural resources and address environmental management issues such as water quality for both freshwater and marine environments. IBM’s cognitive IoT technologies are able to provide deep learning capabilities for sensor platforms, which ensure quality and reliable data capture under a range of environmental conditions. Advanced analytics embedded in IoT-based sensor platforms, or the sensors themselves, can help detect subtle trends or early detection of environmental changes that may be crucial to public health and safety or remediation efforts. The collaboration brings together IBM Research efforts in the area of cognitive IoT-based environmental solutions with DCU’s Water Institute expertise and leadership in environmental sensing via the university’s National Centre for Sensor Research (NCSR). As a part of the program, IBM has joined the DCU Water Institute Industry Advisory Council. IBM scientists are working on integrated IoT solutions to support a myriad of sensors to help better understand and ultimately manage a multitude of ecosystem challenges. These may include water quality changes due to natural, artificial, or climate-related effects. Sensors can measure physical, chemical, and biological parameters to help better understand changes in the environment. Applications may include improved management of pollution from sources such as agricultural or storm water runoff that can affect lakes, rivers, estuaries and marine ecosystems. IBM and DCU Water Institute will be selectively piloting these technologies in Ireland and in the United States. The first sensors are being deployed on Lake George in New York State in conjunction with the ongoing Jefferson Project at Lake George. “Over the next few years, we believe that Internet of Things technologies will play an important role in helping protect the environment and natural resources. At IBM Research, we are excited to leverage IBM’s expertise in cognitive and IoT environmental monitoring and management with the DCU Water Institute to help advance the future of water management,” said Harry Kolar, Distinguished Engineer, IBM Research. The collaboration will focus on newly developed DCU sensor technologies that can have the potential for monitoring several key aspects of water quality at costs significantly lower than current commercial technologies. This new generation of sensors, when combined with IBM’s environmental IoT platform may eventually help provide significant benefits for water management on a global scale. “The technologies developed during this important collaboration will aim to disrupt the current norms of costly sensors limiting their distribution at IoT scale to provide really valuable information which supports better decision-making about our valuable water resource,” said Professor Fiona Regan, Director of the DCU Water Institute. The DCU Water Institute aims to develop technology-based solutions to facilitate greater water stewardship, translating technologies developed in the NCSR to the water domain. DCU Water Institute scientists and engineers are developing novel sensor and data analytics technologies to improve how we monitor water quality. Page 18
  • 19. Article: Developing an alternative to Coriolis flow measurement Coriolis flowmeters first came into commercial use in the 1970s and ever since they have been developed and refined to meet a growing number of applications across a wide range of industries. However, where fluid density is not required, there is an alternative that offers all of the accuracy of Coriolis as well as addressing many of its substantial drawbacks. Developed by fluid control experts at Bürkert, the FLOWave product uses Surface Acoustic Wave (SAW) technology to deliver precision flow measurements from a smooth, uninterrupted flow-through pipe section - meeting all the requirements of a hygienic application. The demand for more advanced, non-contact measurement technology has seen the rise in ultrasonic, electro-magnetic and Coriolis technology and each of these have their place. However, even these devices have limitations including non-conducting liquids or those containing bubbles or debris. Ultimately it may be the location, space or orientation that may determine the most suitable design for a particular application. Challenging the constraints of flow measurement Coriolis flowmeters are regarded as the top specification flowmeter due to their versatile capabilities for both fluids and gases. However, the initial cost of such devices can be very high and they do have some constraints. The design requires the flow direction to be determined before installation and once installed there will be a pressure loss across the flowmeter, depending on the specification. In addition, the designer may have to choose between drainability and accuracy since the more accurate bent-tube Coriolis flowmeter is difficult to drain and may present a contamination issue. In such cases it may be necessary to specify the straight-tube Coriolis device to ensure hygiene standards are met, but this can be at the expense of accuracy. In terms of liquid flow measurement, there is a clear opening for a lower cost device which can deliver a compact, non-contact measurement which is accurate irrespective of media characteristics, flow direction and flow conditions. In answer to that designers at Bürkert have developed SAW technology to create an extremely compact device that has the same hygienic properties and cleanability as the rest of the process pipework. Accuracy without compromise Until now, it has been difficult to match the accuracy levels demonstrated by Coriolis, without introducing other weaknesses to the application. Magmeters rely on the process fluid being conductive, while other designs require components to be in direct contact with the fluid, making it difficult to meet the necessary hygiene standards. Accuracy and repeatability often rely on laminar flow which can require certain lengths of straight pipe upstream of the flowmeter. Continued testing and development of the FLOWave product has minimised this requirement. In addition, the use of Bürkert’s Teach-In function introduces automatic calibration that can maximise accuracy, even in applications that require short pipe runs. Another issue that dominates discussions around flowmeter selection is weight, especially in process skids, where it needs to be minimised in order to retain the portability of the skid. The basic design of Coriolis flowmeters does put them at a disadvantage, in some cases a DN25 unit can weigh over 15 kg, compared to just 2.4 kg for the Bürkert product. In situations where the flowmeter needs to be removed from the installation for any reason, such as cleaning, the implications for manual handling need to be considered. It may require additional mechanical assistance, which will add to the overall time for maintenance or cleaning. Finally, any discussion regarding Coriolis would not be complete without some mention of the initial cost. Due to the technology and the scale of these flowmeters, even the most basic specification can represent a significant investment. Furthermore, the energy consumption of the two oscillators is considerably higher than more modern flowmeters such as the FLOWave. Figure 1: The FLOWave product uses Surface Acoustic Wave (SAW) technology to deliver precision flow measurements from a smooth, uninterrupted flow-through pipe section. Figure 2: The FLOWave works regardless of flow direction and conductivity of the medium, and will evolve to measure multiple parameters. Page 19
  • 20. Improving technology to reduce costs FLOWave offers a way to measure the flow of a liquid and its temperature without installing a large, expensive, and energy-draining piece of equipment. As well as being a leap forward in terms of size and energy use, FLOWave is free from parts in the measuring tube. This cuts the risk of contaminating the medium to zero while also eliminating pressure loss, leakage, and dead zones. FLOWave works regardless of flow direction and conductivity of the medium, and will evolve to measure multiple parameters. From the outset, FLOWave aimed to resolve the traditional issues associated with the Coriolis flowmeter, such as cleanability, pressure drop, weight, cost and energy consumption. At the same time, the designers were also keen to launch a product that could be improved over time, using more reference data to refine the measurement algorithms for different types of media, which is very much the case with FLOWave. This innovative product already addresses many of the challenges set for it by making improvements on existing precision flow measurement technology, specifically Coriolis. However, it is also set to continue to be developed further, to widen its appeal for other applications and help more process engineers achieve their goals in a more cost effective manner. A digital future for Severn Trent Water Severn Trent PLC has held a Digital, Innovation & Technology showcase event for investors outlining how cutting-edge digital technologies are transforming the business and driving value for customers, employees and shareholders. Severn Trent said that by using cutting-edge digital technology and innovation it is driving improvements in customer outcome delivery incentives, developing a more efficient workforce and underpinning its ability to generate totex efficiencies. Digital technology is also being used to enhance Severn Trent’s understanding of its network and prioritise investments to position its asset base for the current and future regulatory periods. Severn Trent told investors that its digital strategy is making a huge difference today and that it was continuing to drive and embed a digital future. All of the investments pay back on a two year basis. The water company has also established a new customer management portal which collates diverse sources of information into a single, insightful view of the customer. It also has a multi-channel offering for customer contact in place, including self service, web chat and social media. According to Severn Trent, it is currently the only water company with 24/7 availability for all calls, not just emergencies. The water company is targeting a significant annualised run rate totex reduction of £20 million via a range of improvements e.g. reducing operating costs, less travel time, shorter time per job and more efficient use of chemicals and consumables. Severn Trent said it is taking smarter investment decisions through a range of measures: • Improving data capture of asset health and maintenance tasks • Using analytics to predict asset deterioration • Reducing risks by real-time water quality measurement and insight • Creating a culture to embrace new technologies, including satellite imaging, to continually reduce costs and risks. Digital technologies now being used across the company include new apps and devices, a new network modelling system, new quality analytics, connecting sensors and analytics to prevent flooding and pollution and the development of satellite imaging. The firm is also looking at developing opportunities for further efficiency through innovation, such as drone inspection. Apps play a key role A wide range of apps are now being used by Severn Trent, including: • new fieldworker apps and devices • new stores apps and centres • new treatment works app • new colleague app for customer ODIs • supply chain now on fieldworker app • new risk management app The new devices being used, with easier to use fieldworker applications, improved connectivity and greater mobility, include the latest version of Panasonic’s Toughbook. Severn Trent’s own internal app team have built two new applications for use in the field; SiteSnap Page 20
  • 21. • Simplifies the creation of 100,000 traffic management sketches per year • Reduces the number of permit application rejections • Saves technicians 20 minutes per day, equating to £360k per year SiteView • App records evidence of compliance with strict Highways Authority requirements • Severn Trent expects to avoid £250k per year in fixed penalty notices The utility has also consolidated its stores into three regional distribution centres and six satellite stores and implemented new stock management technology. Bar-coded stock control has been used to create a supermarket style self-service experience. The new system has improved stock availability, reduced risks and enabled better supplier discounts, generating savings of £1.2 million per year through improved stock availability and reduced one-off purchases. Looking for new opportunities to use satellite technology In other areas of the business, Severn Trent is exploring options to use satellite technology to enhance asset monitoring and inspection regimes. The firm is actively looking for new opportunities to use cutting-edge satellite technology. The first pilot has the potential to help identify leakage locations and will help reduce the cost to resolve leaks. The technology works by identifying interactions of soil and chlorinated water – Severn Trent said it would seek to roll it out further if it could demonstrate a strong return on investment. Expanding use of data and analytics New high-speed data loggers are also being deployed around the network to support a move to prediction and prevention. The loggers provide real-time information directly to the control room, enabling the identification of pressure spikes which can lead to asset failure. The technology helps identify the root cause of failure to assist prevention and enables proactive intervention to prevent assets from deteriorating – avoiding £1.5m in customer ODI penalties. Severn Trent said it is using the wealth of data in its systems to build analytical capabilities and help analyse the network, expanding the use of data and analytics to support overall management of asset health. In its wastewater network, the water company is using an operational decision management tool to help identify blockages in the network and automate decision making. Data from 1,000+ loggers combined with historic data and weather information can be used to identify when a sewer is most likely to be blocked. The system helps prevent flooding and pollution incidents, improving Severn Trent’s predictive capability by 33%, reducing pollution incident by 50 per year and avoiding £3 million in penalties. Intelligent pumping stations to optimise pumping operations The company is also looking at intelligent pumping stations and catchment control – a network pumping station trial is utilising machine learning, automation and remote control to optimise pumping operations. Severn Trent is also collaborating with the supply chain to create intelligent assets within the network – the overall aim is to optimise the network by utilising the large amount of latent storage. Severn Trent’s new app-based Operational Risk Management (ST-ORM) system allows easy recording of operational risks identified and enables employees to record all operational risks, real-time, wherever they are on mobile devices. The firm is forecasting £400k per year totex saving through proactive risk mitigation. New drone technology is also being used to inspect assets - applications including asset inspections, leading to savings from absence of scaffolding and minimised health and safety risks. Estimated inspection cost savings of £300k per year and the utility is also currently exploring other uses, such as checking that treatment processes are optimised. Pushing forward with technological advancements can continually drive down costs and risks Liv Garfield, Chief Executive Severn Trent PLC, said: “I am delighted to be showcasing how we are truly digital in what has been perceived to be an analogue sector and driving clear value for all our stakeholders. Being at the frontier of adopting digital technology and innovation positions ourselves to drive value in our company which leads to a better experience for our customers and strong financial rewards for our shareholders.” “Digital technology and innovation enables us to provide our core products; water, waste and retail services at the right costs and to the right quality. It makes us work more efficiently, helps manage our energy costs, and optimises the way we buy and use consumables. It also helps to reduce our cost to serve and bad debt management.” “We are committed to maintaining our upper-quartile position versus our peers in our waste business and moving to upper quartile in our water and retail business, and I am excited to be able to show just how digital is being used to do this. By pushing forward with technological advancements - all of which pay back under two years - we believe we can continually drive down costs and risks in our business and build an enduring track record of high operational and financial performance now and into the future.” Page 21
  • 22. Don’t miss the upcoming SWAN 7th Annual Conference to be held 9th -10th May, 2017 at the Tower Hotel in London. This year’s conference will focus on creating smart, resilient water and wastewater systems, encompassing four key pillars: • Safe water quality • Reliable service • Secure systems • Efficient operations This two-day event will feature 20 leading, global water utilities, including speakers from Veolia, Suez, PUB, American Water, Unitywater, Essbio, AEGEA, FCC Aqualia, Vitens, City of Dakar, Taiwan Water Corporation, and the OECD. SWAN is pleased to offer conference attendees a special rate of £185 inc VAT (inc breakfast) at the Tower Hotel. Note, this rate will only be available until March 10th. View the agenda here Register here Proudly Sponsored by Page 22
  • 23. April 2017 Smart Water Systems 24th -25th April 2017 London, UK Hosted by the SMi Group May/ June 2017 Specification & Installation of Sensors 3rd May 2017 Principality Stadium, Cardiff, Wales Hosted by the Sensors for Water Interest Group SWAN Conference 2017 9th -10th May 2017 Tower Hotel, London UK Hosted by the SWAN Forum Leakage 24rd May 2017 NEL, Glasgow, Scotland Hosted by the Sensors for Water Interest Group 12th Specialized Conference in ICA 11th -14th June 2017 Quebec City, Canada Hosted by the International Water Association July 2017 Low Cost Sensors 5rd July 2017 University of Southampton, UK Hosted by the Sensors for Water Interest Group September 2017 Sensing in Water 2017 27th -28th September 2017 Nottingham Belfry, Nottingham, UK Hosted by the Sensors for Water Interest Group October 2017 Wetsus Congress 9th - 10th October 2017 Leeuwarden, Holland Hosted by Wetsus Page 23 Conferences, Events, Seminars & Studies Conferences, Seminars & Events Specification & Installation of Sensors: Giving the sensor the best chance Where: Principality Stadium, Cardiff When: 3rd May 2017 Getting reliable data from sensors and instruments relies on three key steps – getting the right instrument for the job, installing it correctly and performing appropriate on-going maintenance and calibration. This event focuses on the first two steps. To get the right instrument needs a good specification and understanding of the application. We will look at the role of Standards, from MCERTS to ISOs, from the viewpoints of users and suppliers, exploring whether they can be a barrier or an aide in improving quality and innovation. We will also look at the role that robust technical evaluation can play in procurement of instrumentation against a user specification for a particular application. Good installation practice is also key to good performance. Some of the latest findings related to installation of flowmeters and other instruments will be presented. Leakage Where: NEL Glasgow When: 24rd May 2017 Leakage of water from the distribution network continues to challenge the water industry. Water companies are focussed on managing leakage to levels that are acceptable to customers and justifiable on economic grounds. The industry is also concerned about the long term resilience of water supply, and see the need for lower levels of leakage to improve resilience. At the same time, many water companies have incentivised targets to reduce leakage further. Therefore, there is a need for reliable and accurate measurement of leakage in the distribution system; from the point of abstraction, through the treat- ment process, and up to the customers’ stop tap. Improved measurements are needed in terms of quantifying leakage in different areas, accurately pinpoint- ing leakage in the network, and prioritising leakage repairs. Sensors, measurement systems and data analytics play an important part in managing and reducing leakage. This workshop will bring together water companies, researchers and the supply chain to explore how new technologies and systems can help to reduce leakage and save water.
  • 24. Sponsored by APRIL 2017 COPTHORNE TARA HOTEL, LONDON, UK www.smart-water-systems.com Register online or fax your registration to +44 (0) 870 9090 712 or call +44 (0) 870 9090 711 SPECIAL RATES AVAILABLE FOR UTILITY & PUBLIC SECTOR ORGANISATIONS | GROUP DISCOUNTS AVAILABLE HIGHLIGHTS IN 2017: • The hidden value of Data and Information – innovative solutions to improve your strategies • The water industry after the Smart Meter Roll Outs – learn about the most recent developments and challenges water utilities are facing • The Scottish concept of a Hydro Nation – improving water economy by addressing the value of water resources • International data insight – an experience report on Real-Time Demand forecast and Big Data challenges • Customer-focused engagement programmes to improve satisfaction – how these developments are changing customer service SMi presents its 6th annual Conference on… Smart Water Systems Addressing the latest Smart Water Management issues and Data-Driven solutions REGISTER BY 16TH DECEMBER TO SAVE £400 | REGISTER BY 31ST JANUARY TO SAVE £200 | REGISTER BY 28TH FEBRUARY TO SAVE £100 @UtilitiesSMi #SmartWaterSystems CHAIRMAN FOR 2017: • Jeremy Heath, Innovation Manager, Sutton and East Surrey Water plc FEATURED SPEAKERS INCLUDE: • Ali Fanshawe, Metering Strategy Manager, Thames Water • Andy Smith, Regional Optimisation Manager, Anglian Water • Jon Rathjen, Group Leader Water Industry Division, Scottish Government • Ben Earl, Water Efficiency Manager, Southern Water • Ken Black, Optimisation Manager, Northumbrian Water • Antonio Sanchez Zaplana, Engineer Manager, Aguas de Alicante • Mike Bishop, Head of Operational Control and Development, Dwr Cymru Welsh Water A: Customer and Stakeholder Engagement in the Digital Age: How can new technologies and their application transform your key relationships 08.30 – 12.30 Hosted by: Chris Wallace, Director and Founder, WallaceTransform B: The fundamentals of Data & Information in the Smart Water Industry 13.30 – 17.30 Hosted by: Oliver Grievson, Group Manager, Water Industry Process Automation and Control Group PLUS TWO INTERACTIVE HALF-DAY POST-CONFERENCE WORKSHOPS | WEDNESDAY 26TH APRIL 2017 CONFERENCE: 24TH - 25TH WORKSHOPS: 26TH Page 24