NISAR Oil, Gas, and Water Underground Reservoirs
•
0 likes•8 views

NISAR Oil, Gas, and Water Underground Reservoirs NASA National Aeronautics and Space Administration NASA-ISRO Synthetic Aperture Radar (NISAR) By Dr. Pankaj Dhussa

Recommended
Recommended
More Related Content
Similar to NISAR Oil, Gas, and Water Underground Reservoirs
Similar to NISAR Oil, Gas, and Water Underground Reservoirs (20)
More from Dr. Pankaj Dhussa
More from Dr. Pankaj Dhussa (20)
Recently uploaded
Recently uploaded (20)
NISAR Oil, Gas, and Water Underground Reservoirs
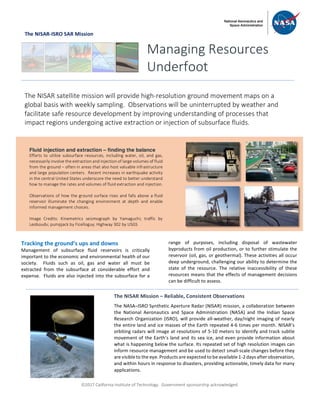
- 1. ã2017 California Institute of Technology. Government sponsorship acknowledged. The NISAR-ISRO SAR Mission Tracking the ground’s ups and downs Management of subsurface fluid reservoirs is critically important to the economic and environmental health of our society. Fluids such as oil, gas and water all must be extracted from the subsurface at considerable effort and expense. Fluids are also injected into the subsurface for a range of purposes, including disposal of wastewater byproducts from oil production, or to further stimulate the reservoir (oil, gas, or geothermal). These activities all occur deep underground, challenging our ability to determine the state of the resource. The relative inaccessibility of these resources means that the effects of management decisions can be difficult to assess. Managing Resources Underfoot The NISAR satellite mission will provide high-resolution ground movement maps on a global basis with weekly sampling. Observations will be uninterrupted by weather and facilitate safe resource development by improving understanding of processes that impact regions undergoing active extraction or injection of subsurface fluids. The NISAR Mission – Reliable, Consistent Observations The NASA–ISRO Synthetic Aperture Radar (NISAR) mission, a collaboration between the National Aeronautics and Space Administration (NASA) and the Indian Space Research Organization (ISRO), will provide all-weather, day/night imaging of nearly the entire land and ice masses of the Earth repeated 4-6 times per month. NISAR’s orbiting radars will image at resolutions of 5-10 meters to identify and track subtle movement of the Earth’s land and its sea ice, and even provide information about what is happening below the surface. Its repeated set of high resolution images can inform resource management and be used to detect small-scale changes before they are visible to the eye. Products are expected to be available 1-2 days after observation, and within hours in response to disasters, providing actionable, timely data for many applications. Fluid injection and extraction – finding the balance Efforts to utilize subsurface resources, including water, oil, and gas, necessarily involve the extraction and injection of large volumes of fluid from the ground – often in areas that also host valuable infrastructure and large population centers. Recent increases in earthquake activity in the central United States underscore the need to better understand how to manage the rates and volumes of fluid extraction and injection. Observations of how the ground surface rises and falls above a fluid reservoir illuminate the changing environment at depth and enable informed management choices. Image Credits: Kinemetrics seismograph by Yamaguchi; traffic by Leoboudv; pumpjack by Ficelloguy; Highway 302 by USGS
- 2. ã2017 California Institute of Technology. Government sponsorship acknowledged. Continued from front page The past decade has seen a substantial increase in the number of earthquakes triggered by both injection and production of subsurface fluids, with Oklahoma now experiencing more earthquakes each year than California. Globally, radar imagery has already been used to characterize the extent of reservoir depletion around oil, gas and water wells, with renewed efforts by researchers to understand the complex networks of faults surrounding the areas of exploitation. The pattern of subsidence or uplift is a window into the pattern of fluid flow below – whether the activity is concentrated near the well as expected, or if it jumps into a neighboring region can be an important indicator of stability or problems to come. The increased frequency of earthquakes in regions such as the central United States affects regional populations and infrastructure. Operations managers at individual well sites, insurance companies and disaster responders all require information about the probabilities of strong shaking and aftershocks after a large event to inform the public and manage disasters. Characterizing the current patterns of earthquakes we are experiencing will help us understand how to anticipate and mitigate future damage. The energy needs of the world’s population will continue to grow, requiring new and innovative ways of meeting them. Satellites that provide synoptic views of the globe from space can aid us in monitoring and characterizing the effects of these efforts. The upcoming NISAR mission will have a dependable observation plan to collect high resolution images of 90% of the Earth’s land surfaces at regular intervals (12-day repeat orbits), which contrasts with monitoring by existing radar satellites, which typically focus only on areas of interest to the specific government or scientific agency that launched the mission. For instance, the oil fields in Texas and the central United States were not observed frequently, if at all, by most previous missions. The observations made over the lifetime of NISAR will be a giant step forward in our understanding of subsurface fluid flow and associated seismicity, and will inform the next generation of methods for characterizing and managing these resources. Number of earthquake sequences each year that contain at least one magnitude 3 or larger earthquake, since 1973. From McGarr et al., 2015, in the journal Science. Recent advances in the technology used in hydrocarbon production, including enhanced oil recovery, are associated with a dramatic increase in earthquakes felt in the central United States since the mid-2000s. Damaging earthquakes only appear to be related to a small fraction of wells, but there is not yet enough data to definitively determine in advance the safety of operations at a particular site. Earthquake locations derived from seismic data (see figure at right) illuminate part of the picture. New research shows that induced earthquakes may behave in slightly different ways than “natural” events, providing a potential pathway to better understanding and managing them. However, seismic data is blind to the slow, longer term deformation of the ground surface associated with pumping, injection and even slow, creeping movement on faults that will eventually rupture in a more damaging earthquake. NISAR can provide the missing link to this puzzle, complementing the available seismic data and helping to track how patterns of fluid flow beneath the surface relate to patterns of observed earthquakes. Increasing rates of earthquakes in the central United States. - California - Oklahoma
- 3. ã2017 California Institute of Technology. Government sponsorship acknowledged. Oil fields and aquifers imaged from space: Monitoring changes in shallow aquifer systems and understanding the geologic controls on their basic configuration is rapidly becoming an essential challenge, as society attempts to respond to increased pressures on water resources. These challenges are present globally in arid regions, with the impacts acutely felt throughout the western United Sates, and especially in southern California. Historically, understanding regional aquifer systems has relied on monitoring wells that are sparsely distributed across impacted areas. Satellite-based radar imagery, when available, can be used to characterize how the Earth’s surface warps and deforms above actively-managed oil and water reservoirs. However, these observations cannot be made when the ground surface changes significantly between image acquisitions – growth of crops, tilling of fields, trees shedding their leaves are all processes that degrade data quality. The regions in California shown below have had some of the best radar coverage available worldwide, but still contain areas with rapid change where the time interval between images is too long. Other regions, such as the Central United States, have had far less data coverage. NISAR data would be acquired almost 3 times more frequently than the data used in the examples below, and would be acquired regularly over the entire United States. This would allow imaging of areas in Oklahoma, Texas and Kansas that experience both active agriculture and hydrocarbon/water resource development. Right: Rate of ground subsidence in Central California imaged using the European Space Agency’s ENVISAT satellite, averaged over the time period 2008-2010 (color), overlain on Landsat imagery (grayscale). Both the results of extraction (red) and injection (blue) can be seen. Gray areas are regions where the ground surface changed significantly between images, due to crop growth and tilling of fields. Roads and cities still yield high- quality results. Examples: Left: NISAR data will permit systematic mapping and monitoring of shallow aquifers. Both long term and seasonal changes cause movement of the surface. In many cases, mapping the timing of the maximum seasonal surface uplift or subsidence can delineate the boundaries of the subsurface aquifers with fine detail. In this example, taken from the greater Los Angeles Metropolitan area in Southern California, color indicates the time during the year when peak motion occurs. The aquifer is characterized by sharp boundaries, some associated with faults that have ruptured in earthquakes.
- 4. ã2017 California Institute of Technology. Government sponsorship acknowledged. FOR MORE INFORMATION: General introduction: https://earthquake.usgs.gov/research/induced/ http://nisar.jpl.nasa.gov/ Community reports Petersen, M.D. et al. (2016), 2016 One-year seismic hazard forecast for the Central and Eastern United States from induced and natural earthquakes, U.S. Geological Survey Open-File Report 2016-1035, 52 p., doi:10.3133/ofr20161035. McGarr, A. et al. (2015), Coping with earthquakes induced by fluid injection, Science, 347; doi: 10.1126/science.aaa0494. National Research Council (2013), Committee on Induced Seismicity Potential in Energy Technologies. Induced seismicity potential in energy technologies. National Academies Press, 2013. National Earthquake Resilience: Research, Implementation, and Outreach (2011), National Academies Press, Washington, D.C. Relevant scientific papers. Jha, B., et al. (2015), Reservoir characterization in an underground gas storage field using joint inversion of flow and geodetic data, Int. J. Numer. Anal. Meth. Geomech, 39, 1619 – 1638. Yang, Qi., et al. (2015), InSAR monitoring of ground deformation due to CO 2 injection at an enhanced oil recovery site, West Texas, International Journal of Greenhouse Gas Control 41; doi: 10.1016/j.ijggc.2015.06.016. Hough, S. E. (2015), Shaking intensity from injection-induced versus tectonic earthquakes in the central- eastern United States, The Leading Edge 34; doi: 10.1190/tle34060690.1. Keranen, K. M. et al. (2014), Sharp increase in central Oklahoma seismicity since 2008 induced by massive wastewater injection, Science, 345; doi: 10.1126/science.1255802. Barnhart, W. et al. (2014), Seismological and geodetic constraints on the 2011 Mw5.3 Trinidad, Colorado earthquake and induced deformation in the Raton Basin, J. Geophys. Res., 119; doi:10.1002/2014JB011227. Ellsworth, W.L. (2013), Injection-induced earthquakes, Science, 341; doi:10.1126/science.1225942. González, P. J. et al. (2012), The 2011 Lorca earthquake slip distribution controlled by groundwater crustal unloading, Nature Geoscience, 5; doi:10.1038/ngeo1610. Ketelaar, V. B. H. (2009), Subsidence due to hydrocarbon production in the Netherlands, In: Satellite Radar Interferometry: Subsidence Monitoring Techniques, Springer, London, doi:10.1007/978-1- 4020-9428-6_2 National Aeronautics and Space Administration For more information, visit http://nisar.jpl.nasa.gov/applications Jet Propulsion Laboratory / California Institute of Technology / Pasadena, California / www.jpl.nasa.gov