SlideShare una empresa de Scribd logo
1 de 150
Descargar para leer sin conexión
The U.S. Sub-prime Crisis – A Study of the recent economic
development in the U.S. and their likely impact on the Indian Economy


    A report submitted in partial fulfillment of the requirements of
         MBA program at ICFAI Business School, Ahmedabad.


Submitted to:                                             Submitted to:
Prof. Vivek Ranga                                     Mr. Sunil Chandra
Faculty Guide                                        (Country Head-DPM)
IBS, Ahmedabad.                              Almondz Global Securities Ltd.


                                                                              0 
 
A REPORT
                                 ON


     The U.S. Sub-prime Crisis – A Study of the recent economic
development in the U.S. and their likely impact on the Indian Economy


                                   BY
                            PARAMJEET KAUR


                                   AT
                    ALMONDZ GLOBAL SECURITIES LIMITED
                              NEW DELHI


    A report submitted in partial fulfillment of the requirements of
         MBA program at ICFAI Business School, Ahmedabad.


Submitted to:                                              Submitted to:
Prof. Vivek Ranga                                      Mr. Sunil Chandra
Faculty Guide                                         (Country Head-DPM)
IBS, Ahmedabad.                               Almondz Global Securities Ltd.

                                                                               1 
 
SUMMER INTERNSHIP PROGRAMME


     The U.S. Sub-prime Crisis – A Study of the recent economic
development in the U.S. and their likely impact on the Indian Economy


                                      Submitted By: Name: Paramjeet Kaur
                                                 Enrollment No.:07 BS 2784
                                                   Mobile No.:09974339611
                                     Email ID:paramjeet.kaur86@gmail.com


                                                                         2 
 
3 
 
ACKNOWLEDGEMENT


          Across the road to the Corporate World, Unknown pursuits came my way.
          A ‘Thanks’ would be too small a token, for all that with what I stand today!

The fourteen weeks Summer Internship Programme needs a laudable appreciation for the novel
experience of practical knowledge and the true insights of the clichéd Corporate Culture.
Thanking all the affiliates’, veterans in knowledge and virtuoso in experience would be a mere
token of gratitude, which may not be sufficient for all the knowledge imparted, and all the
blessings bestowed upon me.

I would like to express my immense gratitude to Mr. Sunil Chandra (Country Head, Debt
Portfolio Management) for guiding me throughout the whole project with his impeccable
knowledge. I owe my gratitude to Ms. Rajni Dasgupta (Vice President) who taught me the first
lesson of corporate culture. Mr. Abhilash Kumar (Manager) owes a special mention for the
invaluable insights that he provided me, which would be carried forward as a legacy of
knowledge and learning all through my life.

I am also thankful to all the staff members’ of Almondz Global Securities Limited, who have
always guided me whenever I needed help and acquainted me with the minutest details of
etiquettes and behavioral aspects.

I sincerely thank Mr. Vivek Ranga, who has always been a continuous source of encouragement
all through the project. I am also thankful to my faculty members and Prof. P. Bala Bhaskaran
for guiding me all the way. All the more, ICFAI University needs to be praised which has
provided the students with such a bright opportunity to have an exposure of the real corporate
environment for the valuable period of three and a half months to get the corporate ambience
imprinted on our minds to carry forward the learning’s of this first tryst with corporates in the
future struggle in the path of professional success.

Last but not the least, a special mention must be made to all those who have knowingly and
unknowingly helped me in the completion of this project. I owe my gratitude to my parents who
have always encouraged me in the pursuit of excellence.


Paramjeet Kaur
07 BS 2784

                                                                                               4 
 
TABLE OF CONTENTS 
ABSTRACT                                                                   10        

INTRODUCTION                                                                 11      

     Purpose of the Study                                                  11 

     Scope of the Study                                                    12 

     Limitations of the Study                                              12 

     Methodology of the Study                                              13        

INTRODUCTION                                                                 14 

HOUSING MARKETS IN U.S.A.: Major Contributor to Growth                     16 

     Homeownership‐ The American Dream                                     16 

     Economic Impacts of the Housing Sector                                18 

     Housing Sector having Macro‐economic Implications                     20 

     Impact on Communities                                                 20 

     Impact on Individuals                                                 21 

     Housing Contribution to Society                                       22 

LEVERAGED SECURITY MARKETS: The Double Edged Sword                         23 

     Leveraging                                                            23 

     Housing Sector: The Initial Fuel                                      23        

     Securitization: Prime Mover of the Crisis                             24 

     Sub‐prime Crisis: A result of Leveraging                              26 

SUB‐PRIME LENDING: The Flaws                                               29 

THE CRISIS AND CHRONONOLOGY OF EVENTS: Timeline of Implosion               32 

     Chronology of Events                                                  36 


                                                                                   5 
 
THE PARTIES IN THE CRISIS AND THEIR ROLE: Walking the Line                      53 

        Role of Borrowers                                                       53 

        Role of Financial Institutions                                          55 

        Role of Securitization                                                  56 

        Role of Mortgage Brokers and Mortgage Underwriters                      57 

             Role of Government and Regulators                                  58 

        Role of Credit Rating Agencies                                          58 

        Role of Central Banks                                                   59 


IMPACT OF THE CRISIS ON THE U.S.A.: Entering A Possible Recession               61

        Collapsing US Housing markets                                           63 

        Unemployment                                                            68 

        Fed rate cut                                                            69 

        Inflation                                                               70      

        Falling dollar                                                          71 

        Widening fiscal deficit                                                 75 

        US GDP growth                                                           77 


IMPACT OF THE CRISIS ON THE WORLD FINANCIAL MARKETS                             78

        Impact on the Commodities Markets: Markets pivot on its head            82 

                Gold Markets                                                    83 

                Crude Oil                                                       85 

                Metals                                                          86 

        On Stock Markets: Gravity proves itself                                 87 

        On Some of the Larger Economies: Euro and Japanese                      91 


                                                                                      6 
 
IMPACT ON INDIA                                                                                   96

         The First Signs: First Blood                                                            98 

         On Financial Markets: Stock Markets lose their Sheen                                      100 

         On Commodities markets with special emphasis on Crude oil: A fuel to inflation  102 

         On Money Markets and Interest Rates: The Hinges of Growth                                 104 

         On INR: Challenging the might of the Dollar                                               107 

         Indian Housing Markets: Following the Footsteps                                           109 

         On Indian Economy: Structural Changes: The proverbial struggle of Good vs. Bad  112 


THE NEW WORLD ORDER: Rise Of the Behemoth                                                        114             


APPENDIX

         Appendix 1:   Borrowers Protection Act 2007                                                118 

         Appendix 2:    Beige Book                                                                  125      

         Appendix 3:   Fico Scores                                                               127 

         Appendix 4:   Role of Freddie Mac and Fannie Mae                                        129 

         Appendix 5:   Housing Market Correction & Bursting of Housing Bubble                    131         

         Appendix 6:   Asian Currency Crisis                                                     131 

         Appendix 7:   Russian debt Crisis                                                       132 

         Appendix 8:   Long‐Term Capital Management                                              133 

         Appendix 9:   Relation between Crude Oil & Dollar Value                                 134 

         Appendix 10:   Relation between Gold Prices & Dollar Value                              136         

         Appendix 11:   Relation between Crude Oil & Gold Prices                                 138         

         Appendix 12:   Theory of Decoupling                                                     140 

GLOSSARY                                                                                         141 

BIBLIOGRAPHY                                                                                       143 

                                                                                                           7 
 
TABLE OF FIGURES AND ILLUSTRATIONS  
    Figure 1:       Housing Sector creates a vicious circle                                             14 

    Figure 2:     Real Median Household Income                                                          17 

    Figure 3:      Homeownership trends in USA (in '000)                                                18 

    Figure 4:      Mechanism of Securitization                                                          25 

    Figure 5:     Timeline of Implosion                                                                 34 

    Figure 6:     US Foreclosure Filings                                                                55 

    Figure 7:     Home Ownerships in US                                                                 57 

    Figure 8:     Relative Size of Variable Interest Rate Mortgages                                    65 

    Figure 9:     Home Price Indices                                                                    65 

    Figure 10:   Foreclosure starts rate                                                                66 

    Figure 11:   Unemployment in USA                                                                    68 

    Figure 12:   Fed Rate cuts in US                                                                    69 

    Figure 13:   Inflation Rate in USA                                                                  70 

    Figure 14:    USD vs. Euro (Interbank Rate)                                                         72 

    Figure 15:   USD vs. JPY (Interbank Rate)                                                           73 

    Figure 16:   U.S. Treasury Yield Curve Rate                                                           73 

    Figure 17:   Federal Fiscal Position                                                               75 

    Figure 18:   US Economic Growth                                                                     77 

    Figure 19:   World Economic Growth                                                                  79 

    Figure 20:   Growth figures forecasted by IMF                                                       80 

    Figure 21:   Commodity Prices across the world                                                      82 

    Figure 22:   Gold Prices in USD/Ounces                                                              83 

    Figure 23:   Oil Prices in USD/Barrel                                                               85 

    Figure 24:   Base Metal Indices                                                                     86 

                                                                                                                8 
 
Figure 25:   Major stock market indices                                                   87 

    Figure 26:   Dow Jones Index                                                              88 

    Figure 27:   NASDAQ Index                                                                 89 

    Figure 28:   Nikkei 225 Index                                                             89 

    Figure 29:   DAX Index                                                                    90 

    Figure 30:   Main developments in major industrialized economies                          91 

    Figure 31:   BSE Sensex                                                                    100 

    Figure 32:   Nifty Index                                                                   100 

    Figure 33:   Bank Nifty                                                                    101 

    Figure 34:   CRR (Cash Reserve Ratio)                                                      104 

    Figure 35:   Call Money Borrowing                                                          105 

    Figure 36:   INR vs. USD                                                                   107 

    Figure 37:   Percentage Distribution of GDP as per sectors                                 112 

TABLE OF BOXES  

    Box 1:        Mechanism of Leveraging                                                      26 

    Box 2:        Types of Borrowers                                                         54 

    Box 3:        Predatory Lending Practices                                                57 

    Box 4:        Potential Subprime Losses                                                    61 

    Box 5:        Main Credit Losses so Far                                                  62 

    Box 6:        Projected Economic Losses                                                    67 

    Box 7:        Major Market Falls in January 2008                                           87 

    Box 8:        House Price Developments In Central & Eastern European Countries 93 

    Box 9:        Indian Companies with Foreign Losses                                         98   

    Box 10:          Market Intervention by RBI                                               108 


                                                                                                       9 
 
ABSTRACT

The U.S. economy has over the past few decades enjoyed the status of being a financial
superpower. The housing sector was booming as more and more people were eager to fulfill the
‘American Dream’ of owning a home. The spiraling housing prices enticed the people to buy
homes with initial borrowing and lending rates that were extremely low; which helped to boost
the demand and supply of new and existing houses. The liquidity of the banks, eagerness of
borrowers to own a house and an inefficiently created structure of financial products lead to the
subprime debacle.

The financial systems were overflowing with liquidity, which made them construct a mechanism
of securitization that involved pooling of the loans and creating Collateralized Debt Obligations
(CDO) and Mortgage Backed Securities (MBS). The low-income borrowers were enticed by the
various types of mortgages such as Adjustable Rate Mortgages, Interest Only Mortgages (I/O)
etc. The borrowers readily accepted these loans as these short-term low rates reduced the burden
of the borrowers. All sorts of people with or without any income proof or documentation availed
of these loans. The pools of these debts were smartly issued to investors depending on the risk
attached to the instruments.

The housing market correction and bursting of the housing market bubble overturned the whole
scenario. This increased the delinquency rates and the number of foreclosures filings were
surging. To make matters worse, the increased unsold inventory further reduced the prices
making it difficult for the financial institutions to sell them and recover their loans. Due to the
complexity, sheer size and volume, presence of numerous players and major flaws in the
subprime lending the whole U.S. economic system now stands at the verge of a possible
collapse. The U.S. economy is witnessing a decline in the growth figures. The unemployment
rates are rising further aggravating the inflation numbers. The strengthening Euro and Yen stand
as evidence that the U.S. economy is in a downturn.

The effects from the possible recession in the U.S. and the reading of a world wide spread of the
‘economic fever’ has made the commodities prices to increase and for the capital markets to
tumble. Widespread losses across the markets have brought economies to reassess their exposure
to the U.S. economy and Central banks of these countries have taken steps (both reactive and
pre-emptive) to control any major contagion.

The Indian economy/markets may be comparatively safe due to the strict regulations of the RBI.
Even then, in the world of gross inter-linkages the chances of the system getting singed cannot
be ignored. The exposure of our economy to the U.S. markets may be limited; even then the
indirect impacts cannot be ignored. The study would then try to analyze the impacts both direct
and indirect on the Indian financial systems.


                                                                                                10 
 
INTRODUCTION

The whole world being linked with the common ties of globalization has necessitated the study
of the turbulence in the U.S. economy and its impacts on the world with special relevance to the
Indian economy. The subprime crisis and its effects on the U.S. economy and the world
economies have been studied in detail moving onto the Indian economy.


PURPOSE OF THE STUDY

The main objective of the study is to have:

    •   An understanding of the ongoing Sub-prime crisis
    •   The impact on Financial Markets, Commodities Markets (Crude Oil), Money Market of
        our country
    •   Study its impact on U.S.A, developed economies and the Indian Economy.
    •   Future implications on the World Economic system in general.
    •   Study the possible impact it may have on India.
    •   Expected changes to the Indian Economy post Subprime Crisis


The world economies are at present passing through one of the most difficult phases in recent
times. The sub-prime crisis, which has its roots in the U.S., threatens to rage onto the other
developed economies eventually to scathe the emerging market economies in wake. Sitting in
India, we may appear, at present, seem to be unaffected by the world economic problems.
Statements by heads of important agencies have time and again impressed that the Indian
economy has a very little exposure to the subprime and that, aside from scratches, the economy,
in general, would walk tall.


However, in spite of the Indian economic systems seemingly direct insulation from the impacts,
the fact remains that in the world of integrated economic systems, the U.S. recession is bound to
test the resilience of the domestic economy. Already the stock markets, which seem to have the
maximum exposure, have entered into a highly unpredictable and volatile state. The domino
effect on the other sectors would take some more time to incident.


                                                                                              11 
 
SCOPE OF THE STUDY

The project involves studying the subprime crisis as a whole. The main topics under this project
are - Housing markets in the U.S.A, Leveraged Security Market & the Process of Subprime
Lending. A study of the chronology of events will also be made to ascertain its incidence and the
way it turned into a huge crisis engulfing the global economies. The project will also involve
studying the parties in the crisis such as borrowers, lenders, banks etc. and their role.

After having an insight of all this the project shall move on to the impact and implications on
U.S., some leading world economies and finally India. This will include studying:

           •   The Commodities Market with special emphasis on the Crude oil market and how
               it effects inflation.
           •   The Stock Markets of the world
           •   Overall effect of subprime crisis on the money markets and interest rates in India.
           •   Changes in forex rate of INR and the U.S.D.
           •   The Structural Changes of Indian economy posed by the subprime crisis will also
               be done.


LIMITATIONS OF THE STUDY

       Subprime crisis and the fallouts to the economy thereof is a very expansive area that has
       gripped the biggest economy of the world. No matter how deep one goes into it, the
       chances of understanding it to the core may be difficult.
       The study would also not include aspects that are topical to U.S.A and would include
       only those that are relevant in the Indian context or, which may have a bearing on India.
       Due to the ‘lag effect’ all the resultants may not manifest itself at the time of the study, so
       while a theoretical study may be made, a comparison of the actual results may leave a lot
       wanting.


                                                                                                   12 
 
METHODOLOGY

The methodology comprises an in-depth search of various news articles, journals, reports,
relevant laws and other literary work on this topic.

      The report involves an analysis of the latest movements in the U.S. and the Indian
      Financial Markets.
      A search on the internet and books is another aid to the successful completion.
      A systematic approach has been followed which involves concentrating on the lowest
      level accentuating the role of various parties who were party to the entire debacle. The
      next level of the study involved studying the timeline of how it transformed into such a
      huge problem. The impact of U.S. economy, then the inter-related world economies is the
      next step under the study.
      Finally the subprime crisis spreading its wings to the Indian Economy will be studied.


                                                                                           13 
 
INTRODUCTION
     “What began as a fairly contained deterioration in portions of the U.S. sub-prime market has
    metastasized into severe dislocations in broader credit and funding markets that now pose risks
                   to the macroeconomic outlook in the United States and globally”

                                               Global Financial Stability Report, IMF, April 2008.

The recent turmoil that has inflicted the world economies is the sub-prime crisis. Related to the
housing prices and engulfing the entire banking system of the U.S. economy, this crisis has
spread its wings to encompass the worldwide economies in its realm translating it into a major
financial crisis. The impact of this crisis has been so severe that the entire banking system of the
world’s largest economy may collapse, leaving little scope for recuperations out of this crisis.
The fact that the housing crisis has led to the present imbroglio is obviously undeniable.

Introduction

The outburst of the crisis after the bursting of the housing bubble in the U.S. has made this
economy confront a new crisis with differently fabricated causes and effects. The high default
rates on “sub-prime” and other higher-risk borrowers with lower income have resulted in the
sub-prime crisis. Initially, the long term rising house prices and the attractive loan incentives
encouraged borrowers to assume mortgages with the fact that they shall be able to refinance later
on. However, the situation reversed when the housing prices started to drop in 2006-2007 in
many parts of the U.S. making it difficult
to refinance the loans. This all resulted in
a vicious circle as the number of
foreclosures increased, the housing
inventory escalated depressing the house
prices (figure 1).

Being inter-related to other sectors of the
economy, these trends have lead to a
contraction in the construction industry,
hurting overall U.S. economic activities
making it enter into a possible recession.
The problem of grave concern is the
falling home prices leading to a credit
crunch, which is actually driving up             Figure 0: Housing Sector creates a vicious circle


                                                                                                 14 
 
mortgage rates and making mortgages unavailable, leading to a further decline in home prices.

The whole carnage revolves around sub-prime lending by financial institutions. These
institutions being accompanied by other parties such as Credit Rating Agencies, Mortgage
Brokers and Underwriters etc. created a complex structure of lending and borrowing process,
through the process of securitization. Being unified with common ties of globalization this
American fiasco soon turned into a worldwide crisis affecting the major economies of the world.

This project studies the entire housing sector, which saw great heights and steep depths within a
very short period of time. How the booming housing sector, which was a major asset of the
weakest people of the society through innovative instruments and loans facilitated by various
parties, saw its downfall is an interesting part, which is analyzed. Being one of the pillars of the
American economy, how the movement in this pillar affected the whole economy inter-linked in
various dimensions of employment, finances, and other macro-economic indicators (inflation,
currency etc) has been thoroughly done. The world bonded by the Theory of Decoupling has
seen new changes in growth brackets, trade movements and other global changes throughout this
period.

Being an emerging economy, the Indian economy has also seen new pursuits in its economic
framework and there still remain unknown pursuits and dimensions connected to the global
economic architecture.

This project thus has various pursuits to explore about the American economy, world economies
and Indian economy. There is a whole gamut of linkages between, inter-related and intra-related
sectors, which have been studied in this project.


                                                                                                 15 
 
HOUSING MARKETS IN U.S.A
                                  Major Contributors to Growth


The real estate sector is amongst the largest sectors in the U.S.A. It has been a significant
contributor to the U.S. economy, providing millions of jobs and had been generating hundreds of
millions of dollars of economic output each year. It has traditionally been an important source of
wealth building. The housing sector has been the main driver of economic growth of U.S.
Therefore the weakening of this sector tends to have ominous implications for continuing
expansion in the period ahead.

The housing sector accounts for about 6% of GDP, but has been a much more important
component of growth, contributing 0.50% directly to GDP growth (translating to some U.S. $60
billion/year) and on the average adding 30,000 new jobs monthly in 2005. Some estimates
suggested that wealth (home prices) and liquidity (home equity extraction) effects might have
been contributing up to 1.5% to GDP growth in the last few years. Over the past four years
ending 2006, consumer spending and residential construction together have been accounting for
90% of the total growth in GDP. And over two-fifths of all private sector jobs created since 2001
till the advent of crisis have been in housing-related sectors, such as construction, real estate and
mortgage broking.


Homeownership – The American Dream

Housing (or an availability of dwelling) is one of the most important wants of any human. As the
society and civilizations progressed, so did the desire to have a comfortable home. This desire
cuts across all the income segments, race, and income levels. However, the common
denominator remained – owning a house (see chart below).
Two reasons why there was a housing boom was
    - Increased level of income and
    - Easy availability of money.

Increased level of income
Since 1967, the median household income in the United States had risen by 31%. The rise in
household income has been largely the result of an increase in personal income among college
graduates, a group that had doubled in size since the 1960s, and women entering the labor force.
Today, 42% of all households have two income earners.


                                                                                                  16 
 
Overall, the median household income rose from $33,338 in 1967 to an all-time high of $44,922
in 1999, and has since decreased slightly to $43,318. Decreases in household income have been
visible during each recession, while increases have been visible during economic upturns.

While per-capita, disposable income had increased 469% since 1972, it had only increased
moderately when inflation is considered. In 1972, disposable personal income has been
determined to be $4,129; $19,385 in 2005 dollars. In 2005, disposable personal income was,
however, $27,640, a 43% increase. Since the late 1990s, household income had fallen slightly.


                           Figure 1: Real Median Household Income

Further with the advent of complex financial systems, conduits, mechanisms and tools it
suddenly became easier to own a house. 67.5% of households realized this dream in 2001, which
translated into 72.6 million households as homeowners.

Since then, the Bureau of the Census had projected an additional 11.7 million new households
will form over the coming decade, with the larger percentage growth among minorities. The
demand for housing, therefore, will continue to over the next decade. Freddie Mac estimated that
50 million families will be buying homes in the next 10 years - more than 10 million of them for
the first time. Clearly, a substantial segment of society is and will continue to realize the
American Dream. Of course this was before the Sub-prime crisis roared its head.


                                                                                             17 
 
140000


                                                                                                                                                                                                                                                           127,958
                                                                                                                                                                                                                                                 126,009
                                                                                                                                                                                                                                       123,926
                                                                                                                                                                                               121,478


                                                                                                                                                                                                                   120,835
                       Vacant Total


                                                                                                                                                                                                                             122,187
                                                                                                                                                                                     119,628
                                                                                                                                                                           119,043


                                                                                                                                                                                                         119,280
                                                                                                                                                                 117,280
                       Renter Total


                                                                                                                                                       115,620
                                                                                                                                   112,655

                                                                                                                                             114,137
                                                                                                                         110,948
                       Owner Total


                                                                                                               109,716
                                                                                106,281


                                                                                                    108,317
                                                                                          107,277
                                                                      105,731


                                                                                                                                                                                                                                                           17,652
                        104,631


                                                                                                                                                                                                                                                 16,437
    120000


                                                                                                                                                                                                                                       15,695
                                                     11,633 103,653


                                                                                                                                                                                               14,468


                                                                                                                                                                                                                             15,598
                                           101,102


                                                                                                                                                                                     13,908


                                                                                                                                                                                                                   15,276
                                                                                                                                                                                                          14,315
                                                                                                                                                                           14,114
                                                                                                                                                                 13,747
                                  99,307


                                                                                                                                                       13,418
                                                                                                                                             13,153
                                                                                                                                   12,669
              95,255


                                                                                                                         12,258
                                                                                                              11,987
                                                                                                    11,925
                                                                                          12,024
                                                                                12,058
                                                                      12,241
                        9,448


                                           10,585
                                  10,164
    100000
              8,908


                                                                                                                                                                                                                                                 34,194

                                                                                                                                                                                                                                                           35,147
                                                                                                                                                                                                                                       33,678
                                                                                                                                                                                                                             33,014
                                                                                                                                                                                               34,417


                                                                                                                                                                                                                   33,506
                                                                                                                                                                                                          33,687
                                                                                                                                                                                     34,470
                                                                                                                                                                           34,831
     80000


                                                                                                                                                                 34,896
                                                                                                                                                       35,059
                                                                                                                                             34,943
                                                                                                                                   35,246
                        31,731


                                                                                                                         35,559
                                                                                                              34,730
                                                                                                    34,569
                                                                                          34,243
                                                                                33,975
                                                                      33,735
                                                     33,320
                                           32,602
                                  32,299
              30,695


     60000


     40000


     20000
              55,652

                        63,452

                                  56,844

                                           57,915

                                                     58,700

                                                                      59,755

                                                                                60,248

                                                                                          61,010

                                                                                                    61,823

                                                                                                              62,999

                                                                                                                         63,131

                                                                                                                                   64,740

                                                                                                                                             66,041

                                                                                                                                                       67,143

                                                                                                                                                                 68,637

                                                                                                                                                                           70,098

                                                                                                                                                                                     71,250

                                                                                                                                                                                               72,593

                                                                                                                                                                                                          71,278

                                                                                                                                                                                                                   72,053

                                                                                                                                                                                                                             73,575

                                                                                                                                                                                                                                       74,553

                                                                                                                                                                                                                                                 75,378

                                                                                                                                                                                                                                                           75,159
        0
             1984 1985 1986 1987 1988 1989 1990 1991 1992 1993 1994 1995 1996 1997 1998 1999 2000 2001 2002 2003 2004 2005 2006 2006


                                                                                Figure 2: Homeownership trends in U.S.A (in '000)

Easy Availability of Money
The most prominent reason for the housing boom was the easy availability of money. After the
dotcom bubble the Federal Reserve Bank had decreased the Fed fund rate 14 times from 6.5% to
1% within two years since 2001. This had increased the liquidity in the market. As a result of this
overflowing liquidity in the financial markets, the banks offered loans to borrowers thus making
money easily accessible to even the low-income borrowers. This also marked the period of the
housing boom.


Economic Impacts of the Housing Sector

Housing sector being a major contributor to the American growth, any shudder in this sector can
engulf the whole economy. And, if it is the American economy, un doubtingly the tremors have
to reach across the globe. The following facts help U.S. to understand the contributions of the
Housing industry to the economic growth of U.S.A.

             The housing sector contributed about 14 percent to the nation’s total production.
             Home equity constituted the largest share of household net worth.
             The stock of fixed residential assets was worth nearly $10 trillion – equivalent to one-
             year worth of U.S. GDP.

                                                                                                                                                                                                                                                            18 
 
About 1.5 million newly housing units were started each year. Housing starts have been
              one of the key factors in the macroeconomic business cycle.
              About 40 percent of monthly consumer expenditures were housing related.
              More than $1 trillion exchanged hands from the sale of existing and new homes.
              There were 288,273 establishments categorized as “real estate & rental & leasing with
              over 1.7 million paid employees.
              40% of the employment growth in the entire economic expansion was a result of soaring
              home sales and prices. This included employment in home building directly as well as in
              ancillary factors such as supplies, real estate agents, appraisers, title searches and
              mortgage servicing.

Thus the housing sector has been one of the main sectors, which contribute both directly
and indirectly to economic activity in the U.S.A.

The two line items in GDP directly associated with the housing sector are residential fixed
investment1 consisting of value-put-in-place of new housing units, production of mobile homes,
brokers’ commissions on the sale of existing residential properties, expenditures related to
improving and additions to existing units, and net purchases of used structures from government
agencies and housing service for personal consumption expenditures, purchased by residents in
the United States, in the form of rent for tenants or as rental equivalence for homeowners. In
2000, residential fixed investment totaled $415 billion and housing service expenditure was $956
billion. The combined total of $1.37 trillion represented 14 percent of GDP.

Also, all economic activities produced a “Keynesian” multiplier effect. A home purchase usually
resulted in further spending in other sectors of the economy (landscaping, appliances, and so on).
The income earned by the landscapers was re-circulated into the economy as they spend,
generating another round of income and purchases. The degree of multiplier depends on the
degree of monetary policy accommodation and the “crowding out” effect. The multiplier was
between 1.34 and 1.62 in the first year or two after an autonomous increase in spending. This
meant that for each dollar increase in direct housing activity would increase the overall GDP by
$1.34 to $1.62.

Many people’s livelihoods depended on real estate. The February 2001 report showed that 1.49
million workers were employed in the real estate industry. The Real Estate and Rental and
Leasing sector, which comprises establishments primarily engaged in renting, leasing, selling,
and buying real estate for others, and appraising real estate, totaled 288,273 establishments with
1.7 million paid employees. The annual payroll amounted to $41.6 billion.

Housing Sector Having Macro-economic Implication
                                                            
1
  Consists of purchases of private residential structures and residential equipment that is owned by landlords and
rented to tenants. From www.bea.gov

                                                                                                                     19 
 
In addition to its direct contribution to GDP, the housing sector has been playing an important
role in the overall direction of the nation’s economy over the course of macroeconomic business
cycles. Conversely, housing starts have made just as dramatic a change, coming out of a
recession. In fact, housing starts lead the rest of the economy preceding changes in GDP. In
other words, disruptions to the housing sector (arising from policy changes) are likely to be
followed by a significant macroeconomic slowdown, while a stimulus to housing can lead the
rest of the economy out of a slowdown.

During an economic slowdown, the Federal Reserve has been lowering the interest rates, other
things equal. Consequently, the fall in interest rates during an economic slowdown has been
acting as a strong buffer often providing a stimulus to the interest-sensitive housing sector. A
drop in mortgage rates means lower monthly mortgage payments. This, in turn, means a lower
qualifying income necessary to purchase a home. Conservatively, a one percentage drop in
mortgage rates has translated into roughly 3 million additional households who would have the
necessary income to qualify for a mortgage for purchasing a median priced home. Furthermore,
many homeowners have refinanced their mortgages with the falling interest rates, leaving
additional spending money to counter economic downturns. The economic slowdown from the
mid-2000 to 2001 is a prime example of how this scenario is being played out. Housing starts
and home sales began declining in spring of 2000 as the Fed has raised interest rates to cool the
exceptionally fast growing economy. However, the economy has cooled much more drastically
than desired and the Fed began reversing the interest rate policy by cutting the rates in early
2001. The subsequent falling interest rates have kept the housing starts and home sales to
rebound to healthy levels even as the overall economy began sinking further. The economy
would have undoubtedly tipped into a recession in early 2001 without the support of the housing
sector during this period.

Impact on Communities

Construction of new homes provided jobs and higher tax revenues for local, state, and federal
governments. Construction of each new single-family home required 1,591 worker-hours or the
equivalent of 0.869 year of full-time labor. Each multifamily unit required 0.402 year of full-
time labor. Projecting these estimates and accounting for productivity and price changes over the
years, it is was estimated that the construction of 1,000 single-family homes generated 2,448
full-time jobs in construction and construction-related industries, $79.4 million in wages, and
$42.5 million in combined federal, state and local revenues and fees. The construction of 1,000
multifamily units is estimated to have generated 1,030 full-time jobs in construction and
construction-related industries, $33.5 million in wages; and $17.8 million in combined federal,
state and local tax revenues and fees. Furthermore roughly 30 percent of the new home
occupant’s income was spent on items produced by local businesses, such as hospitals, daycare
centers, dry cleaners, and auto repair shops.


                                                                                              20 
 
Almost 70 percent of all tax revenues raised by local governments in the United States came
from property taxes. Homeowners contributed about 43 percent of property taxes, while
commercial property accounted for 57 percent of real property tax revenues. Construction of new
homes expanded the tax base and so increased the property tax revenues. using the average sales
price of new homes in 2000, the local tax revenue base will increase by $185 billion.

Aside from tax revenue to local communities, home production and subsequent homeownership
provided additional intangible values. Homeowners did not move as frequently as renters,
providing a source of neighborhood stability. Neighborhood stability in turn conferred benefits
of higher social and community involvement such as crime prevention programs. Homeowners
had a stake in their neighborhoods and communities, and so were likely to behave in ways that
provided benefit to everyone in the community. Owners maintain their properties in better
condition than do renters of comparable housing. Such behavioral differences had been observed
regardless of the age or income of homeowners. All of these social benefits to homeownership
can impact property values.

Impact on Individuals

Homeownership also provided individuals with a way to accumulate wealth for the future while
benefiting from the provision of shelter. A tabulation of household wealth from the Federal
Reserve’s Survey of Consumer Finances (1998) shows that home equity (the value of the home
net of mortgages) was the largest component of total wealth. Equity in primary residences
accounted for 28% of the total family asset. Furthermore, the survey shows that 12.8% of
families had some form of residential real estate in addition to primary residence (second homes,
time shares, and other type of residential property), an increase from 11.8% in 1995. The value
of the asset in other residential property accounted for additional 5% of the total household asset.
Retirement accounts were the largest financial assets outside of primary residence, with 19.8% of
the total. Only for the very wealthy (income over $100,000 per year) did the home equity portion
of wealth fall below 50% of the total household wealth.

A separate survey from the Census Bureau also shows the dominant importance of home equity
in determining household net worth. The Survey of Income and Program Participation
periodically collects detailed wealth and asset data as a supplement to its core questions about
labor force participation, income, demographic characteristics, and program participation. In
1995, median household net worth was $40,200; Median home equity for home-owning
households was $50,000. Home equity constituted the largest share of household net worth,
accounting for 44 percent of total net worth.

A privately owned home, therefore, was an important vehicle for wealth accumulation for a large
segment of society. In addition, home investment played an important role in portfolio
diversification. Home prices in the U.S., on average, have risen steadily, and have much lower

                                                                                                 21 
 
volatility than stock or bond prices. The historically standard deviation for stocks and bonds had
been 20% and 9%, respectively. For housing, the standard deviation was about 4%. Furthermore,
the correlation between home prices with stock or bond prices was very low. Homeowners were
also benefited from the easy availability of home equity loans. Whether as a readily available
source of funds, or just the security of a credit source, certainly added value to homeownership.

Housing Contribution to Society

Although the level and benefits of community involvement are hard to measure, several
researchers have found that homeowners tend to be more involved in their communities and local
governments then renters. For instance, owners participated in a greater number of non-
professional organizations and had higher voter participation rates. In addition to higher civic
participation, owners also tend to remain in their homes longer, adding stability and familiarity to
the neighborhood, and also tend to spend more time and money maintaining their residence.

Home equity is one of the largest sources of collateral for bank loans to start new businesses.
Over 740,000 businesses in 1992 reported a mortgage or home equity loan as a source of start-up
capital for their business. It had been estimated in the UK that a 10 percent rise in the aggregate
value of home equity increases the number of new business registration by 5 percent.

Furthermore, people want to be homeowners. Fifty eight percent of the renters responded that
owning a home is either the top or very important priority according to 2000 Fannie Mae’s
National Housing Survey. Freedom to alter their homes or engaging in home maintenance and
improving may provide intrinsic joys.

Furthermore, others have noted that the home buying process and homeownership improve self-
efficacy or a person’s sense of control over life events. And from extensive psychological studies
self-efficacy is associated with better health status.

Whether it be America’s dream or an economic indicator of growth or a tool for changing the
course of Macro-economic policies, the American Housing Market was such an important sector
that any vibrations in the housing led banking mechanism could lead to a shake up in the entire
world economies. The highly leveraged market and the whole dream of owning homes turned
into a huge debacle. Economists call it bursting of the housing “bubble.” In the following pages
we have tried to present the build-up of this bubble, the dynamism of the leveraged security
markets, the role of parties in this crisis and the likely impact on the U.S. and other economies of
the world.


                                                                                                 22 
 
LEVERAGED SECURITY MARKETS
                                    The Double Edged Sword

“…but in the modern fixed-income markets - where leverage is king and cheap credit is only the
              current jester - a move of that magnitude can do a lot of damage.”

                                      -Ryan Barnes, The Fuel That Fed The Sub-prime Meltdown.


Leveraging

The leveraging procedure, which intended to multiply the investments, opened new horizons for
banks to offer the investors with innovatively designed debt instruments i.e. mortgage-backed
securities (MBS), and collateralized debt obligations (CDO).

Leveraging is borrowing to invest. Financial leverage takes the form of a loan or other
borrowings (debt), the proceeds of which are reinvested with the intent to earn a greater rate of
return than the cost of borrowing. The most familiar use of leverage is using a mortgage to buy a
home. In return for a down payment one receives funds to purchase an asset that would
otherwise be too expensive. The homeowners either try to pay out the money from the rent that
would be saved or from the income streams (the rent earned) that their vocations generate.

Leveraging helps both the investor and the firm to invest or operate. While leverage can play a
positive role in the financial system, problems can arise when financial institutions go too far in
extending credit to their customers and counter parties. If an investor uses leverage to make an
investment and the investment moves against the investor, his or her loss is much greater than it
would've been if the investment had not been leveraged - leverage magnifies both gains and
losses. In the business world, a company can use leverage to try to generate shareholder wealth,
but if it fails to do so, the interest expense and credit risk of default destroys shareholder value.

The build-up of the sub-prime crisis is based on the mechanism of leveraging. The layer upon
layer of leverage that propelled the expansion is now operating in reverse as the leverage is being
unwound.

Housing Sector: The Initial Fuel

Housing sector has been one of the prominent drivers of the U.S. economy. Not only has it made
contributions to the employment, production and GDP, it has also been a major stimulus for the
overall economic growth of this huge economy leading the global world. This sector has


                                                                                                  23 
 
important linkages to every macroeconomic aggregate like GNP, savings, interest and inflation
rate and also highlights its importance in public policy decisions. The American Financial
Institutions being over-flooded with liquidity magnified the housing sector as a lucrative area.
The leveraging mechanism with its off springs i.e. Mortgage-Backed Securities (MBS) and
Collateralized Debt Obligations (CDO) generated great opportunities for even those who could
not afford to pay the cash flow mandated as among the key requirements for taking loans.

These sophisticated instruments, lackadaisical approach to adherence to prudent lending policy
and the surplus of funds all contributed to the housing sector becoming the most booming
sectors. As it grew, it took with itself almost the entire economy. Then an asset bubble began to
form, frenzy fed on frenzy and the prices started to soar beyond what can safely be said to be the
fundamentally correct prices. However, perhaps the key reason why the sub-prime crisis
entrenched itself deep into the very sinews of the financial system of the U.S. was the creation of
exotic leveraged instruments. That way banks now started lending more than the actual base
money and that too to entities that had a very high risk-premium attached to it.

Securitization: Prime Mover of the Crisis

Securitization, an innovative form of financial engineering introduced two new instruments i.e.
Mortgage Backed Securities and Collateralized Debt Obligations. Securitization is a structured
finance process in which assets; receivables or financial instruments are acquired, classified into
pools, and offered as collateral for third-party investment. Due to securitization, investor need for
mortgage-backed securities (MBS), and collateralized debt obligations (CDO) as a profitable
venture and the tendency of rating agencies to assign investment-grade ratings to these loans
even though having a high risk of default could be originated, packaged and the risk readily
transferred to others. The process of securitization has been explained with help of figure 4.

Mortgage Backed Securities (MBS) and Collateralized Debt Obligations (CDO’s) the two
instruments of securitization played an important role in aggravating the whole sub-prime saga.

A mortgage-backed security (MBS) is an asset-backed security whose cash flows are backed by
the principal and interest payments of a set of mortgage loans mainly on residential property.
Collateralized debt obligations (CDO’s) are also type of asset-backed security and structured
credit product but they are constructed from a portfolio of fixed-income assets. These assets are
divided into different tranches: senior tranches (rated AAA), mezzanine tranches (AA to BB),
and equity tranches (unrated). Here junior tranches offer higher coupons (interest rates) to
compensate for the added default risk while senior tranches offer the lowest coupon rate offering
highest safety level.


                                                                                                  24 
 
  Figure 3: Mechanism of Securitization


     STEP  1:    The  borrower  obtains  a  loan  from                                                                                     MORTGAGE BROKER
                                                                                                                                 
     the lender with the help of mortgage brokers.
                                                                                                                                 
     After  the  loan  is  made,  the  lender  and  the
                                                                                                                                 
     mortgage  broker  do  not  have  any                                                                                        
     interactions.                                                                                                                                                     1 
                                                                                                                                 
                                                                                                                                                LOAN 
      STEP  2:    The  loan  is  then  sold  to  the  issuer                                                                     
      and the payments made by the borrower are                                                                    LENDER                                                        BORROWER
      provided to the issuer by the servicer.                                                                                    
                                                                                                                                 
                                                                                                                                 
                                                                                                                                           LOAN PROCEEDS 
                                                                                                                                                                                                               
                                                                                                                                                                                                              
                               TRUSTEE
                                                                                                                               
                                                                                                                                                            MONTHLY PAYMENTS 
                          UNDERWRITER
                                                                                                                                 
                                                                                                    LOANS
                                                                                                                                 
                                                                                                                                 
                                                                                                     2                           
                            RATING AGENCY                                                                                    CASH                                      SERVICER
                                                                                                                                 
                                                                                                                                 
          CREDIT ENHANCEMENT PROVIDER                                                                                            


                                                                                                                                                    MONTHLY PAYMENTS 


   STEP  3:  The  loan  is  further  sold  to  the                                                                                                              4 
   investors.  The  issuer  is  assisted  by  the
   trustee,  underwriter,  rating  agency  and
   credit enhancement provider.                                                                                ISSUER


   STEP  4:    The  servicer  acts  as  an
                                                                                           3                      CASH
   intermediary  between  the  borrower  and
   the  issuer,  who  provides  the  payments  to
   the  investors.  The  delinquent  losses  are                                      SECURITIES                                     MONTHLY PAYMENTS 
   managed by the servicer & the trustee.


                                                                                                           INVESTOR


                                                                                                                                                                                                  25 
             
CDO is a corporate entity constructed to hold assets as collateral and to sell packages of cash
flows to investors. There exists a Special Purpose Vehicle (SPV) that acquires a portfolio of
credits. The assets include mortgage-backed securities, high yield corporate loans etc. The SPV
issues different classes of bonds and equity and the proceeds are used to invest in other
portfolios. The bonds and equity are entitled to
the cash flows from the portfolio of, in
accordance with the Priority of Payments. The               MECHANISM OF LEVERAGING 
senior notes are paid from the cash flows before
                                                      Step  #1:  Collateralized  debt  obligations
the mezzanine notes and junior notes. In this         (CDOs)  that  pay  an  interest  rate  over  and
way, losses are first borne by the equity or          above  the  cost  of  borrowing  were
junior notes, next by the mezzanine notes, and        purchased.  In  this instance  'AAA'  rated
finally by the senior notes. In this way, the         tranches  of  subprime,  mortgage‐backed
                                                      securities were used. 
senior notes, mezzanine notes, and equity notes
offer distinctly different combinations of risk       Step  #2:    Leverage  was  used  to  buy  more
and return.                                           CDOs  than  one  could  pay  for  with  capital
                                                         alone.  Because  these  CDOs  paid  an
                                                         interest  rate  over  and  above  the  cost  of
                                                         borrowing,  every  incremental  unit  of
Sub-prime crisis: A result of the Leveraging             leverage  added  to  the  total  expected
                                                         return.  So,  the  more  leverage  one
                                                         employed, the greater the expected return
Sub-prime crisis was the result of the leveraged
                                                         from the trade. 
instruments which were aimed to magnify the
gains but resulted in amplifying the losses.             Step  #3:  Credit  default  swaps  (CDS)  were
                                                         used  as  insurance  against  movements  in
Individuals who were not able to finance the             the  credit  market.  Because  the  use  of
house completely would get the help of banks.            leverage  increased  the  portfolio's  overall
People would put down a deposit and take out a           risk  exposure,  the  next  step  involved
                                                         purchasing  insurance  on  movements  in
loan for the rest. Let’s say an investor puts
                                                         credit  markets.  These  "insurance"
down $20,000 on a $200,000 house, borrowing              instruments  called  credit  default  swaps,
the remaining $180,000. He now has a                     were designed to profit during times when
leveraged ‘investment’ - with a gearing factor of        credit concerns caused the bonds to fall in
10.                                                      value,  effectively  hedging  away  some  of
                                                         the risk. 
If house prices go up by 50% - i.e. the house
                                                         Step  #4:  The  money  thus  rolled  in.  When
becomes worth $300,000 - he doesn’t just make            the cost of the leverage (or debt) is net out
50% of the initial investment: he makes 150%             to  purchase  the  'AAA'  rated  subprime
profit (once he sells, that is, and not counting         debt,  as  well  as  the  cost  of  the  credit
mortgage interest payments, solicitors’ fees and         insurance, one is left with a positive rate of
so on). Conversely, if house prices drop by just         return,  which  is  often  referred  to  as
                                                         "positive carry" in hedge fund lingo.  
10%, his entire deposit would be wiped out.
And if prices drop further, the borrower will be             Box 0: Mechanism of Leveraging

                                                                                                           26 
 
in negative equity, owing the bank more than the current value of their house.

Enticed by the high returns on the ever-appreciating value of housing many investment banks,
hedge funds and other institutional investors have done so, making phenomenally good returns
over the five years starting year 2000.

Then the worst that was feared occurred- these leveraged investments started to go awry. Instead
of profits, many investors have been hit by significant losses.

In the above example where the individual had put down $20,000 and took a debt of $180,000,
as long as he sells before the value of the asset becomes less than the value of the debt, there
isn’t any problem. Till the time it is secured on an asset that’s worth at least $180,000 the actual
risk is just $20,000. But what if the investor can’t set a stop-loss (as is usually the case- since the
house is not just for investment purpose but is actually an asset purchased to reside). Suddenly
there’s no market for what his trying to sell or if everyone is so scared that nobody wants to put a
price on what his selling, for fear that it’s too low and will in turn cause them to lose vast
amounts of money too, because they hold similar investments.

Not long ago frenzy fed on frenzy and buoyed the prices up and now frenzy feeds on frenzy and
pulling the prices down rather dramatically.

Now here stands the trouble of the leveraged market. Because the leveraging factor was much
higher than what the system could withstand, and because the sub-prime ‘network’ was ingrained
in almost the entire financial systems of the U.S., when the debacle happened, it simply
collapsed the whole system.

The leveraging that helped the sector grow and propel the economy to boom is now dragging the
same down. In the previous chapter we had covered the importance of the Housing sector. The
effect of this importance can be gauged by a simple fact – Housing sector bust is dragging the
entire U.S. economy to recession. And no matter what levels of fire-fighting that the monetary
authorities undertake, the chances are that the U.S. economy has been dealt a major blow and it
would take some serious and coordinated efforts to sail the boat through.

That is where the U.S. economy stands today. Efforts range from prudent (cutting interest rates)
to near desperate (lending money to commercial banks taking the tainted mortgage-backed
securities as collateral) steps. The hope is that by accepting these investments at face value
central banks will release the credit blockage and get the U.S. economy moving again.

Due to the high amount of liquidity, which was somehow to be put into use, leverage was needed
to boost returns over the last few years, owing to a lack of distressed debt. This led to 7 times


                                                                                                    27 
 
(and sometimes as much as 10 times) leverage on U.S. leveraged buyouts. In Europe, debt
multiples also were stretched, with leverage of 5.5 times in 2007, versus 4.7 times in 1998.

Thus leveraging which was intended to increase the returns and provide shelter to the people of
U.S. plunged economy downwards and contributed to the chronicle of Sub-prime Crisis.

In the global economy, effects in one area of investment quickly spread to others. So when
institutional investors started losing money on collateralized debt obligations (CDO’s) and
residential mortgage-backed securities (RMBS’s) because of the U.S. sub-prime crisis, they
quickly liquidized other investments in order to cover their losses.

For example, some of them shifted cash out of the carry trade (in which money borrowed in low-
interest currencies such as the Yen is invested in higher interest currencies such as the Pound),
causing the Yen to rapidly appreciate and leading to a whole slew of currency investors losing
money on their leveraged positions. These currency investors in turn had to find the money to
cover their losses, perhaps by selling gold, temporarily shifting the gold price downwards and
causing a tranche of leveraged gold investors to face severe losses. And so it went on, and
continues to go on.

The total amount of leveraged investment in the world is unknown, but it has been estimated to
be many multiples of global GDP.

Thus leveraging was a double-edged sword, which was aimed at multiplying the profits, but if it
acted reversely, the losses would magnify much more than the expected profits. Perhaps, that is
what happened in the U.S. economy, where the reverse took place and brought the world at the
verge of this crisis. The tool of leveraging mechanism i.e. the sub-prime lending provides U.S. an
insight of how the construct of the sub-prime crisis took place.


                                                                                               28 
 
SUB PRIME LENDING
                                           The Flaws


The financial institutions overflowing with liquidity devised the securitization mechanism for
which they classified the lending into three categories namely, The Prime category, the Alt-A
category and Sub-prime category. The parameters of categorizing the credit seekers were:
    1. Credit worthiness and documentation prudence
    2. Ability to pay back the money
    3. Ability to pay down payments
    4. Whether it’s a first loan or an already mortgaged asset.

While the prime category of borrowers fulfilled all the parameters, the sub-prime borrowers
stood at fulfilling none. Alt-A borrowers mainly were short of documentation, including proof of
income. Yet these borrowers had clean histories they either had higher loan-to-value or debt-to-
income ratios.

Sub-prime lending (also known as B-paper, near-prime, or second chance lending) is lending at a
higher rate than the prime rate. A higher rate of interest is charged due to limited or tarnished
credit history or inadequate documentation, higher loan-to-value and debt-to-income ratios.
However, with the higher rates comes additional risk for lenders because there is a lack
of documentation - including limited proof of the borrower's income poor credit history, and
adverse financial situations usually associated with sub-prime applicants.

A high risk based pricing system is used in order to calculate the terms of loans, which are
offered to borrowers with varying credit histories. The sub-prime borrowers charge high rates of
interest, but still credit risk is more than interest rate risks due to the increased chances of
defaults and less opportunities to refinance the loans.

Sub-prime lending was initially a helping hand to all those borrowers who aimed to fulfill their
dream of owning a home. Sub-prime loans increased opportunities for homeownership and
added 9 millions of households to the new status of homeowners in less than a decade and
increased employment opportunities thereby increasing the growth rate.


                                                                                              29 
 
However, providing loans to the low-income sections of the society was a benefit as well as
fallout of the sub-prime loans. The availability of liquidity was the prominent factor that
prompted the banks to provide loans at high rates, on the surety that even if the borrower fails to
pay the loan amount, they may still have the option to sell the houses and recover the amount.
The fact that the housing prices usually tend to appreciate, furthermore, made the bankers free
from any apprehensions of recovering the losses. Also since sub-prime lending, a direct result of
high liquidity, prompted banks to issue loans without any strict regulations which could help
them to earn high amount of profits by the securitization mechanism as explained later.

Sub-prime borrowing was as such not flawed; rather it was the high quantum of sub-prime loans
granted without proper regulations that appeared to be the major reason for the fallout. The
positive picture of profit earnings hid the shortcomings of improper regulations, irresponsible
lending and inefficient rating system by the credit rating agencies.

Sub-prime lending became highly controversial: Sub-prime lenders often engaged in
predatory lending practices such as deliberately lending to borrowers who could never meet the
terms of their loans, thus leading to default, seizure of collateral, and foreclosure. They often
employed unscrupulous means by enticing, inducing, and/or assisting a borrower in taking a
mortgage that carried high fees, a high interest rate etc.

Property Fraud by Lenders: With the increase in sub-prime lending there was a similar
increase in the property frauds. By selling overpriced apartments to the unsuspecting buyers, the
sellers took the money and disappeared. So now the entire deal was between the banks and he
borrowers. In this way the sellers, earned huge amounts on the overpriced sold houses.

Second Mortgages: Irrespective of the bad credit histories, the sub-prime lending had made
second mortgages easier on the existing mortgaged houses. The repayment of another loan
burdened the borrowers, which ultimately had to borne by the lenders i.e. the banks, when the
borrowers defaulted in making the payments.

Lax Lending Rules: Analysts say lax lending standards led some mortgage firms to grant home
loans to tens of thousands of borrowers who did not have the means to meet their mortgage
payments when interest rates increased.

Irresponsible Credit Rating Agencies: Credit rating agencies such as Standard and Poor's,
Moody's and Fitch Ratings were urged by the panel to improve their influential reports and
assumptions about a wide range of securities and corporations.

Major Banks meanwhile were encouraged to disclose more information about the securitization
of complex credit instruments, such as mortgage, credit card and student loans, which they
package or cut up and sell to other banks and investors.

                                                                                                30 
 
Besides that the other reason why the Sub-prime mortgage crisis unfolded the way it did had also
to do with the complex financial wizardry that was devised around the lending that had the effect
of ‘over-lending’. That is the financial systems geared up by multiples in excess of what they
could or rather should have. Due to the complexity, sheer size and volume, presence of numerous
players and major flaws in the sub-prime lending have all caused the system to collapse. New
forces have played important roles in Sub-prime crisis that had in the post been absent.

    1. Complex investments: Financial firms wield ever more sophisticated financial tools.
       CDOs and MBAs enabled complex and opaque investments.
    2. New institutions: Players like hedge funds and buyout firms – also called Private
       Equity, represent a large and rising sharing of overall investment money. Hedge funds
       also have taken exposure to the subprime investments. These players are significantly
       less regulated than the listed companies-these are less transparent and generally have a
       free will to do pretty much what they want. Besides that Rating agency and Credit
       enhancers played a very important role in certifying the quality of the subprime credit.
       These too are outside the purview of the agencies.
    3. Leverage: the growing use of Debt or leverage by financial players magnifies the first
       two forces. An era of easy money has enabled more risk taking built on borrowed funds.
       That can accentuate in both the ups and downs of a cycle, raising the chances of panic
       selling during down turns and frenzied buying in upturns.
    4. Globalization: Today all the nations in the world are linked through easy movement of
       funds. In the less regulated markets money moves both in and out freely. In the medium
       regulated markets like India, the movement is not easy but even then the movement is
       copious enough to affect massive hemorrhage. This has very telling effect. In this case for
       example large banks across the world had exposure to the subprime conundrum. And
       when the damage occurred the ripple effect wiped out a lot of financial players across the
       globe.

Given the gearing up and the various reasons as explained above, the subprime imbroglio was a
time-bomb which was waiting to implode. And as it did it took down with it the most powerful
economy in this globe.


                                                                                               31 
 
THE CRISIS AND CHRONOLOGY OF EVENTS
                                       Timeline of Implosion


     “What began as a tremor in the sub-prime mortgage market that affected a relative few, has
    sadly gained momentum, creating a broader credit crisis that continues to threaten the middle
                               class and overall economic growth.”

                                                                     -Senator Jack Reed

The U.S. economy was at the peak of invincible growth and incessant development with every
sector enjoying a boom since the past two decades. The unemployment rates were fairly low,
inflation under control, stock markets scaling new heights, banking sectors overflowing with
liquidity and growth figures rising steadily accounting for 26% of the worlds GDP.

The American economy flooded with enormous liquidity and the low income citizens striving to
fulfill their imperative dream of shelter had an incomprehensible tryst with each other and
resulted in the whole sub-prime saga.

As it has been said that invention is the mother of necessity the financial institutions devised an
innovative mechanism of securitization with Mortgage Backed Securities and Collateral Bonds
Obligations as the two offsprings. The low-income people who had tarnished credit histories or
no documentation were issued loans without any such requirements to be fulfilled. The funds
generated from these instruments were used to create new investment vehicles i.e. MBS’s and
CDO’s that were issued to investors by the bankers at varying rates of interest depending on the
ability of the borrowers to repay.

The whole mechanism was a laudable creation of the financial know-how and desperately
fulfilled dreams. So the sub-prime lending mechanism was an efficient fabrication of converting
attractive dreams to a moneymaking business with the creation of two ingeniously thought over
instruments.

The boom in the housing sector, enticing interest rates and high profit margins kept on luring the
financial institutions, that they shut their eyes to the pessimistic notion that if those borrowers

                                                                                                32 
 
failed to pay their debt obligations or if the collateralized houses faced a surge in the prices, the
aftermath could result in the collapse in the whole banking segment on the threshold of which
lies a whole economy with all the sectors interlinked to each other presenting the cascading
effect.

Housing markets have gone bust, interest rates have touched the pinnacles, stock markets across
the world have collapsed, unemployment toll has increased, growth rates have plummeted,
global inflation has been scaling to new heights, the fiscal deficit gaps are widening, corporate
giants have been announcing billion dollar losses with colossal business houses being taken over
at the lowest of their values. Figure 5 shows the timeline of the events.


                                                                                                  33 
 
Figure 4: Timeline of Implosion


                                      34 
 
US Subprime Crisis Impact

Más contenido relacionado

Similar a US Subprime Crisis Impact

IAF605 week 4
IAF605 week 4IAF605 week 4
IAF605 week 4IAF605
 
IAF605 Week 4
IAF605 Week 4IAF605 Week 4
IAF605 Week 4IAF605
 
BRANDEIS INTERNATIONALBUSINESS SCHOOL15 April 2015.docx
BRANDEIS INTERNATIONALBUSINESS SCHOOL15 April 2015.docxBRANDEIS INTERNATIONALBUSINESS SCHOOL15 April 2015.docx
BRANDEIS INTERNATIONALBUSINESS SCHOOL15 April 2015.docxhartrobert670
 
Jp littlebook2013
Jp littlebook2013Jp littlebook2013
Jp littlebook2013Jose Koshy
 
م.13 - مبادرة #تواصل_تطوير - د.أكرم حسن - إدارة الأزمات الطارئة (انقاذ الاعم...
م.13 - مبادرة #تواصل_تطوير - د.أكرم حسن  - إدارة الأزمات الطارئة (انقاذ الاعم...م.13 - مبادرة #تواصل_تطوير - د.أكرم حسن  - إدارة الأزمات الطارئة (انقاذ الاعم...
م.13 - مبادرة #تواصل_تطوير - د.أكرم حسن - إدارة الأزمات الطارئة (انقاذ الاعم...Egyptian Engineers Association
 
Speech on Global Economy
Speech on Global EconomySpeech on Global Economy
Speech on Global Economyuberrimaefide
 
impact of recession in india
impact of recession in indiaimpact of recession in india
impact of recession in indiachirag16
 
Financial Reporter 2010 Iss81
Financial Reporter 2010 Iss81Financial Reporter 2010 Iss81
Financial Reporter 2010 Iss81Yuhong Xue
 
The Role Of Mathematical Models In The Current Financial Crisis Athula Alwis
The Role Of Mathematical Models In The Current Financial Crisis   Athula AlwisThe Role Of Mathematical Models In The Current Financial Crisis   Athula Alwis
The Role Of Mathematical Models In The Current Financial Crisis Athula Alwisathula_alwis
 
Capitalizing on the Emerging Markets - Interview with: Christian Menegatti, R...
Capitalizing on the Emerging Markets - Interview with: Christian Menegatti, R...Capitalizing on the Emerging Markets - Interview with: Christian Menegatti, R...
Capitalizing on the Emerging Markets - Interview with: Christian Menegatti, R...Investments Network marcus evans
 
2009 T H E F U T U R E O F T H E G L O B A L F I N A N C I A L S Y S T...
2009  T H E  F U T U R E  O F  T H E  G L O B A L  F I N A N C I A L  S Y S T...2009  T H E  F U T U R E  O F  T H E  G L O B A L  F I N A N C I A L  S Y S T...
2009 T H E F U T U R E O F T H E G L O B A L F I N A N C I A L S Y S T...Madrid Network
 
Etude PwC sur les entreprises japonaises (2012)
Etude PwC sur les entreprises japonaises (2012)Etude PwC sur les entreprises japonaises (2012)
Etude PwC sur les entreprises japonaises (2012)PwC France
 
J W T Anxiety Index Quarterly Winter 2009
J W T  Anxiety Index  Quarterly  Winter 2009J W T  Anxiety Index  Quarterly  Winter 2009
J W T Anxiety Index Quarterly Winter 2009Gaurav Gupta
 

Similar a US Subprime Crisis Impact (20)

Money Manager
Money ManagerMoney Manager
Money Manager
 
Ghost Protocol
Ghost ProtocolGhost Protocol
Ghost Protocol
 
Em exposure
Em exposureEm exposure
Em exposure
 
16016
1601616016
16016
 
IAF605 week 4
IAF605 week 4IAF605 week 4
IAF605 week 4
 
IAF605 Week 4
IAF605 Week 4IAF605 Week 4
IAF605 Week 4
 
BRANDEIS INTERNATIONALBUSINESS SCHOOL15 April 2015.docx
BRANDEIS INTERNATIONALBUSINESS SCHOOL15 April 2015.docxBRANDEIS INTERNATIONALBUSINESS SCHOOL15 April 2015.docx
BRANDEIS INTERNATIONALBUSINESS SCHOOL15 April 2015.docx
 
India @ Risk 2008
 India @ Risk 2008 India @ Risk 2008
India @ Risk 2008
 
Jp littlebook2013
Jp littlebook2013Jp littlebook2013
Jp littlebook2013
 
م.13 - مبادرة #تواصل_تطوير - د.أكرم حسن - إدارة الأزمات الطارئة (انقاذ الاعم...
م.13 - مبادرة #تواصل_تطوير - د.أكرم حسن  - إدارة الأزمات الطارئة (انقاذ الاعم...م.13 - مبادرة #تواصل_تطوير - د.أكرم حسن  - إدارة الأزمات الطارئة (انقاذ الاعم...
م.13 - مبادرة #تواصل_تطوير - د.أكرم حسن - إدارة الأزمات الطارئة (انقاذ الاعم...
 
Speech on Global Economy
Speech on Global EconomySpeech on Global Economy
Speech on Global Economy
 
impact of recession in india
impact of recession in indiaimpact of recession in india
impact of recession in india
 
Financial Reporter 2010 Iss81
Financial Reporter 2010 Iss81Financial Reporter 2010 Iss81
Financial Reporter 2010 Iss81
 
The Role Of Mathematical Models In The Current Financial Crisis Athula Alwis
The Role Of Mathematical Models In The Current Financial Crisis   Athula AlwisThe Role Of Mathematical Models In The Current Financial Crisis   Athula Alwis
The Role Of Mathematical Models In The Current Financial Crisis Athula Alwis
 
Capitalizing on the Emerging Markets - Interview with: Christian Menegatti, R...
Capitalizing on the Emerging Markets - Interview with: Christian Menegatti, R...Capitalizing on the Emerging Markets - Interview with: Christian Menegatti, R...
Capitalizing on the Emerging Markets - Interview with: Christian Menegatti, R...
 
2009 T H E F U T U R E O F T H E G L O B A L F I N A N C I A L S Y S T...
2009  T H E  F U T U R E  O F  T H E  G L O B A L  F I N A N C I A L  S Y S T...2009  T H E  F U T U R E  O F  T H E  G L O B A L  F I N A N C I A L  S Y S T...
2009 T H E F U T U R E O F T H E G L O B A L F I N A N C I A L S Y S T...
 
Crisis Management
Crisis ManagementCrisis Management
Crisis Management
 
Etude PwC sur les entreprises japonaises (2012)
Etude PwC sur les entreprises japonaises (2012)Etude PwC sur les entreprises japonaises (2012)
Etude PwC sur les entreprises japonaises (2012)
 
J W T Anxiety Index Quarterly Winter 2009
J W T  Anxiety Index  Quarterly  Winter 2009J W T  Anxiety Index  Quarterly  Winter 2009
J W T Anxiety Index Quarterly Winter 2009
 
Industrialization
IndustrializationIndustrialization
Industrialization
 

US Subprime Crisis Impact

  • 1. The U.S. Sub-prime Crisis – A Study of the recent economic development in the U.S. and their likely impact on the Indian Economy A report submitted in partial fulfillment of the requirements of MBA program at ICFAI Business School, Ahmedabad. Submitted to: Submitted to: Prof. Vivek Ranga Mr. Sunil Chandra Faculty Guide (Country Head-DPM) IBS, Ahmedabad. Almondz Global Securities Ltd. 0   
  • 2. A REPORT ON The U.S. Sub-prime Crisis – A Study of the recent economic development in the U.S. and their likely impact on the Indian Economy BY PARAMJEET KAUR AT ALMONDZ GLOBAL SECURITIES LIMITED NEW DELHI A report submitted in partial fulfillment of the requirements of MBA program at ICFAI Business School, Ahmedabad. Submitted to: Submitted to: Prof. Vivek Ranga Mr. Sunil Chandra Faculty Guide (Country Head-DPM) IBS, Ahmedabad. Almondz Global Securities Ltd. 1   
  • 3. SUMMER INTERNSHIP PROGRAMME The U.S. Sub-prime Crisis – A Study of the recent economic development in the U.S. and their likely impact on the Indian Economy Submitted By: Name: Paramjeet Kaur Enrollment No.:07 BS 2784 Mobile No.:09974339611 Email ID:paramjeet.kaur86@gmail.com 2   
  • 5. ACKNOWLEDGEMENT Across the road to the Corporate World, Unknown pursuits came my way. A ‘Thanks’ would be too small a token, for all that with what I stand today! The fourteen weeks Summer Internship Programme needs a laudable appreciation for the novel experience of practical knowledge and the true insights of the clichéd Corporate Culture. Thanking all the affiliates’, veterans in knowledge and virtuoso in experience would be a mere token of gratitude, which may not be sufficient for all the knowledge imparted, and all the blessings bestowed upon me. I would like to express my immense gratitude to Mr. Sunil Chandra (Country Head, Debt Portfolio Management) for guiding me throughout the whole project with his impeccable knowledge. I owe my gratitude to Ms. Rajni Dasgupta (Vice President) who taught me the first lesson of corporate culture. Mr. Abhilash Kumar (Manager) owes a special mention for the invaluable insights that he provided me, which would be carried forward as a legacy of knowledge and learning all through my life. I am also thankful to all the staff members’ of Almondz Global Securities Limited, who have always guided me whenever I needed help and acquainted me with the minutest details of etiquettes and behavioral aspects. I sincerely thank Mr. Vivek Ranga, who has always been a continuous source of encouragement all through the project. I am also thankful to my faculty members and Prof. P. Bala Bhaskaran for guiding me all the way. All the more, ICFAI University needs to be praised which has provided the students with such a bright opportunity to have an exposure of the real corporate environment for the valuable period of three and a half months to get the corporate ambience imprinted on our minds to carry forward the learning’s of this first tryst with corporates in the future struggle in the path of professional success. Last but not the least, a special mention must be made to all those who have knowingly and unknowingly helped me in the completion of this project. I owe my gratitude to my parents who have always encouraged me in the pursuit of excellence. Paramjeet Kaur 07 BS 2784 4   
  • 6. TABLE OF CONTENTS  ABSTRACT       10    INTRODUCTION                             11      Purpose of the Study                  11    Scope of the Study                  12    Limitations of the Study                12    Methodology of the Study                13    INTRODUCTION                             14  HOUSING MARKETS IN U.S.A.: Major Contributor to Growth      16    Homeownership‐ The American Dream            16    Economic Impacts of the Housing Sector            18    Housing Sector having Macro‐economic Implications        20    Impact on Communities                20    Impact on Individuals                 21    Housing Contribution to Society              22  LEVERAGED SECURITY MARKETS: The Double Edged Sword      23    Leveraging                    23    Housing Sector: The Initial Fuel              23      Securitization: Prime Mover of the Crisis            24    Sub‐prime Crisis: A result of Leveraging            26  SUB‐PRIME LENDING: The Flaws              29  THE CRISIS AND CHRONONOLOGY OF EVENTS: Timeline of Implosion    32     Chronology of Events                  36  5   
  • 7. THE PARTIES IN THE CRISIS AND THEIR ROLE: Walking the Line        53    Role of Borrowers                  53  Role of Financial Institutions                55     Role of Securitization                  56     Role of Mortgage Brokers and Mortgage Underwriters        57               Role of Government and Regulators              58  Role of Credit Rating Agencies              58  Role of Central Banks                  59  IMPACT OF THE CRISIS ON THE U.S.A.: Entering A Possible Recession 61 Collapsing US Housing markets               63  Unemployment                  68  Fed rate cut                    69  Inflation                     70    Falling dollar                    71  Widening fiscal deficit                 75  US GDP growth                  77  IMPACT OF THE CRISIS ON THE WORLD FINANCIAL MARKETS 78    Impact on the Commodities Markets: Markets pivot on its head      82      Gold Markets                  83      Crude Oil                  85      Metals                   86  On Stock Markets: Gravity proves itself            87  On Some of the Larger Economies: Euro and Japanese        91  6   
  • 8. IMPACT ON INDIA 96      The First Signs: First Blood                98    On Financial Markets: Stock Markets lose their Sheen                  100    On Commodities markets with special emphasis on Crude oil: A fuel to inflation  102    On Money Markets and Interest Rates: The Hinges of Growth                104    On INR: Challenging the might of the Dollar                      107    Indian Housing Markets: Following the Footsteps                     109    On Indian Economy: Structural Changes: The proverbial struggle of Good vs. Bad  112  THE NEW WORLD ORDER: Rise Of the Behemoth 114   APPENDIX Appendix 1:   Borrowers Protection Act 2007                        118  Appendix 2:    Beige Book                           125    Appendix 3:   Fico Scores                127  Appendix 4:   Role of Freddie Mac and Fannie Mae         129  Appendix 5:   Housing Market Correction & Bursting of Housing Bubble    131    Appendix 6:   Asian Currency Crisis              131  Appendix 7:   Russian debt Crisis              132  Appendix 8:   Long‐Term Capital Management          133  Appendix 9:   Relation between Crude Oil & Dollar Value        134  Appendix 10:   Relation between Gold Prices & Dollar Value      136    Appendix 11:   Relation between Crude Oil & Gold Prices        138    Appendix 12:   Theory of Decoupling             140  GLOSSARY                      141  BIBLIOGRAPHY                                                                                 143  7   
  • 9. TABLE OF FIGURES AND ILLUSTRATIONS   Figure 1:       Housing Sector creates a vicious circle           14  Figure 2:  Real Median Household Income            17  Figure 3:   Homeownership trends in USA (in '000)          18  Figure 4:   Mechanism of Securitization              25  Figure 5:   Timeline of Implosion               34  Figure 6:   US Foreclosure Filings               55  Figure 7:   Home Ownerships in US              57  Figure 8:   Relative Size of Variable Interest Rate Mortgages                                    65  Figure 9:   Home Price Indices              65  Figure 10:   Foreclosure starts rate                66  Figure 11:   Unemployment in USA               68  Figure 12:   Fed Rate cuts in US                69  Figure 13:   Inflation Rate in USA                70  Figure 14:    USD vs. Euro (Interbank Rate)             72  Figure 15:   USD vs. JPY (Interbank Rate)              73  Figure 16:   U.S. Treasury Yield Curve Rate                        73  Figure 17:   Federal Fiscal Position                       75  Figure 18:   US Economic Growth                77  Figure 19:   World Economic Growth              79  Figure 20:   Growth figures forecasted by IMF           80  Figure 21:   Commodity Prices across the world            82  Figure 22:   Gold Prices in USD/Ounces              83  Figure 23:   Oil Prices in USD/Barrel              85  Figure 24:   Base Metal Indices                86  8   
  • 10. Figure 25:   Major stock market indices              87  Figure 26:   Dow Jones Index                88  Figure 27:   NASDAQ Index                  89  Figure 28:   Nikkei 225 Index                89  Figure 29:   DAX Index                  90  Figure 30:   Main developments in major industrialized economies     91  Figure 31:   BSE Sensex                            100  Figure 32:   Nifty Index                           100  Figure 33:   Bank Nifty                            101  Figure 34:   CRR (Cash Reserve Ratio)                        104  Figure 35:   Call Money Borrowing                          105  Figure 36:   INR vs. USD                           107  Figure 37:   Percentage Distribution of GDP as per sectors                               112  TABLE OF BOXES   Box 1:   Mechanism of Leveraging                           26  Box 2:   Types of Borrowers                54  Box 3:   Predatory Lending Practices             57  Box 4:  Potential Subprime Losses                       61  Box 5:  Main Credit Losses so Far               62  Box 6:  Projected Economic Losses                          67  Box 7:  Major Market Falls in January 2008                       87  Box 8:  House Price Developments In Central & Eastern European Countries 93  Box 9:   Indian Companies with Foreign Losses                     98    Box 10:          Market Intervention by RBI                       108  9   
  • 11. ABSTRACT The U.S. economy has over the past few decades enjoyed the status of being a financial superpower. The housing sector was booming as more and more people were eager to fulfill the ‘American Dream’ of owning a home. The spiraling housing prices enticed the people to buy homes with initial borrowing and lending rates that were extremely low; which helped to boost the demand and supply of new and existing houses. The liquidity of the banks, eagerness of borrowers to own a house and an inefficiently created structure of financial products lead to the subprime debacle. The financial systems were overflowing with liquidity, which made them construct a mechanism of securitization that involved pooling of the loans and creating Collateralized Debt Obligations (CDO) and Mortgage Backed Securities (MBS). The low-income borrowers were enticed by the various types of mortgages such as Adjustable Rate Mortgages, Interest Only Mortgages (I/O) etc. The borrowers readily accepted these loans as these short-term low rates reduced the burden of the borrowers. All sorts of people with or without any income proof or documentation availed of these loans. The pools of these debts were smartly issued to investors depending on the risk attached to the instruments. The housing market correction and bursting of the housing market bubble overturned the whole scenario. This increased the delinquency rates and the number of foreclosures filings were surging. To make matters worse, the increased unsold inventory further reduced the prices making it difficult for the financial institutions to sell them and recover their loans. Due to the complexity, sheer size and volume, presence of numerous players and major flaws in the subprime lending the whole U.S. economic system now stands at the verge of a possible collapse. The U.S. economy is witnessing a decline in the growth figures. The unemployment rates are rising further aggravating the inflation numbers. The strengthening Euro and Yen stand as evidence that the U.S. economy is in a downturn. The effects from the possible recession in the U.S. and the reading of a world wide spread of the ‘economic fever’ has made the commodities prices to increase and for the capital markets to tumble. Widespread losses across the markets have brought economies to reassess their exposure to the U.S. economy and Central banks of these countries have taken steps (both reactive and pre-emptive) to control any major contagion. The Indian economy/markets may be comparatively safe due to the strict regulations of the RBI. Even then, in the world of gross inter-linkages the chances of the system getting singed cannot be ignored. The exposure of our economy to the U.S. markets may be limited; even then the indirect impacts cannot be ignored. The study would then try to analyze the impacts both direct and indirect on the Indian financial systems. 10   
  • 12. INTRODUCTION The whole world being linked with the common ties of globalization has necessitated the study of the turbulence in the U.S. economy and its impacts on the world with special relevance to the Indian economy. The subprime crisis and its effects on the U.S. economy and the world economies have been studied in detail moving onto the Indian economy. PURPOSE OF THE STUDY The main objective of the study is to have: • An understanding of the ongoing Sub-prime crisis • The impact on Financial Markets, Commodities Markets (Crude Oil), Money Market of our country • Study its impact on U.S.A, developed economies and the Indian Economy. • Future implications on the World Economic system in general. • Study the possible impact it may have on India. • Expected changes to the Indian Economy post Subprime Crisis The world economies are at present passing through one of the most difficult phases in recent times. The sub-prime crisis, which has its roots in the U.S., threatens to rage onto the other developed economies eventually to scathe the emerging market economies in wake. Sitting in India, we may appear, at present, seem to be unaffected by the world economic problems. Statements by heads of important agencies have time and again impressed that the Indian economy has a very little exposure to the subprime and that, aside from scratches, the economy, in general, would walk tall. However, in spite of the Indian economic systems seemingly direct insulation from the impacts, the fact remains that in the world of integrated economic systems, the U.S. recession is bound to test the resilience of the domestic economy. Already the stock markets, which seem to have the maximum exposure, have entered into a highly unpredictable and volatile state. The domino effect on the other sectors would take some more time to incident. 11   
  • 13. SCOPE OF THE STUDY The project involves studying the subprime crisis as a whole. The main topics under this project are - Housing markets in the U.S.A, Leveraged Security Market & the Process of Subprime Lending. A study of the chronology of events will also be made to ascertain its incidence and the way it turned into a huge crisis engulfing the global economies. The project will also involve studying the parties in the crisis such as borrowers, lenders, banks etc. and their role. After having an insight of all this the project shall move on to the impact and implications on U.S., some leading world economies and finally India. This will include studying: • The Commodities Market with special emphasis on the Crude oil market and how it effects inflation. • The Stock Markets of the world • Overall effect of subprime crisis on the money markets and interest rates in India. • Changes in forex rate of INR and the U.S.D. • The Structural Changes of Indian economy posed by the subprime crisis will also be done. LIMITATIONS OF THE STUDY Subprime crisis and the fallouts to the economy thereof is a very expansive area that has gripped the biggest economy of the world. No matter how deep one goes into it, the chances of understanding it to the core may be difficult. The study would also not include aspects that are topical to U.S.A and would include only those that are relevant in the Indian context or, which may have a bearing on India. Due to the ‘lag effect’ all the resultants may not manifest itself at the time of the study, so while a theoretical study may be made, a comparison of the actual results may leave a lot wanting. 12   
  • 14. METHODOLOGY The methodology comprises an in-depth search of various news articles, journals, reports, relevant laws and other literary work on this topic. The report involves an analysis of the latest movements in the U.S. and the Indian Financial Markets. A search on the internet and books is another aid to the successful completion. A systematic approach has been followed which involves concentrating on the lowest level accentuating the role of various parties who were party to the entire debacle. The next level of the study involved studying the timeline of how it transformed into such a huge problem. The impact of U.S. economy, then the inter-related world economies is the next step under the study. Finally the subprime crisis spreading its wings to the Indian Economy will be studied. 13   
  • 15. INTRODUCTION “What began as a fairly contained deterioration in portions of the U.S. sub-prime market has metastasized into severe dislocations in broader credit and funding markets that now pose risks to the macroeconomic outlook in the United States and globally” Global Financial Stability Report, IMF, April 2008. The recent turmoil that has inflicted the world economies is the sub-prime crisis. Related to the housing prices and engulfing the entire banking system of the U.S. economy, this crisis has spread its wings to encompass the worldwide economies in its realm translating it into a major financial crisis. The impact of this crisis has been so severe that the entire banking system of the world’s largest economy may collapse, leaving little scope for recuperations out of this crisis. The fact that the housing crisis has led to the present imbroglio is obviously undeniable. Introduction The outburst of the crisis after the bursting of the housing bubble in the U.S. has made this economy confront a new crisis with differently fabricated causes and effects. The high default rates on “sub-prime” and other higher-risk borrowers with lower income have resulted in the sub-prime crisis. Initially, the long term rising house prices and the attractive loan incentives encouraged borrowers to assume mortgages with the fact that they shall be able to refinance later on. However, the situation reversed when the housing prices started to drop in 2006-2007 in many parts of the U.S. making it difficult to refinance the loans. This all resulted in a vicious circle as the number of foreclosures increased, the housing inventory escalated depressing the house prices (figure 1). Being inter-related to other sectors of the economy, these trends have lead to a contraction in the construction industry, hurting overall U.S. economic activities making it enter into a possible recession. The problem of grave concern is the falling home prices leading to a credit crunch, which is actually driving up Figure 0: Housing Sector creates a vicious circle 14   
  • 16. mortgage rates and making mortgages unavailable, leading to a further decline in home prices. The whole carnage revolves around sub-prime lending by financial institutions. These institutions being accompanied by other parties such as Credit Rating Agencies, Mortgage Brokers and Underwriters etc. created a complex structure of lending and borrowing process, through the process of securitization. Being unified with common ties of globalization this American fiasco soon turned into a worldwide crisis affecting the major economies of the world. This project studies the entire housing sector, which saw great heights and steep depths within a very short period of time. How the booming housing sector, which was a major asset of the weakest people of the society through innovative instruments and loans facilitated by various parties, saw its downfall is an interesting part, which is analyzed. Being one of the pillars of the American economy, how the movement in this pillar affected the whole economy inter-linked in various dimensions of employment, finances, and other macro-economic indicators (inflation, currency etc) has been thoroughly done. The world bonded by the Theory of Decoupling has seen new changes in growth brackets, trade movements and other global changes throughout this period. Being an emerging economy, the Indian economy has also seen new pursuits in its economic framework and there still remain unknown pursuits and dimensions connected to the global economic architecture. This project thus has various pursuits to explore about the American economy, world economies and Indian economy. There is a whole gamut of linkages between, inter-related and intra-related sectors, which have been studied in this project. 15   
  • 17. HOUSING MARKETS IN U.S.A Major Contributors to Growth The real estate sector is amongst the largest sectors in the U.S.A. It has been a significant contributor to the U.S. economy, providing millions of jobs and had been generating hundreds of millions of dollars of economic output each year. It has traditionally been an important source of wealth building. The housing sector has been the main driver of economic growth of U.S. Therefore the weakening of this sector tends to have ominous implications for continuing expansion in the period ahead. The housing sector accounts for about 6% of GDP, but has been a much more important component of growth, contributing 0.50% directly to GDP growth (translating to some U.S. $60 billion/year) and on the average adding 30,000 new jobs monthly in 2005. Some estimates suggested that wealth (home prices) and liquidity (home equity extraction) effects might have been contributing up to 1.5% to GDP growth in the last few years. Over the past four years ending 2006, consumer spending and residential construction together have been accounting for 90% of the total growth in GDP. And over two-fifths of all private sector jobs created since 2001 till the advent of crisis have been in housing-related sectors, such as construction, real estate and mortgage broking. Homeownership – The American Dream Housing (or an availability of dwelling) is one of the most important wants of any human. As the society and civilizations progressed, so did the desire to have a comfortable home. This desire cuts across all the income segments, race, and income levels. However, the common denominator remained – owning a house (see chart below). Two reasons why there was a housing boom was - Increased level of income and - Easy availability of money. Increased level of income Since 1967, the median household income in the United States had risen by 31%. The rise in household income has been largely the result of an increase in personal income among college graduates, a group that had doubled in size since the 1960s, and women entering the labor force. Today, 42% of all households have two income earners. 16   
  • 18. Overall, the median household income rose from $33,338 in 1967 to an all-time high of $44,922 in 1999, and has since decreased slightly to $43,318. Decreases in household income have been visible during each recession, while increases have been visible during economic upturns. While per-capita, disposable income had increased 469% since 1972, it had only increased moderately when inflation is considered. In 1972, disposable personal income has been determined to be $4,129; $19,385 in 2005 dollars. In 2005, disposable personal income was, however, $27,640, a 43% increase. Since the late 1990s, household income had fallen slightly. Figure 1: Real Median Household Income Further with the advent of complex financial systems, conduits, mechanisms and tools it suddenly became easier to own a house. 67.5% of households realized this dream in 2001, which translated into 72.6 million households as homeowners. Since then, the Bureau of the Census had projected an additional 11.7 million new households will form over the coming decade, with the larger percentage growth among minorities. The demand for housing, therefore, will continue to over the next decade. Freddie Mac estimated that 50 million families will be buying homes in the next 10 years - more than 10 million of them for the first time. Clearly, a substantial segment of society is and will continue to realize the American Dream. Of course this was before the Sub-prime crisis roared its head. 17   
  • 19. 140000 127,958 126,009 123,926 121,478 120,835 Vacant Total 122,187 119,628 119,043 119,280 117,280 Renter Total 115,620 112,655 114,137 110,948 Owner Total 109,716 106,281 108,317 107,277 105,731 17,652 104,631 16,437 120000 15,695 11,633 103,653 14,468 15,598 101,102 13,908 15,276 14,315 14,114 13,747 99,307 13,418 13,153 12,669 95,255 12,258 11,987 11,925 12,024 12,058 12,241 9,448 10,585 10,164 100000 8,908 34,194 35,147 33,678 33,014 34,417 33,506 33,687 34,470 34,831 80000 34,896 35,059 34,943 35,246 31,731 35,559 34,730 34,569 34,243 33,975 33,735 33,320 32,602 32,299 30,695 60000 40000 20000 55,652 63,452 56,844 57,915 58,700 59,755 60,248 61,010 61,823 62,999 63,131 64,740 66,041 67,143 68,637 70,098 71,250 72,593 71,278 72,053 73,575 74,553 75,378 75,159 0 1984 1985 1986 1987 1988 1989 1990 1991 1992 1993 1994 1995 1996 1997 1998 1999 2000 2001 2002 2003 2004 2005 2006 2006 Figure 2: Homeownership trends in U.S.A (in '000) Easy Availability of Money The most prominent reason for the housing boom was the easy availability of money. After the dotcom bubble the Federal Reserve Bank had decreased the Fed fund rate 14 times from 6.5% to 1% within two years since 2001. This had increased the liquidity in the market. As a result of this overflowing liquidity in the financial markets, the banks offered loans to borrowers thus making money easily accessible to even the low-income borrowers. This also marked the period of the housing boom. Economic Impacts of the Housing Sector Housing sector being a major contributor to the American growth, any shudder in this sector can engulf the whole economy. And, if it is the American economy, un doubtingly the tremors have to reach across the globe. The following facts help U.S. to understand the contributions of the Housing industry to the economic growth of U.S.A. The housing sector contributed about 14 percent to the nation’s total production. Home equity constituted the largest share of household net worth. The stock of fixed residential assets was worth nearly $10 trillion – equivalent to one- year worth of U.S. GDP. 18   
  • 20. About 1.5 million newly housing units were started each year. Housing starts have been one of the key factors in the macroeconomic business cycle. About 40 percent of monthly consumer expenditures were housing related. More than $1 trillion exchanged hands from the sale of existing and new homes. There were 288,273 establishments categorized as “real estate & rental & leasing with over 1.7 million paid employees. 40% of the employment growth in the entire economic expansion was a result of soaring home sales and prices. This included employment in home building directly as well as in ancillary factors such as supplies, real estate agents, appraisers, title searches and mortgage servicing. Thus the housing sector has been one of the main sectors, which contribute both directly and indirectly to economic activity in the U.S.A. The two line items in GDP directly associated with the housing sector are residential fixed investment1 consisting of value-put-in-place of new housing units, production of mobile homes, brokers’ commissions on the sale of existing residential properties, expenditures related to improving and additions to existing units, and net purchases of used structures from government agencies and housing service for personal consumption expenditures, purchased by residents in the United States, in the form of rent for tenants or as rental equivalence for homeowners. In 2000, residential fixed investment totaled $415 billion and housing service expenditure was $956 billion. The combined total of $1.37 trillion represented 14 percent of GDP. Also, all economic activities produced a “Keynesian” multiplier effect. A home purchase usually resulted in further spending in other sectors of the economy (landscaping, appliances, and so on). The income earned by the landscapers was re-circulated into the economy as they spend, generating another round of income and purchases. The degree of multiplier depends on the degree of monetary policy accommodation and the “crowding out” effect. The multiplier was between 1.34 and 1.62 in the first year or two after an autonomous increase in spending. This meant that for each dollar increase in direct housing activity would increase the overall GDP by $1.34 to $1.62. Many people’s livelihoods depended on real estate. The February 2001 report showed that 1.49 million workers were employed in the real estate industry. The Real Estate and Rental and Leasing sector, which comprises establishments primarily engaged in renting, leasing, selling, and buying real estate for others, and appraising real estate, totaled 288,273 establishments with 1.7 million paid employees. The annual payroll amounted to $41.6 billion. Housing Sector Having Macro-economic Implication                                                              1 Consists of purchases of private residential structures and residential equipment that is owned by landlords and rented to tenants. From www.bea.gov 19   
  • 21. In addition to its direct contribution to GDP, the housing sector has been playing an important role in the overall direction of the nation’s economy over the course of macroeconomic business cycles. Conversely, housing starts have made just as dramatic a change, coming out of a recession. In fact, housing starts lead the rest of the economy preceding changes in GDP. In other words, disruptions to the housing sector (arising from policy changes) are likely to be followed by a significant macroeconomic slowdown, while a stimulus to housing can lead the rest of the economy out of a slowdown. During an economic slowdown, the Federal Reserve has been lowering the interest rates, other things equal. Consequently, the fall in interest rates during an economic slowdown has been acting as a strong buffer often providing a stimulus to the interest-sensitive housing sector. A drop in mortgage rates means lower monthly mortgage payments. This, in turn, means a lower qualifying income necessary to purchase a home. Conservatively, a one percentage drop in mortgage rates has translated into roughly 3 million additional households who would have the necessary income to qualify for a mortgage for purchasing a median priced home. Furthermore, many homeowners have refinanced their mortgages with the falling interest rates, leaving additional spending money to counter economic downturns. The economic slowdown from the mid-2000 to 2001 is a prime example of how this scenario is being played out. Housing starts and home sales began declining in spring of 2000 as the Fed has raised interest rates to cool the exceptionally fast growing economy. However, the economy has cooled much more drastically than desired and the Fed began reversing the interest rate policy by cutting the rates in early 2001. The subsequent falling interest rates have kept the housing starts and home sales to rebound to healthy levels even as the overall economy began sinking further. The economy would have undoubtedly tipped into a recession in early 2001 without the support of the housing sector during this period. Impact on Communities Construction of new homes provided jobs and higher tax revenues for local, state, and federal governments. Construction of each new single-family home required 1,591 worker-hours or the equivalent of 0.869 year of full-time labor. Each multifamily unit required 0.402 year of full- time labor. Projecting these estimates and accounting for productivity and price changes over the years, it is was estimated that the construction of 1,000 single-family homes generated 2,448 full-time jobs in construction and construction-related industries, $79.4 million in wages, and $42.5 million in combined federal, state and local revenues and fees. The construction of 1,000 multifamily units is estimated to have generated 1,030 full-time jobs in construction and construction-related industries, $33.5 million in wages; and $17.8 million in combined federal, state and local tax revenues and fees. Furthermore roughly 30 percent of the new home occupant’s income was spent on items produced by local businesses, such as hospitals, daycare centers, dry cleaners, and auto repair shops. 20   
  • 22. Almost 70 percent of all tax revenues raised by local governments in the United States came from property taxes. Homeowners contributed about 43 percent of property taxes, while commercial property accounted for 57 percent of real property tax revenues. Construction of new homes expanded the tax base and so increased the property tax revenues. using the average sales price of new homes in 2000, the local tax revenue base will increase by $185 billion. Aside from tax revenue to local communities, home production and subsequent homeownership provided additional intangible values. Homeowners did not move as frequently as renters, providing a source of neighborhood stability. Neighborhood stability in turn conferred benefits of higher social and community involvement such as crime prevention programs. Homeowners had a stake in their neighborhoods and communities, and so were likely to behave in ways that provided benefit to everyone in the community. Owners maintain their properties in better condition than do renters of comparable housing. Such behavioral differences had been observed regardless of the age or income of homeowners. All of these social benefits to homeownership can impact property values. Impact on Individuals Homeownership also provided individuals with a way to accumulate wealth for the future while benefiting from the provision of shelter. A tabulation of household wealth from the Federal Reserve’s Survey of Consumer Finances (1998) shows that home equity (the value of the home net of mortgages) was the largest component of total wealth. Equity in primary residences accounted for 28% of the total family asset. Furthermore, the survey shows that 12.8% of families had some form of residential real estate in addition to primary residence (second homes, time shares, and other type of residential property), an increase from 11.8% in 1995. The value of the asset in other residential property accounted for additional 5% of the total household asset. Retirement accounts were the largest financial assets outside of primary residence, with 19.8% of the total. Only for the very wealthy (income over $100,000 per year) did the home equity portion of wealth fall below 50% of the total household wealth. A separate survey from the Census Bureau also shows the dominant importance of home equity in determining household net worth. The Survey of Income and Program Participation periodically collects detailed wealth and asset data as a supplement to its core questions about labor force participation, income, demographic characteristics, and program participation. In 1995, median household net worth was $40,200; Median home equity for home-owning households was $50,000. Home equity constituted the largest share of household net worth, accounting for 44 percent of total net worth. A privately owned home, therefore, was an important vehicle for wealth accumulation for a large segment of society. In addition, home investment played an important role in portfolio diversification. Home prices in the U.S., on average, have risen steadily, and have much lower 21   
  • 23. volatility than stock or bond prices. The historically standard deviation for stocks and bonds had been 20% and 9%, respectively. For housing, the standard deviation was about 4%. Furthermore, the correlation between home prices with stock or bond prices was very low. Homeowners were also benefited from the easy availability of home equity loans. Whether as a readily available source of funds, or just the security of a credit source, certainly added value to homeownership. Housing Contribution to Society Although the level and benefits of community involvement are hard to measure, several researchers have found that homeowners tend to be more involved in their communities and local governments then renters. For instance, owners participated in a greater number of non- professional organizations and had higher voter participation rates. In addition to higher civic participation, owners also tend to remain in their homes longer, adding stability and familiarity to the neighborhood, and also tend to spend more time and money maintaining their residence. Home equity is one of the largest sources of collateral for bank loans to start new businesses. Over 740,000 businesses in 1992 reported a mortgage or home equity loan as a source of start-up capital for their business. It had been estimated in the UK that a 10 percent rise in the aggregate value of home equity increases the number of new business registration by 5 percent. Furthermore, people want to be homeowners. Fifty eight percent of the renters responded that owning a home is either the top or very important priority according to 2000 Fannie Mae’s National Housing Survey. Freedom to alter their homes or engaging in home maintenance and improving may provide intrinsic joys. Furthermore, others have noted that the home buying process and homeownership improve self- efficacy or a person’s sense of control over life events. And from extensive psychological studies self-efficacy is associated with better health status. Whether it be America’s dream or an economic indicator of growth or a tool for changing the course of Macro-economic policies, the American Housing Market was such an important sector that any vibrations in the housing led banking mechanism could lead to a shake up in the entire world economies. The highly leveraged market and the whole dream of owning homes turned into a huge debacle. Economists call it bursting of the housing “bubble.” In the following pages we have tried to present the build-up of this bubble, the dynamism of the leveraged security markets, the role of parties in this crisis and the likely impact on the U.S. and other economies of the world. 22   
  • 24. LEVERAGED SECURITY MARKETS The Double Edged Sword “…but in the modern fixed-income markets - where leverage is king and cheap credit is only the current jester - a move of that magnitude can do a lot of damage.” -Ryan Barnes, The Fuel That Fed The Sub-prime Meltdown. Leveraging The leveraging procedure, which intended to multiply the investments, opened new horizons for banks to offer the investors with innovatively designed debt instruments i.e. mortgage-backed securities (MBS), and collateralized debt obligations (CDO). Leveraging is borrowing to invest. Financial leverage takes the form of a loan or other borrowings (debt), the proceeds of which are reinvested with the intent to earn a greater rate of return than the cost of borrowing. The most familiar use of leverage is using a mortgage to buy a home. In return for a down payment one receives funds to purchase an asset that would otherwise be too expensive. The homeowners either try to pay out the money from the rent that would be saved or from the income streams (the rent earned) that their vocations generate. Leveraging helps both the investor and the firm to invest or operate. While leverage can play a positive role in the financial system, problems can arise when financial institutions go too far in extending credit to their customers and counter parties. If an investor uses leverage to make an investment and the investment moves against the investor, his or her loss is much greater than it would've been if the investment had not been leveraged - leverage magnifies both gains and losses. In the business world, a company can use leverage to try to generate shareholder wealth, but if it fails to do so, the interest expense and credit risk of default destroys shareholder value. The build-up of the sub-prime crisis is based on the mechanism of leveraging. The layer upon layer of leverage that propelled the expansion is now operating in reverse as the leverage is being unwound. Housing Sector: The Initial Fuel Housing sector has been one of the prominent drivers of the U.S. economy. Not only has it made contributions to the employment, production and GDP, it has also been a major stimulus for the overall economic growth of this huge economy leading the global world. This sector has 23   
  • 25. important linkages to every macroeconomic aggregate like GNP, savings, interest and inflation rate and also highlights its importance in public policy decisions. The American Financial Institutions being over-flooded with liquidity magnified the housing sector as a lucrative area. The leveraging mechanism with its off springs i.e. Mortgage-Backed Securities (MBS) and Collateralized Debt Obligations (CDO) generated great opportunities for even those who could not afford to pay the cash flow mandated as among the key requirements for taking loans. These sophisticated instruments, lackadaisical approach to adherence to prudent lending policy and the surplus of funds all contributed to the housing sector becoming the most booming sectors. As it grew, it took with itself almost the entire economy. Then an asset bubble began to form, frenzy fed on frenzy and the prices started to soar beyond what can safely be said to be the fundamentally correct prices. However, perhaps the key reason why the sub-prime crisis entrenched itself deep into the very sinews of the financial system of the U.S. was the creation of exotic leveraged instruments. That way banks now started lending more than the actual base money and that too to entities that had a very high risk-premium attached to it. Securitization: Prime Mover of the Crisis Securitization, an innovative form of financial engineering introduced two new instruments i.e. Mortgage Backed Securities and Collateralized Debt Obligations. Securitization is a structured finance process in which assets; receivables or financial instruments are acquired, classified into pools, and offered as collateral for third-party investment. Due to securitization, investor need for mortgage-backed securities (MBS), and collateralized debt obligations (CDO) as a profitable venture and the tendency of rating agencies to assign investment-grade ratings to these loans even though having a high risk of default could be originated, packaged and the risk readily transferred to others. The process of securitization has been explained with help of figure 4. Mortgage Backed Securities (MBS) and Collateralized Debt Obligations (CDO’s) the two instruments of securitization played an important role in aggravating the whole sub-prime saga. A mortgage-backed security (MBS) is an asset-backed security whose cash flows are backed by the principal and interest payments of a set of mortgage loans mainly on residential property. Collateralized debt obligations (CDO’s) are also type of asset-backed security and structured credit product but they are constructed from a portfolio of fixed-income assets. These assets are divided into different tranches: senior tranches (rated AAA), mezzanine tranches (AA to BB), and equity tranches (unrated). Here junior tranches offer higher coupons (interest rates) to compensate for the added default risk while senior tranches offer the lowest coupon rate offering highest safety level. 24   
  • 26.   Figure 3: Mechanism of Securitization                                                                                        STEP  1:    The  borrower  obtains  a  loan  from MORTGAGE BROKER   the lender with the help of mortgage brokers.   After  the  loan  is  made,  the  lender  and  the   mortgage  broker  do  not  have  any   interactions.   1    LOAN  STEP  2:    The  loan  is  then  sold  to  the  issuer   and the payments made by the borrower are LENDER   BORROWER provided to the issuer by the servicer.        LOAN PROCEEDS                                                                                                                                                                                                                                                                     TRUSTEE                                                                                                                                   MONTHLY PAYMENTS  UNDERWRITER   LOANS     2         RATING AGENCY  CASH SERVICER     CREDIT ENHANCEMENT PROVIDER   MONTHLY PAYMENTS  STEP  3:  The  loan  is  further  sold  to  the 4  investors.  The  issuer  is  assisted  by  the trustee,  underwriter,  rating  agency  and credit enhancement provider. ISSUER STEP  4:    The  servicer  acts  as  an 3 CASH intermediary  between  the  borrower  and the  issuer,  who  provides  the  payments  to the  investors.  The  delinquent  losses  are SECURITIES MONTHLY PAYMENTS  managed by the servicer & the trustee. INVESTOR 25   
  • 27. CDO is a corporate entity constructed to hold assets as collateral and to sell packages of cash flows to investors. There exists a Special Purpose Vehicle (SPV) that acquires a portfolio of credits. The assets include mortgage-backed securities, high yield corporate loans etc. The SPV issues different classes of bonds and equity and the proceeds are used to invest in other portfolios. The bonds and equity are entitled to the cash flows from the portfolio of, in accordance with the Priority of Payments. The       MECHANISM OF LEVERAGING  senior notes are paid from the cash flows before Step  #1:  Collateralized  debt  obligations the mezzanine notes and junior notes. In this (CDOs)  that  pay  an  interest  rate  over  and way, losses are first borne by the equity or above  the  cost  of  borrowing  were junior notes, next by the mezzanine notes, and purchased.  In  this instance  'AAA'  rated finally by the senior notes. In this way, the tranches  of  subprime,  mortgage‐backed securities were used.  senior notes, mezzanine notes, and equity notes offer distinctly different combinations of risk Step  #2:    Leverage  was  used  to  buy  more and return. CDOs  than  one  could  pay  for  with  capital alone.  Because  these  CDOs  paid  an interest  rate  over  and  above  the  cost  of borrowing,  every  incremental  unit  of Sub-prime crisis: A result of the Leveraging leverage  added  to  the  total  expected return.  So,  the  more  leverage  one employed, the greater the expected return Sub-prime crisis was the result of the leveraged from the trade.  instruments which were aimed to magnify the gains but resulted in amplifying the losses. Step  #3:  Credit  default  swaps  (CDS)  were used  as  insurance  against  movements  in Individuals who were not able to finance the the  credit  market.  Because  the  use  of house completely would get the help of banks. leverage  increased  the  portfolio's  overall People would put down a deposit and take out a risk  exposure,  the  next  step  involved purchasing  insurance  on  movements  in loan for the rest. Let’s say an investor puts credit  markets.  These  "insurance" down $20,000 on a $200,000 house, borrowing instruments  called  credit  default  swaps, the remaining $180,000. He now has a were designed to profit during times when leveraged ‘investment’ - with a gearing factor of credit concerns caused the bonds to fall in 10. value,  effectively  hedging  away  some  of the risk.  If house prices go up by 50% - i.e. the house Step  #4:  The  money  thus  rolled  in.  When becomes worth $300,000 - he doesn’t just make the cost of the leverage (or debt) is net out 50% of the initial investment: he makes 150% to  purchase  the  'AAA'  rated  subprime profit (once he sells, that is, and not counting debt,  as  well  as  the  cost  of  the  credit mortgage interest payments, solicitors’ fees and insurance, one is left with a positive rate of so on). Conversely, if house prices drop by just return,  which  is  often  referred  to  as "positive carry" in hedge fund lingo.   10%, his entire deposit would be wiped out. And if prices drop further, the borrower will be Box 0: Mechanism of Leveraging 26   
  • 28. in negative equity, owing the bank more than the current value of their house. Enticed by the high returns on the ever-appreciating value of housing many investment banks, hedge funds and other institutional investors have done so, making phenomenally good returns over the five years starting year 2000. Then the worst that was feared occurred- these leveraged investments started to go awry. Instead of profits, many investors have been hit by significant losses. In the above example where the individual had put down $20,000 and took a debt of $180,000, as long as he sells before the value of the asset becomes less than the value of the debt, there isn’t any problem. Till the time it is secured on an asset that’s worth at least $180,000 the actual risk is just $20,000. But what if the investor can’t set a stop-loss (as is usually the case- since the house is not just for investment purpose but is actually an asset purchased to reside). Suddenly there’s no market for what his trying to sell or if everyone is so scared that nobody wants to put a price on what his selling, for fear that it’s too low and will in turn cause them to lose vast amounts of money too, because they hold similar investments. Not long ago frenzy fed on frenzy and buoyed the prices up and now frenzy feeds on frenzy and pulling the prices down rather dramatically. Now here stands the trouble of the leveraged market. Because the leveraging factor was much higher than what the system could withstand, and because the sub-prime ‘network’ was ingrained in almost the entire financial systems of the U.S., when the debacle happened, it simply collapsed the whole system. The leveraging that helped the sector grow and propel the economy to boom is now dragging the same down. In the previous chapter we had covered the importance of the Housing sector. The effect of this importance can be gauged by a simple fact – Housing sector bust is dragging the entire U.S. economy to recession. And no matter what levels of fire-fighting that the monetary authorities undertake, the chances are that the U.S. economy has been dealt a major blow and it would take some serious and coordinated efforts to sail the boat through. That is where the U.S. economy stands today. Efforts range from prudent (cutting interest rates) to near desperate (lending money to commercial banks taking the tainted mortgage-backed securities as collateral) steps. The hope is that by accepting these investments at face value central banks will release the credit blockage and get the U.S. economy moving again. Due to the high amount of liquidity, which was somehow to be put into use, leverage was needed to boost returns over the last few years, owing to a lack of distressed debt. This led to 7 times 27   
  • 29. (and sometimes as much as 10 times) leverage on U.S. leveraged buyouts. In Europe, debt multiples also were stretched, with leverage of 5.5 times in 2007, versus 4.7 times in 1998. Thus leveraging which was intended to increase the returns and provide shelter to the people of U.S. plunged economy downwards and contributed to the chronicle of Sub-prime Crisis. In the global economy, effects in one area of investment quickly spread to others. So when institutional investors started losing money on collateralized debt obligations (CDO’s) and residential mortgage-backed securities (RMBS’s) because of the U.S. sub-prime crisis, they quickly liquidized other investments in order to cover their losses. For example, some of them shifted cash out of the carry trade (in which money borrowed in low- interest currencies such as the Yen is invested in higher interest currencies such as the Pound), causing the Yen to rapidly appreciate and leading to a whole slew of currency investors losing money on their leveraged positions. These currency investors in turn had to find the money to cover their losses, perhaps by selling gold, temporarily shifting the gold price downwards and causing a tranche of leveraged gold investors to face severe losses. And so it went on, and continues to go on. The total amount of leveraged investment in the world is unknown, but it has been estimated to be many multiples of global GDP. Thus leveraging was a double-edged sword, which was aimed at multiplying the profits, but if it acted reversely, the losses would magnify much more than the expected profits. Perhaps, that is what happened in the U.S. economy, where the reverse took place and brought the world at the verge of this crisis. The tool of leveraging mechanism i.e. the sub-prime lending provides U.S. an insight of how the construct of the sub-prime crisis took place. 28   
  • 30. SUB PRIME LENDING The Flaws The financial institutions overflowing with liquidity devised the securitization mechanism for which they classified the lending into three categories namely, The Prime category, the Alt-A category and Sub-prime category. The parameters of categorizing the credit seekers were: 1. Credit worthiness and documentation prudence 2. Ability to pay back the money 3. Ability to pay down payments 4. Whether it’s a first loan or an already mortgaged asset. While the prime category of borrowers fulfilled all the parameters, the sub-prime borrowers stood at fulfilling none. Alt-A borrowers mainly were short of documentation, including proof of income. Yet these borrowers had clean histories they either had higher loan-to-value or debt-to- income ratios. Sub-prime lending (also known as B-paper, near-prime, or second chance lending) is lending at a higher rate than the prime rate. A higher rate of interest is charged due to limited or tarnished credit history or inadequate documentation, higher loan-to-value and debt-to-income ratios. However, with the higher rates comes additional risk for lenders because there is a lack of documentation - including limited proof of the borrower's income poor credit history, and adverse financial situations usually associated with sub-prime applicants. A high risk based pricing system is used in order to calculate the terms of loans, which are offered to borrowers with varying credit histories. The sub-prime borrowers charge high rates of interest, but still credit risk is more than interest rate risks due to the increased chances of defaults and less opportunities to refinance the loans. Sub-prime lending was initially a helping hand to all those borrowers who aimed to fulfill their dream of owning a home. Sub-prime loans increased opportunities for homeownership and added 9 millions of households to the new status of homeowners in less than a decade and increased employment opportunities thereby increasing the growth rate. 29   
  • 31. However, providing loans to the low-income sections of the society was a benefit as well as fallout of the sub-prime loans. The availability of liquidity was the prominent factor that prompted the banks to provide loans at high rates, on the surety that even if the borrower fails to pay the loan amount, they may still have the option to sell the houses and recover the amount. The fact that the housing prices usually tend to appreciate, furthermore, made the bankers free from any apprehensions of recovering the losses. Also since sub-prime lending, a direct result of high liquidity, prompted banks to issue loans without any strict regulations which could help them to earn high amount of profits by the securitization mechanism as explained later. Sub-prime borrowing was as such not flawed; rather it was the high quantum of sub-prime loans granted without proper regulations that appeared to be the major reason for the fallout. The positive picture of profit earnings hid the shortcomings of improper regulations, irresponsible lending and inefficient rating system by the credit rating agencies. Sub-prime lending became highly controversial: Sub-prime lenders often engaged in predatory lending practices such as deliberately lending to borrowers who could never meet the terms of their loans, thus leading to default, seizure of collateral, and foreclosure. They often employed unscrupulous means by enticing, inducing, and/or assisting a borrower in taking a mortgage that carried high fees, a high interest rate etc. Property Fraud by Lenders: With the increase in sub-prime lending there was a similar increase in the property frauds. By selling overpriced apartments to the unsuspecting buyers, the sellers took the money and disappeared. So now the entire deal was between the banks and he borrowers. In this way the sellers, earned huge amounts on the overpriced sold houses. Second Mortgages: Irrespective of the bad credit histories, the sub-prime lending had made second mortgages easier on the existing mortgaged houses. The repayment of another loan burdened the borrowers, which ultimately had to borne by the lenders i.e. the banks, when the borrowers defaulted in making the payments. Lax Lending Rules: Analysts say lax lending standards led some mortgage firms to grant home loans to tens of thousands of borrowers who did not have the means to meet their mortgage payments when interest rates increased. Irresponsible Credit Rating Agencies: Credit rating agencies such as Standard and Poor's, Moody's and Fitch Ratings were urged by the panel to improve their influential reports and assumptions about a wide range of securities and corporations. Major Banks meanwhile were encouraged to disclose more information about the securitization of complex credit instruments, such as mortgage, credit card and student loans, which they package or cut up and sell to other banks and investors. 30   
  • 32. Besides that the other reason why the Sub-prime mortgage crisis unfolded the way it did had also to do with the complex financial wizardry that was devised around the lending that had the effect of ‘over-lending’. That is the financial systems geared up by multiples in excess of what they could or rather should have. Due to the complexity, sheer size and volume, presence of numerous players and major flaws in the sub-prime lending have all caused the system to collapse. New forces have played important roles in Sub-prime crisis that had in the post been absent. 1. Complex investments: Financial firms wield ever more sophisticated financial tools. CDOs and MBAs enabled complex and opaque investments. 2. New institutions: Players like hedge funds and buyout firms – also called Private Equity, represent a large and rising sharing of overall investment money. Hedge funds also have taken exposure to the subprime investments. These players are significantly less regulated than the listed companies-these are less transparent and generally have a free will to do pretty much what they want. Besides that Rating agency and Credit enhancers played a very important role in certifying the quality of the subprime credit. These too are outside the purview of the agencies. 3. Leverage: the growing use of Debt or leverage by financial players magnifies the first two forces. An era of easy money has enabled more risk taking built on borrowed funds. That can accentuate in both the ups and downs of a cycle, raising the chances of panic selling during down turns and frenzied buying in upturns. 4. Globalization: Today all the nations in the world are linked through easy movement of funds. In the less regulated markets money moves both in and out freely. In the medium regulated markets like India, the movement is not easy but even then the movement is copious enough to affect massive hemorrhage. This has very telling effect. In this case for example large banks across the world had exposure to the subprime conundrum. And when the damage occurred the ripple effect wiped out a lot of financial players across the globe. Given the gearing up and the various reasons as explained above, the subprime imbroglio was a time-bomb which was waiting to implode. And as it did it took down with it the most powerful economy in this globe. 31   
  • 33. THE CRISIS AND CHRONOLOGY OF EVENTS Timeline of Implosion “What began as a tremor in the sub-prime mortgage market that affected a relative few, has sadly gained momentum, creating a broader credit crisis that continues to threaten the middle class and overall economic growth.” -Senator Jack Reed The U.S. economy was at the peak of invincible growth and incessant development with every sector enjoying a boom since the past two decades. The unemployment rates were fairly low, inflation under control, stock markets scaling new heights, banking sectors overflowing with liquidity and growth figures rising steadily accounting for 26% of the worlds GDP. The American economy flooded with enormous liquidity and the low income citizens striving to fulfill their imperative dream of shelter had an incomprehensible tryst with each other and resulted in the whole sub-prime saga. As it has been said that invention is the mother of necessity the financial institutions devised an innovative mechanism of securitization with Mortgage Backed Securities and Collateral Bonds Obligations as the two offsprings. The low-income people who had tarnished credit histories or no documentation were issued loans without any such requirements to be fulfilled. The funds generated from these instruments were used to create new investment vehicles i.e. MBS’s and CDO’s that were issued to investors by the bankers at varying rates of interest depending on the ability of the borrowers to repay. The whole mechanism was a laudable creation of the financial know-how and desperately fulfilled dreams. So the sub-prime lending mechanism was an efficient fabrication of converting attractive dreams to a moneymaking business with the creation of two ingeniously thought over instruments. The boom in the housing sector, enticing interest rates and high profit margins kept on luring the financial institutions, that they shut their eyes to the pessimistic notion that if those borrowers 32   
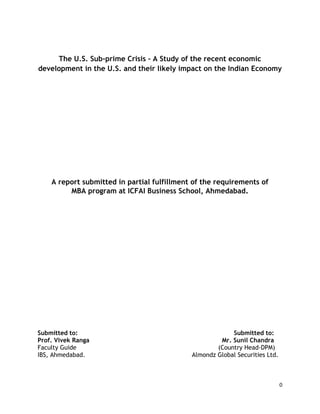
  • 34. failed to pay their debt obligations or if the collateralized houses faced a surge in the prices, the aftermath could result in the collapse in the whole banking segment on the threshold of which lies a whole economy with all the sectors interlinked to each other presenting the cascading effect. Housing markets have gone bust, interest rates have touched the pinnacles, stock markets across the world have collapsed, unemployment toll has increased, growth rates have plummeted, global inflation has been scaling to new heights, the fiscal deficit gaps are widening, corporate giants have been announcing billion dollar losses with colossal business houses being taken over at the lowest of their values. Figure 5 shows the timeline of the events. 33   
  • 35. Figure 4: Timeline of Implosion 34