SlideShare una empresa de Scribd logo
1 de 18
Descargar para leer sin conexión
“Give me an hour… and I will triple your ROI!”

“Give me an hour…
and I will triple your
ROI!”

Over the last five years, i-nexus has invested in significant research, working with nearly
80 companies to further understand the challenges and opportunities which a deployment
faces as it grows and matures. The results of this research form the Performance Improvement Maturity Model. In this paper Paul Docherty, i-nexus’ CEO, concentrates on the second stage of the model, particularly on tactics to drive a program’s Return on Investment.
In addition to the research, Paul draws on his own experience gained during 15 years as a
practitioner and deployment leader in a global telecoms company.

Introduction
In the following pages, I’ll share some of the results from our research, which understands the maturity of deployment maturity in organizations and how that evolves over time. I’ll demonstrate how you
can show your program is delivering Return on Investment, and introduce you to some practical actions you can take to drive a much greater return from the same resources.

Decision to test
water via piloting
use of Lean Six
Sigma

Decision to commit
to a company wide
Lean Six Sigma
Program

Decision to
progressively shift
responsibility for
on-going performance improvement
to Operational
Management

Decision to
align performance
improvement
activity with
strategic goals on a
company wide
basis.

Figure 1—The Lean Six Sigma Journey—the Performance Improvement Maturity Model (PIMM)

www.i-nexus.com
“Give me an hour… and I will triple your ROI!”
Let me start by sharing some interesting data. The following table shows the mean and standard deviations of key
measures associated with Return on Investment across all Performance Improvement programs surveyed during our
research:
Factor

Mean

Std Dev

Operational definition

ROI Multiple

2.5

1.5

Audited tangible financial benefits as a multiple of tangible costs.

Project Cycle
Time

8.7 Months

2.1 Months

Time from Define tollgate approval to Control tollgate
approval.

Benefits/Project

$137K

$54K

The annualised net project benefits which have been
validated by the financial controller (one year from project close date)

Concurrent
Projects/Belt

0.6

0.3

The number of currently active projects divided by the
number of trained belts (trained in last 24 months).

% Successful

63%

26%

The number of projects which pass a final tollgate review and for which net benefits are recorded in the following 12 months.
Figure 2—Survey of 41 global deployments, at three year point

This is based upon results from just over 40 global deployments, concentrating, in particular, on those companies at
the three year point of their deployment, and so I would expect them to be starting to generate a significant return.
Obviously there are some challenges in terms of comparing across different companies, but I have effectively factored out that variation to create a representative view of how companies are performing across the whole deployment.

Some key observations
Using the data as a benchmark of the real life performance of Lean and Six Sigma deployments today, the following
points stand out:
•

The number of concurrent projects per Belt is much lower than you might otherwise expect. We are training
a lot more people than actually get active and complete projects. From the point of view of getting more
from the investment, this is a huge missed opportunity.

•

There is a significant Standard Deviation on the cycle time, but projects in the real world generally take a long
time. Many people have talked about Green Belt projects lasting four months, and Black Belt projects taking
six, but the data suggests that in fact it consistently takes much, much longer to execute a DMAIC project.

•

The level of benefit being generated per project is much lower than might be expected. In reality, this is because of a large number of trailing edge projects with low levels of return (i.e. projects that could and should
have been stopped).

Finally, it should be noted that there are some very interesting interaction effects between the variables. The longer
you take to complete a project, the longer the cycle time and the lower the average benefits generated from that
project. In turn, this is matched by a lower level of overall success.

Drivers of ROI on Lean Six Sigma Programs
As a Six Sigma practitioner and somebody who has been involved with cause-effect thinking for some time, I am a
great believer in applying Six Sigma to Six Sigma, and the whole concept of “Y is a function of X”. The following
diagram illustrates the key drivers of ROI on a Lean Six Sigma Program, using a simple equation to provide a complete description of the factors that drive Return on Investment.

www.i-nexus.com
“Give me an hour… and I will triple your ROI!”

Figure 3-Drivers of ROI on a Lean Six Sigma Program.

Using this, it is very clear that if I can reduce my cycle time, I will increase my Return on Investment. Equally, if I
increase the amount of benefits generated per project investment, I drive up my Return on Investment. In the following pages, I focus on each of these areas and the top two tactics - or “uncommon practices” - that you can implement to deliver the biggest leverage effect on Return on Investment, based upon on our research and the best
practice we have observed working with different companies.

Key driver 1- Project Cycle Time
The following analysis takes the average project cycle time and breaks that into value versus non-value added time:

Figure 4-Total cycle time split by value and non-value time,
based on a sample of 500 projects taken from a population of 15,000 projects.
“Give me an hour… and I will triple your ROI!”
What this breakdown shows is that out of every eight months spent on a project, five are wasted. That time is being
squandered for a variety of reasons, but the following are key:
•

a delay in the availability of data

•

following a line of enquiry that is not leading us to the root causes

•

allowing the project to be driven by the metronome of the availability of the senior executives who are
sponsoring the program, rather than the actions that the project needs to take.

The biggest bang for the buck is to be gained from focussing on reducing the non-value adding time. One of the
tactics that we can take to reduce the amount of unproductive lines of enquiry, particularly Green and Black Belts in
the early stages of activity, is to use on-the-job coaching, either by Master Black Belts or by external consultants.
However, coaching is a well known and well practiced approach so—against this driver—I am going to focus on two
other tactics which can make a huge difference.

Right Tool. Right Job.
For over 10 years, I was a deployment leader in a telecoms company, and let me be honest that during that time I
made just about every mistake it is possible to make deploying Six Sigma. I guess this is the way to learn, but I
want to share some of my learning to avoid you making the same mistakes.
The first tactic is about choosing the right approach. Looking back, one of the worst errors I made was at the beginning of the deployment when I focussed almost exclusively on applying DMAIC, not realizing that in reality there are
other approaches you could adopt:
•

reduce variation with the DMAIC approach;

•

cut down waste through simplification (essentially the Lean approach);

•

remove complexity (Business Process Redesign or Design For Six Sigma).

Figure 5—Analysis of process capability vs. correct choice of approach

Applying an optimization approach, when you have a project that inevitably is going to require data collection, is a
very inefficient way of applying improvement. One thing I have learnt from looking at many hundreds of projects is
that, whilst there may be abundant Y data, there is very little X, cause or variable data available.
Variation Reduction projects are data heavy. When you have a process with a low frequency, there is inevitably a
long lead time to collect meaningful data, which in turn leads to a delay in the project cycle. So, simply being
smarter about what types of approach you choose can dramatically cut cycle time.
Let me give you a real example here. If you focus on a project where essentially you know you have a process frequency of less than one or two a day, and the process is not stabilized or at a level where optimization is the target,
“Give me an hour… and I will triple your ROI!”
then Lean is very much the right approach to take. The beauty of Lean is that we are really only focussing on ‘voice
of the process’, rather than ‘voice of the data’, and our data collection is usually limited to the cycle time output variable.
My experience is that setting some very simple rules about what approach gets applied to what type of project dramatically reduces cycle time, because you are not spending time unnecessarily waiting for data when you could be
driving improvement.

Immediate and brutal transparency
Many projects are elongated simply because of the Sponsor’s availability. There are a number of strategies you can
take to address this, but the most successful is what I’ve called “Immediate and Brutal Transparency”.
Let’s take the scenario where you have a project Sponsor, a project leader like a Black Belt, and an executive, with
ultimate responsibility for a portfolio within his or her business. If you can deliver a personalized report, indicating
the status of each of the projects to the Sponsor on a regular basis, you do not have to be governed by their calendar - it turns up in their inbox everyday. Ideally, - at the same time - you would deliver detailed information on the
projects to the project leaders, and a summary view with drill down capabilities to the senior executive. What you
create is a self-righting mechanism where the Sponsor knows what action they have to take to get things done, the
team understands what they have to do to get things done but critically everybody knows that the boss can see
whether it is being done.

Figure 6 - Cascading reports deliver “immediate and brutal transparency”

In my experience, this is one of the best ways to get movement in any organization, but it all comes down to immediacy. Leaving this kind of approach until later in the program will present difficulties for multiple political reasons, so
it is very important to start off on the right footing from the very beginning of the program.
“Give me an hour… and I will triple your ROI!”

Key driver 2 - Net benefits per project
The following illustrates how we normally think about a DMAIC project:•
•
•

a set of possible root causes are explored,
analysis is applied to identify a possible solution,
the solution is implemented and ultimately leveraged.

Figure 7 - Points of maximum influence on net benefits per project

However, what this really conveys is the three points in a DMAIC project cycle where you have a significant amount
of leverage on the results that the project will deliver. The first, selecting a high impact defect, is pretty well institutionalized in most large organizations. Picking a project where the impact of the defect is significant will clearly give
a better return than if you deliver against a lower impact defect. Instead, I will focus on two other areas where I
see organizations struggling to realize tangible benefits:
•

Taking the action to realize tangible benefits - sponsor follow-through

•

Ensuring follow-through on leverage opportunities - pro-active replication
“Give me an hour… and I will triple your ROI!”

Sponsor follow-through
This is a visual representation of the difference between delivering a project, which is usually the responsibility of
the Black Belt, and delivering benefits which is ultimately the responsibility of the Sponsor in the project.

Figure 8-The difference between delivering the project, and delivering its benefits

Let’s take a classic example: a labor productivity saving is made by reducing the use of another resource - less rework, for example. The bottom-line is that this will deliver some potential up-side in terms of the opportunity value
of that additional labor, but it will have no financial effect - no real ROI effect - until an action is either taken to remove those resources from the organization or redeploy them. My experience is that a lot of programs go through
the experience of making project improvements and seeing capability improvements, but do not see the benefits in
the financial sense because few projects have a direct and immediate working capital impact. Unless it’s as simple
as, for example, reducing scrap on the shopfloor, realizing real benefit requires some secondary action.
So how can you ensure this happens? One of the tactics used by a number of the companies we have worked with
and researched is to extend the concept of chartering from an executive to a team, i.e. chartering between a CEO
and the Sponsor that says, “If we commit to doing that project your personal income reward is going to be dependant upon realizing the benefits.”

Pro-active replication
It would seem fairly obvious that if you make an improvement, that that solution strategy should be replicable any
similar business units or departments that have the same or similar processes. In many of the companies that we
work with, for example global companies with 10’s if not 100’s of subsidiaries and operating units, there is a huge
multiplication opportunity available for most projects, but the reality is that it rarely happens.
Now the question is “why?” Put simply, it doesn’t happen because nothing drives it to happen. In most organizations, whilst there may be a Master Black Belt network, there is very little motivation to make replication happen, nor
is there an easy process or supporting infrastructure.
At its simplest, applying systematic replication requires two tactics:
•

At the point a project is started, look for similar examples, not just in terms of searching for project titles and key word matches, but search right into the documentation against every project to pull up as
“Give me an hour… and I will triple your ROI!”
many relevant opportunities to see if there is a solution there.
•

Provide the Master Black Belt, or the process owners in other functions around the organization with
notifications that tell them if a project has been completed or a significant event has occurred relating
to something which has interest to them.

Figure 9— Facilitating pro-active replication

Modern IT Infrastructures to support this are available today. If your current infrastructure cannot do this, it is preventing you from fully realizing Return on Investment from your program.
Of course, nothing is as simple as just IT or technology or infrastructure; everything has a human aspect to it. What
I have found is than companies that are driving Return on Investment through better replication have created an
incentive program much like licensing intellectual. Their policies allow individual business units to licence the solutions that they come up with and earn income from the benefits gained by other business units - if you like a notional cross-charging approach. That might seem like an effort to implement but, with the right infrastructure, the
approach can lead to a significant desire and drive to follow-through on the replication. Without it, new benefits
brought to a particular business unit tend to begin and end right there.
“Give me an hour… and I will triple your ROI!”

Key driver 3 - Number of projects per Belt
The third area of opportunity is around driving a greater number of projects per Belt. To help us get a greater understanding of this issue, the following data illustrates research carried out with the same companies but focusing
specifically on time taken for each activity within the project.

Figure 10- Analysis of time spent by Belts during a two month period

Taking a sample of the Green and Black Belts, my research looked at how they spent their time over a two month
period, breaking it down into hourly chunks. Whilst 2 – 4 weeks were spent training and coaching people in using
the skills of Six Sigma, Green and Black Belts were spending less than 6% of their time actually applying those hard
skills in project situations.
Now that is a little one-dimensional, because obviously there are the other aspects of planning and delegating work,
and coaching and facilitating the application of tools. However, the most important lesson here, and potentially the
opportunity to increase the amount of projects that an individual can do, lies in the vast amount of their time lost in
two key areas:
•

Managing stakeholder expectations - building consensus within stakeholders and developing those relationships

•

Driving data collection and implementing measurement systems - doing process characterization
through mapping and data collection.

If we want to drive up the number of projects implemented per Belt, we need to reduce the time spent on the softer
skill issues and push towards a greater degree of productivity from our resources.

Belt-business alignment
The first tactic addresses the amount of time spent communicating with stakeholders, by increasing the alignment
between the full and part-time resources that have been dedicated to Lean Six Sigma within the organization. This
means not just aligning the Master Black Belts with specific business units or functions, but actually driving down
and aligning individual Black Belts with the individual functions.
Although this might seem to be highly inefficient from an economy of scale perspective (an individual Black Belt cannot handle projects from multiple parts of the organization), the real efficiency of scale is the reduction in the
amount of communication required and the ability to concurrently manage more than one project in a particular
business area.
“Give me an hour… and I will triple your ROI!”
What we have seen is that this way of aligning the organization seeds more of the responsibility for project definition
and others back down to the operational leaders. In addition, it leads to a higher degree of buy-in and a stronger
belief that the project is owned by the functions themselves.

Self-service measurement system automation

Figure 11—Investment in relationships can be leveraged to minimize unnecessary communication, and maximize projects/Belt

A second tactic looks at the inordinate amount of time Belts spend collecting data. Although this issue may be less
obvious, it is responsible for causing considerable delays to projects. Many organizations have data collection or
measurement systems, but too often they are used for reporting, rather than improvement. As a result, a project
leader may have a great deal of Y data immediately available, but lack the X data needed for qualitative analysis, or
drilling further into the numbers.
Clearly, the other factor that complicates or compounds the delay is the availability of IT resources. As an ex-IT
Director in a large corporate organization, it has never been my intention to slow down Six Sigma and Lean type
activity, but I can tell you that the scarcity of IT resources to specifically develop measurement systems can have
significant effects on the project cycle time and productivity of Green and Black Belts. At the end of the day, people
are resourceful so they build measurement systems using personal productivity tools, MS Excel for example, which
allows them to collect data during the project life-cycle. However, it they adopt this approach, the data have to be
analyzed in another tool and, more importantly, the ongoing measurement system is not sustainable. It is then not
possible to leave in place a measurement system that allows the process owner to maintain that project process
control once they take over the project solution. The ability to continually maintain the process capability and drive
improvement on an ongoing basis is lost.
So the question is how do you combat that? As a company we have invested in developing the kind of solutions
which allow organizations to use the same infrastructure that they use to track program benefits and project savings
to define and build the measurement plan associated with each project. End users are therefore able to:
•
•
•
•
•

Define a measurement plan (Y and X variables)
Convert this into an manual or automated data collection system
Create and publish web-based data collection forms to ease data entry
Automatically chart this data using appropriate control charts
Enable process owners to apply simple data analysis tools

I believe that these tactics are critical to driving greater productivity in terms of individual Belts. Of course, there are
other things that can be done: give Belts the soft skills they need to be more productive; ensure that the quality of
Belts is not diluted in anyway. But these are more common practices. What I have described here are some of the
uncommon practices which give the best leverage so that instead of seeing half a project per Belt you can achieve
almost four times that level of productivity from the same resources.
“Give me an hour… and I will triple your ROI!”

Key driver 4 - Percentage successful projects
Moving on, let’s look at the next driver of ROI - the question of success. If you look at any Lean Six Sigma project
there are multiple ways to “screw that project up”.

Figure 12 - Factors contributing to project failure

Poor selection
Ultimately, the selection of the project is the first point where you can make a mistake. Classically, the project scope
is too big - you are just trying to “boil the ocean” - or the project is actually not a project solving an unknown or difficult to characterize problem. All too often, it is somebody promoting their favorite solution and characterizing it as
a Lean Six Sigma project just to make sure it gets done.
In my experience, selection is something you can address relatively easily by formalizing selection processes, enforcing clarity in terms of the defect that has actually been identified and making sure that you do not tick off projects
before you have a meaningful defect that is worth fixing.

Poor analysis
Belt coaching and training can overcome the problem of poor analysis, but actually often it is not the Belt that is the
issue, it is the Sponsor.

Poor sponsorship
The biggest issue that people face in terms of project success is that often the influence of the sponsor leads to inappropriate action being taken. Either the sponsor’s belief system leads them to want to press the accelerator, when
really the right behavior is to focus on gathering data, or they are pushing through to get action because their instincts have been trained over 10 – 15 years to make quick decisions based upon gut feel as opposed to making
rational decisions based upon collection of data. There are however a couple of tactics you can take to address the
sponsor side of ensuring project success:
“Give me an hour… and I will triple your ROI!”
A) Sponsor coaching
The first thing to consider is Sponsor coaching. Typically, senior executives in an organization have a two-day sheep
dip experience involving some degree of executive orientation. They are poorly equipped and poorly prepared for
their role, and in no position to guide their projects through to execution. What we need is an alternative strategy
which balances the investment made in training and coaching Belts.
Admittedly, increasing the amount of training offered to Sponsors is difficult, because getting a day or two days out
of their diaries is extremely challenging. However, providing on-the-job coaching at critical points in the project’s
execution, for example gate reviews, ensures the Sponsor understands their role, the critical questions they need to
be asking, and when to slow down or speed up the project.
This kind of coaching can help move from the “Ready, fire, aim” approach to “Ready, aim, fire”. In reality the problem is it’s not “Ready, fire, aim”, it ends up as ‘Ready, fire, aim okay— re-aim, fire, re-aim, fire”. Multiple attempts
to solve the problem could have been eliminated by getting straight to the root cause simply by being more thoughtful about the project solution and the project analysis.
Consequently, sponsor coaching is critical to getting a higher degree of Return on Investment from your program.

Phase

Key Question

Define

What is the defect and what is the business impact of the defect?

Measure

What is the process capability?

Analyze

What are the root causes and what evidence to we have to support our conclusions?

Improve

Do we know that the selected solution will generate a statistically significant improvement in process capability?

Control (i)

Have we achieved our planned capability improvement?

Control (ii)

Have the process owners taken full responsibility for on-going management of the
process?

Control (iii)

Have we locked in the gains by fully standardizing the process?

Control (iv)

Have we summarized the learning and communicated and celebrated the success?

Transfer

Have we identified all logical opportunities for leverage of the project solution?
Figure 13—Example questions for Gate Reviews
“Give me an hour… and I will triple your ROI!”
B) Common (simple) MAAR format for the project story
I’ve been to many, many different project reviews, and what I usually see is a very long and complex story being
told, with most people disengaging, or loosing the thread. A better alternative is that you use your tool experts your Master Black Belts - to validate the application of the tools, and use the project reviews to simply tell the story
of the project, the opportunities that lie behind it, and to drive ownership of the ongoing improvements.

Figure 14 - Using a MAAR chart format to simply tell the project’s story

The MAAR chart format illustrated above is a simple but effective way of doing this. It gives a clear view of the life
of the project as a control chart from the point the Y measure was implemented, shows the progress of actions that
have been taken, highlights the biggest areas of opportunity and illustrates the impact on the root cause over time.
Using this format can lead to a much tighter focus on what the project is about and less wasted energy and time
working on projects that ultimately have no clear impact on the Y measure. When actions are taken you can clearly
see if there is a consequential improvement in the process capability. In addition, this kind of approach leads to a
greater degree of buy-in by the executives because they understand they are trying to move the dial and how that is
connected to the actions that are being taken.
So in terms of driving project completion, it may sound counter-intuitive but coaching Sponsors and telling the project’s story in a simpler and more direct way effectively ensures projects do not go on for ever, successful projects
are given the support they need, and those that are less likely to be successful are killed at the earliest possible
point in the process.
“Give me an hour… and I will triple your ROI!”

Key driver 5 - Reducing the cost of the program
This is an analysis of 12 organizations, showing the cumulative average cost of their program over the last three
years.

Figure 15—Tangible costs for typical LSS deployment in $1Bn SBU:
100 projects per year; 20 Black Belts; 80 Green Belts.

My research team also looked at what had been spent in tangible “above the water” iceberg expenses vs. the intangible ’lost opportunity’ costs sitting below the water line.

Figure 16—Tangible costs vs hidden costs
“Give me an hour… and I will triple your ROI!”
One key finding right up front was that the investments made to get the right people, or to track and drive the reporting out of the program to create transparency and engagement were a very small fraction of the total three-year
investment.
Of course, there were costs that were more difficult to account for, so that there is a degree of subjectivity here.
However, it is clear the majority of the cost was invested in paying salaries and funding the training program of the
full time people. Above and before all else, it is this investment that must pay back.
This leads to the following simple piece of advice: recognize that the primary issue lies in making sure that you do
not waste your training investment. You have to avoid the perception that getting on to Six Sigma training is an
easy thing or that the deployment organization is crying out for Black Belts.

Maximize training investment - introduce the “3 strikes rule”
My research showed that the companies that had done the best at making training effective had introduced a version of what we call the ‘three strikes rule’:
Strike 1:
First Warning

Poor/non-existent Charter before first module of Belt training

Strike 2:
Second Warning

No updated Charter within one week of completing first module

Strike 3:
You’re Out

Define tollgate review not completed before the second module
of Belt training
Figure 17— The Three Strikes Rule

Whilst it won’t help the “Number of Belts trained” KPI, adopting this approach will drive Sponsor and Belt behavior.
Introduce the importance of engagement and performance right from the start by saying that actually getting on to
a training course, or being sponsored on to DMAIC or other Lean training courses, requires you to come with a fully
thought through project charter. Failure to deliver at the early stages of the cycle, results in a warning - a first
strike.
If within a week of getting back from the first module of Black or Green Belt training, you have not produced an updated Charter that the project sponsor is signed into, that’s strike two. This leaves only one more chance and that is
to make sure you have completed the Define gate tollgate before the second week of training.
With the right infrastructure it is very easy to be able to generate a report on any training courses that are taking
place, to see who is falling foul of these three-strike rules. What we have found is that by rigorously enforcing these,
you reach a much higher level of productivity because the Belts you train actually deliver and are encouraged to
continue to deliver through the period they may actually be in rotation as Green or Black Belts. Not only that, you
also get a reduction in training costs because you do not waste energy on poorly formed and inappropriately scoped
projects or people who are not buying in.
Automated reporting from “one set of numbers”
Let me characterize for you what I believe to be the situation that exists in many, many different organizations today in terms of how Six Sigma is being reported and managed as a program. The reality of this is not unfamiliar to
me because this is exactly how I felt in the mid- to late-90s when I was running a large scale program myself. What
you have is a situation where Belts are communicating with the Master Black Belts on progress. They are communicating with Sponsors. The corporate deployment lead is trying to pull a picture together from different business
groups to present a picture to the executives and the CEO. And everyone is storing information in multiple different
places, whether that is shared drives or local drives, so that in fact you have several different versions of the truth
and every one is different. At any point in time every organization is struggling to answer the question “What is the
benefit that I have delivered from this Six Sigma Program - what is my ROI?”
“Give me an hour… and I will triple your ROI!”

Figure 18—“Many views of the truth”:
Inconsistent operational definitions, significant lag—and significant cost

With this kind of lag and this kind of inconsistency in operational definitions, most organizations loose faith, with the
financial controllers in particular doubting whether the numbers are meaningful. In addition, people loose commitment because there is such a big difference between the time when the target is set and the point when it is realized.

Clearly there is an alternative - one common set of operational definitions of how things are recorded, a single repository and, more critically, technology pushing out reporting on a personalized basis, so that information is delivered in real-time as it is updated.
“Give me an hour… and I will triple your ROI!”
Adopting this approach drives the pull on the Black Belts, Green Belts and team members to maintain the information that is a by-product of implementing their project. It also drives the pull on executives because they know their
boss can see what is happening. Finally, it drives the pull on being able to do financial validation and tool validation
within the same repository, so that there is tracking of whether things are actually being validated and agreed in
real-time. In short, it gives you what is essentially a common operating system for your program and creates a much
greater focus on cost.

In Conclusion
In the previous pages, we have outlined some of the key tactics which can drive ROI. In the few remaining pages, I
will give you some idea of the potential impact of moving just one of the main ROI drivers.
Let’s consider the benefits from reducing cycle-time. The following illustrates an organization performing at a typical
level, perhaps a US$1Bn strategic business unit of a large global company or even a US$1Bn operating business itself. In a typical scenario, we would expect that company at a three year point to have deployed around 100 active
Belts (20% Black Belt, 80% Green Belt) with around 0.6 projects per Belt. In terms of benefits, it would be generating $127K per project, based on an 8.7 month cycle time. That amounts to around $11.3M of benefits per year, or,
as an ROI multiple, around about 1:2 – 3:1 as a normal ROI multiple.
However, just cutting cycle time by two months can drive significantly higher benefits per year. Using the typical
deployment described above, the program returns $15M rather than $11M, effectively adding a further third of the
benefits again for implementing some of the simple tactics outlined in this paper.

Keeping a laser focus - the LSS Program Dashboard
Much of this relies on having the ability to pull information together, and drive it out at the appropriate time, and in
an accessible format. With the right infrastructure, you can simply implement a Lean Six Sigma ROI Program
Dashboard. This will plug straight into your project infrastructure so that it automatically reports on, for example
net savings per project, and more importantly enables you to tell the story of your own improvement.

Figure 20—An example LSS Program Dashboard, driven by i-nexus’ software

Given the potential impact of reducing project cycle time by as little as two months, it is clearly worth shifting some
resources to focus on this task. A program dashboard or scorecard will help to keep the program office focused on
their mission, to scale and replicate their program and drive up ROI.
“Give me an hour… and I will triple your ROI!”

About the Author
Paul Docherty is the CEO of i-nexus, the leading provider of enterprise software to enable strategy execution. Paul
started his career in Marconi, the telecoms equipment provider, where he held a wide range of management roles
covering manufacturing, IT, sales, product development, project management, Six Sigma and corporate strategy as
well as having P&L responsibility for the growth of a regional services business. Paul holds a MEng in Computer Systems and Software Engineering from the University of York and an MBA from the University of Warwick.
His understanding of the challenges of embedding Six Sigma and other performance improvement methodologies
into the fabric of organizations comes from his experience coaching senior management teams in many Global 500
companies and from leading the deployment of Six Sigma at Marconi. Paul was a co-founder of i-solutions Global in
2001, and has spearheaded its rapid expansion into the preferred global deployment partner for Lean Six Sigma and
Strategy Execution programs.
He can be contacted on paul.docherty@i-nexus.com or by telephone on +44 (0)7985 117784 (mobile), +44 (0)24
7660 8865 (desk).

About i-nexus
i-nexus is the leading provider of web-based software for formulating, aligning and executing performance improvement in Global 500 leaders worldwide. Client companies include organizations such as Pfizer, BT, Royal Bank of
Scotland, ALSTOM, AREVA, Staples, Hager, Vodafone, Carl Zeiss, CIBA Vision, Network Rail and Xchanging.
i-nexus provides a tailored range of solutions. Beginning with simple deployment and training support, and expanding out beyond the project tracking needs of Lean and Six Sigma improvement programs, i-nexus can provide
the infrastructure that enables strategy mapping, cascaded scorecards, corporate objective alignment and strategy
execution. i-nexus solutions are underpinned by powerful business intelligence capabilities which deliver executive
and senior management reports on demand, in real-time or on a scheduled basis.
i-nexus is headquartered in Coventry, UK, with regional offices in Europe, North America and Asia.
To find out more about how i-nexus can help you to reduce project cycle times, increase project success rates and
cut the cost of managing your portfolio:
•

Email: sales@i-nexus.com

•

Call European office: +44 (0)845 607 0063

•

Call Americas office: +1 (617) 267 9595

•

Visit: www.i-nexus.com

Más contenido relacionado

La actualidad más candente

It project management and best practices
It project management and best practicesIt project management and best practices
It project management and best practicesNaresh Pokhriyal
 
Why Projects Fail: Obstacles and Solutions
Why Projects Fail: Obstacles and SolutionsWhy Projects Fail: Obstacles and Solutions
Why Projects Fail: Obstacles and SolutionsMichael Krigsman
 
Using the DMAIC Process for SEO Projects
Using the DMAIC Process for SEO ProjectsUsing the DMAIC Process for SEO Projects
Using the DMAIC Process for SEO Projectsunevendock6891
 
Lean Projects with A3 Method
Lean Projects with A3 MethodLean Projects with A3 Method
Lean Projects with A3 MethodNitor
 
Breaking the Project Failure Cycle
Breaking the Project Failure CycleBreaking the Project Failure Cycle
Breaking the Project Failure CycleGlen Alleman
 
10 tips to rescue a problem project
10 tips to rescue a problem project10 tips to rescue a problem project
10 tips to rescue a problem projectgianarosetti
 
Applying PDCA, A3 Thinking & Problem Solving
Applying PDCA, A3 Thinking & Problem SolvingApplying PDCA, A3 Thinking & Problem Solving
Applying PDCA, A3 Thinking & Problem SolvingLean Enterprise Academy
 
Critical Chain Project Management
Critical Chain Project ManagementCritical Chain Project Management
Critical Chain Project ManagementShyam Kerkar
 
Project Mgmt Fundamentals
Project Mgmt FundamentalsProject Mgmt Fundamentals
Project Mgmt FundamentalsChris Miller
 
Agile Program Management: Moving from Principles to Practice
Agile Program Management: Moving from Principles to PracticeAgile Program Management: Moving from Principles to Practice
Agile Program Management: Moving from Principles to PracticeGlen Alleman
 
importance of resources allocation in formal method of software engineering ...
 importance of resources allocation in formal method of software engineering ... importance of resources allocation in formal method of software engineering ...
importance of resources allocation in formal method of software engineering ...Abdul Naqashbandi
 
Why Scheduling Mustn't Be Allowed to Become an Extinct Science
Why Scheduling Mustn't Be Allowed to Become an Extinct ScienceWhy Scheduling Mustn't Be Allowed to Become an Extinct Science
Why Scheduling Mustn't Be Allowed to Become an Extinct ScienceAcumen
 
How to drive your project into success?
How to drive your project into success?How to drive your project into success?
How to drive your project into success?Jouni Ruotanen
 
Managing the portfolio
Managing the portfolioManaging the portfolio
Managing the portfolioStuart Robb
 
Presentation by mangesh sardesai
Presentation by mangesh sardesaiPresentation by mangesh sardesai
Presentation by mangesh sardesaiPMI_IREP_TP
 
Business plan template
Business plan templateBusiness plan template
Business plan templateInsightory
 
Immutable principles of project management
Immutable principles of project managementImmutable principles of project management
Immutable principles of project managementGlen Alleman
 

La actualidad más candente (20)

It project management and best practices
It project management and best practicesIt project management and best practices
It project management and best practices
 
Why Projects Fail: Obstacles and Solutions
Why Projects Fail: Obstacles and SolutionsWhy Projects Fail: Obstacles and Solutions
Why Projects Fail: Obstacles and Solutions
 
Using the DMAIC Process for SEO Projects
Using the DMAIC Process for SEO ProjectsUsing the DMAIC Process for SEO Projects
Using the DMAIC Process for SEO Projects
 
Lean Projects with A3 Method
Lean Projects with A3 MethodLean Projects with A3 Method
Lean Projects with A3 Method
 
Breaking the Project Failure Cycle
Breaking the Project Failure CycleBreaking the Project Failure Cycle
Breaking the Project Failure Cycle
 
Agile Paper Cutter
Agile Paper CutterAgile Paper Cutter
Agile Paper Cutter
 
10 tips to rescue a problem project
10 tips to rescue a problem project10 tips to rescue a problem project
10 tips to rescue a problem project
 
Applying PDCA, A3 Thinking & Problem Solving
Applying PDCA, A3 Thinking & Problem SolvingApplying PDCA, A3 Thinking & Problem Solving
Applying PDCA, A3 Thinking & Problem Solving
 
Critical Chain Project Management
Critical Chain Project ManagementCritical Chain Project Management
Critical Chain Project Management
 
Project Mgmt Fundamentals
Project Mgmt FundamentalsProject Mgmt Fundamentals
Project Mgmt Fundamentals
 
Agile Program Management: Moving from Principles to Practice
Agile Program Management: Moving from Principles to PracticeAgile Program Management: Moving from Principles to Practice
Agile Program Management: Moving from Principles to Practice
 
importance of resources allocation in formal method of software engineering ...
 importance of resources allocation in formal method of software engineering ... importance of resources allocation in formal method of software engineering ...
importance of resources allocation in formal method of software engineering ...
 
Why Scheduling Mustn't Be Allowed to Become an Extinct Science
Why Scheduling Mustn't Be Allowed to Become an Extinct ScienceWhy Scheduling Mustn't Be Allowed to Become an Extinct Science
Why Scheduling Mustn't Be Allowed to Become an Extinct Science
 
How to drive your project into success?
How to drive your project into success?How to drive your project into success?
How to drive your project into success?
 
Managing the portfolio
Managing the portfolioManaging the portfolio
Managing the portfolio
 
Project Planning
Project Planning Project Planning
Project Planning
 
Critical chain project management - Gary Palmer
Critical chain project management - Gary PalmerCritical chain project management - Gary Palmer
Critical chain project management - Gary Palmer
 
Presentation by mangesh sardesai
Presentation by mangesh sardesaiPresentation by mangesh sardesai
Presentation by mangesh sardesai
 
Business plan template
Business plan templateBusiness plan template
Business plan template
 
Immutable principles of project management
Immutable principles of project managementImmutable principles of project management
Immutable principles of project management
 

Destacado

Lesson 5
Lesson 5Lesson 5
Lesson 5llaguna
 
Antonio batista portefolio
Antonio batista portefolioAntonio batista portefolio
Antonio batista portefolioAntonio Batista
 
PIMM overview whitepaper
PIMM overview whitepaperPIMM overview whitepaper
PIMM overview whitepaperi-nexus
 
Music Magazine Evalution - Question 1
Music Magazine Evalution - Question 1Music Magazine Evalution - Question 1
Music Magazine Evalution - Question 1wiltindall
 
Lesson 4: God
Lesson 4: GodLesson 4: God
Lesson 4: Godllaguna
 
i-nexus Case Study at Novartis
i-nexus Case Study at Novartisi-nexus Case Study at Novartis
i-nexus Case Study at Novartisi-nexus
 
Project prioritization becomes more strategic
Project prioritization becomes more strategicProject prioritization becomes more strategic
Project prioritization becomes more strategici-nexus
 
Taking your pex program to the next level pex webinar july 2016
Taking your pex program to the next level   pex webinar july 2016Taking your pex program to the next level   pex webinar july 2016
Taking your pex program to the next level pex webinar july 2016i-nexus
 
Lesson 1: David's Mighty Three
Lesson 1: David's Mighty ThreeLesson 1: David's Mighty Three
Lesson 1: David's Mighty Threellaguna
 
Getting six sigma into the DNA of your organisation
Getting six sigma into the DNA of your organisationGetting six sigma into the DNA of your organisation
Getting six sigma into the DNA of your organisationi-nexus
 
Lesson 2: The Way To Wisdom
Lesson 2: The Way To WisdomLesson 2: The Way To Wisdom
Lesson 2: The Way To Wisdomllaguna
 
Lesson 6
Lesson 6Lesson 6
Lesson 6llaguna
 

Destacado (12)

Lesson 5
Lesson 5Lesson 5
Lesson 5
 
Antonio batista portefolio
Antonio batista portefolioAntonio batista portefolio
Antonio batista portefolio
 
PIMM overview whitepaper
PIMM overview whitepaperPIMM overview whitepaper
PIMM overview whitepaper
 
Music Magazine Evalution - Question 1
Music Magazine Evalution - Question 1Music Magazine Evalution - Question 1
Music Magazine Evalution - Question 1
 
Lesson 4: God
Lesson 4: GodLesson 4: God
Lesson 4: God
 
i-nexus Case Study at Novartis
i-nexus Case Study at Novartisi-nexus Case Study at Novartis
i-nexus Case Study at Novartis
 
Project prioritization becomes more strategic
Project prioritization becomes more strategicProject prioritization becomes more strategic
Project prioritization becomes more strategic
 
Taking your pex program to the next level pex webinar july 2016
Taking your pex program to the next level   pex webinar july 2016Taking your pex program to the next level   pex webinar july 2016
Taking your pex program to the next level pex webinar july 2016
 
Lesson 1: David's Mighty Three
Lesson 1: David's Mighty ThreeLesson 1: David's Mighty Three
Lesson 1: David's Mighty Three
 
Getting six sigma into the DNA of your organisation
Getting six sigma into the DNA of your organisationGetting six sigma into the DNA of your organisation
Getting six sigma into the DNA of your organisation
 
Lesson 2: The Way To Wisdom
Lesson 2: The Way To WisdomLesson 2: The Way To Wisdom
Lesson 2: The Way To Wisdom
 
Lesson 6
Lesson 6Lesson 6
Lesson 6
 

Similar a Give Me an Hour and i will triple your ROI

Increasing Vehicle Outsourcing ( % Of Car Value ) Essay
Increasing Vehicle Outsourcing ( % Of Car Value ) EssayIncreasing Vehicle Outsourcing ( % Of Car Value ) Essay
Increasing Vehicle Outsourcing ( % Of Car Value ) EssayAlison Reed
 
SFScon 2020 - Elia Rigo - A study about Project Management techniques in virt...
SFScon 2020 - Elia Rigo - A study about Project Management techniques in virt...SFScon 2020 - Elia Rigo - A study about Project Management techniques in virt...
SFScon 2020 - Elia Rigo - A study about Project Management techniques in virt...South Tyrol Free Software Conference
 
OL_04-05_IPE 4111_ Project Selection.pptx
OL_04-05_IPE 4111_ Project Selection.pptxOL_04-05_IPE 4111_ Project Selection.pptx
OL_04-05_IPE 4111_ Project Selection.pptxSajibDas40
 
OL_04-05_IPE 4111_ Project Selection.pptx
OL_04-05_IPE 4111_ Project Selection.pptxOL_04-05_IPE 4111_ Project Selection.pptx
OL_04-05_IPE 4111_ Project Selection.pptxSajibDas40
 
OL_04-05_IPE 4111_ Project Selection.pptx
OL_04-05_IPE 4111_ Project Selection.pptxOL_04-05_IPE 4111_ Project Selection.pptx
OL_04-05_IPE 4111_ Project Selection.pptxSajibDas40
 
The five most critical project metrics
The five most critical project metricsThe five most critical project metrics
The five most critical project metricsDadunoor Kamati
 
about start up for you 12
about start up for you 12about start up for you 12
about start up for you 12aliaalistartup
 
Asset Finance Systems: Project Initiation "101"
Asset Finance Systems: Project Initiation "101"Asset Finance Systems: Project Initiation "101"
Asset Finance Systems: Project Initiation "101"David Pedreno
 
Professional Project Manager Should Be Proficient in Agile
Professional Project Manager Should Be Proficient in AgileProfessional Project Manager Should Be Proficient in Agile
Professional Project Manager Should Be Proficient in AgileNitor
 
Visual project management simplifying project execution to deliver on time an...
Visual project management simplifying project execution to deliver on time an...Visual project management simplifying project execution to deliver on time an...
Visual project management simplifying project execution to deliver on time an...ssuser52fa40
 
Operational Excellence – Getting Started
Operational Excellence – Getting StartedOperational Excellence – Getting Started
Operational Excellence – Getting StartedRonald Shewchuk
 
Asset Finance Systems: Project Initiation "101"
Asset Finance Systems: Project Initiation "101"Asset Finance Systems: Project Initiation "101"
Asset Finance Systems: Project Initiation "101"David Pedreno
 
Project Benefit Validation - Lean Six Sigma
Project Benefit  Validation - Lean Six SigmaProject Benefit  Validation - Lean Six Sigma
Project Benefit Validation - Lean Six SigmaWillowTree Advisors
 
Making Digital Teams more Efficient
Making Digital Teams more EfficientMaking Digital Teams more Efficient
Making Digital Teams more EfficientJulian Chow
 
Guide to better Project Management from Severa
Guide to better Project Management from SeveraGuide to better Project Management from Severa
Guide to better Project Management from SeveraSevera PSA
 
Starting a SPC project blog series
Starting a SPC project blog seriesStarting a SPC project blog series
Starting a SPC project blog seriesInfodream
 
PMO and PPM Best Practices
PMO and PPM Best PracticesPMO and PPM Best Practices
PMO and PPM Best PracticesJeff McClay
 
LABP in ASQ Six Sigma Forum
LABP in ASQ Six Sigma ForumLABP in ASQ Six Sigma Forum
LABP in ASQ Six Sigma ForumWilliam Peterson
 
Minimum Viable Bureaucracy- A Practical Approach to Scaling Agile Project Man...
Minimum Viable Bureaucracy- A Practical Approach to Scaling Agile Project Man...Minimum Viable Bureaucracy- A Practical Approach to Scaling Agile Project Man...
Minimum Viable Bureaucracy- A Practical Approach to Scaling Agile Project Man...Dialexa
 

Similar a Give Me an Hour and i will triple your ROI (20)

Increasing Vehicle Outsourcing ( % Of Car Value ) Essay
Increasing Vehicle Outsourcing ( % Of Car Value ) EssayIncreasing Vehicle Outsourcing ( % Of Car Value ) Essay
Increasing Vehicle Outsourcing ( % Of Car Value ) Essay
 
SFScon 2020 - Elia Rigo - A study about Project Management techniques in virt...
SFScon 2020 - Elia Rigo - A study about Project Management techniques in virt...SFScon 2020 - Elia Rigo - A study about Project Management techniques in virt...
SFScon 2020 - Elia Rigo - A study about Project Management techniques in virt...
 
Tools guide
Tools guideTools guide
Tools guide
 
OL_04-05_IPE 4111_ Project Selection.pptx
OL_04-05_IPE 4111_ Project Selection.pptxOL_04-05_IPE 4111_ Project Selection.pptx
OL_04-05_IPE 4111_ Project Selection.pptx
 
OL_04-05_IPE 4111_ Project Selection.pptx
OL_04-05_IPE 4111_ Project Selection.pptxOL_04-05_IPE 4111_ Project Selection.pptx
OL_04-05_IPE 4111_ Project Selection.pptx
 
OL_04-05_IPE 4111_ Project Selection.pptx
OL_04-05_IPE 4111_ Project Selection.pptxOL_04-05_IPE 4111_ Project Selection.pptx
OL_04-05_IPE 4111_ Project Selection.pptx
 
The five most critical project metrics
The five most critical project metricsThe five most critical project metrics
The five most critical project metrics
 
about start up for you 12
about start up for you 12about start up for you 12
about start up for you 12
 
Asset Finance Systems: Project Initiation "101"
Asset Finance Systems: Project Initiation "101"Asset Finance Systems: Project Initiation "101"
Asset Finance Systems: Project Initiation "101"
 
Professional Project Manager Should Be Proficient in Agile
Professional Project Manager Should Be Proficient in AgileProfessional Project Manager Should Be Proficient in Agile
Professional Project Manager Should Be Proficient in Agile
 
Visual project management simplifying project execution to deliver on time an...
Visual project management simplifying project execution to deliver on time an...Visual project management simplifying project execution to deliver on time an...
Visual project management simplifying project execution to deliver on time an...
 
Operational Excellence – Getting Started
Operational Excellence – Getting StartedOperational Excellence – Getting Started
Operational Excellence – Getting Started
 
Asset Finance Systems: Project Initiation "101"
Asset Finance Systems: Project Initiation "101"Asset Finance Systems: Project Initiation "101"
Asset Finance Systems: Project Initiation "101"
 
Project Benefit Validation - Lean Six Sigma
Project Benefit  Validation - Lean Six SigmaProject Benefit  Validation - Lean Six Sigma
Project Benefit Validation - Lean Six Sigma
 
Making Digital Teams more Efficient
Making Digital Teams more EfficientMaking Digital Teams more Efficient
Making Digital Teams more Efficient
 
Guide to better Project Management from Severa
Guide to better Project Management from SeveraGuide to better Project Management from Severa
Guide to better Project Management from Severa
 
Starting a SPC project blog series
Starting a SPC project blog seriesStarting a SPC project blog series
Starting a SPC project blog series
 
PMO and PPM Best Practices
PMO and PPM Best PracticesPMO and PPM Best Practices
PMO and PPM Best Practices
 
LABP in ASQ Six Sigma Forum
LABP in ASQ Six Sigma ForumLABP in ASQ Six Sigma Forum
LABP in ASQ Six Sigma Forum
 
Minimum Viable Bureaucracy- A Practical Approach to Scaling Agile Project Man...
Minimum Viable Bureaucracy- A Practical Approach to Scaling Agile Project Man...Minimum Viable Bureaucracy- A Practical Approach to Scaling Agile Project Man...
Minimum Viable Bureaucracy- A Practical Approach to Scaling Agile Project Man...
 

Último

Digital Transformation in the PLM domain - distrib.pdf
Digital Transformation in the PLM domain - distrib.pdfDigital Transformation in the PLM domain - distrib.pdf
Digital Transformation in the PLM domain - distrib.pdfJos Voskuil
 
Annual General Meeting Presentation Slides
Annual General Meeting Presentation SlidesAnnual General Meeting Presentation Slides
Annual General Meeting Presentation SlidesKeppelCorporation
 
8447779800, Low rate Call girls in Saket Delhi NCR
8447779800, Low rate Call girls in Saket Delhi NCR8447779800, Low rate Call girls in Saket Delhi NCR
8447779800, Low rate Call girls in Saket Delhi NCRashishs7044
 
Global Scenario On Sustainable and Resilient Coconut Industry by Dr. Jelfina...
Global Scenario On Sustainable  and Resilient Coconut Industry by Dr. Jelfina...Global Scenario On Sustainable  and Resilient Coconut Industry by Dr. Jelfina...
Global Scenario On Sustainable and Resilient Coconut Industry by Dr. Jelfina...ictsugar
 
Youth Involvement in an Innovative Coconut Value Chain by Mwalimu Menza
Youth Involvement in an Innovative Coconut Value Chain by Mwalimu MenzaYouth Involvement in an Innovative Coconut Value Chain by Mwalimu Menza
Youth Involvement in an Innovative Coconut Value Chain by Mwalimu Menzaictsugar
 
Ms Motilal Padampat Sugar Mills vs. State of Uttar Pradesh & Ors. - A Milesto...
Ms Motilal Padampat Sugar Mills vs. State of Uttar Pradesh & Ors. - A Milesto...Ms Motilal Padampat Sugar Mills vs. State of Uttar Pradesh & Ors. - A Milesto...
Ms Motilal Padampat Sugar Mills vs. State of Uttar Pradesh & Ors. - A Milesto...ShrutiBose4
 
India Consumer 2024 Redacted Sample Report
India Consumer 2024 Redacted Sample ReportIndia Consumer 2024 Redacted Sample Report
India Consumer 2024 Redacted Sample ReportMintel Group
 
Ten Organizational Design Models to align structure and operations to busines...
Ten Organizational Design Models to align structure and operations to busines...Ten Organizational Design Models to align structure and operations to busines...
Ten Organizational Design Models to align structure and operations to busines...Seta Wicaksana
 
Kenya Coconut Production Presentation by Dr. Lalith Perera
Kenya Coconut Production Presentation by Dr. Lalith PereraKenya Coconut Production Presentation by Dr. Lalith Perera
Kenya Coconut Production Presentation by Dr. Lalith Pereraictsugar
 
IoT Insurance Observatory: summary 2024
IoT Insurance Observatory:  summary 2024IoT Insurance Observatory:  summary 2024
IoT Insurance Observatory: summary 2024Matteo Carbone
 
8447779800, Low rate Call girls in Kotla Mubarakpur Delhi NCR
8447779800, Low rate Call girls in Kotla Mubarakpur Delhi NCR8447779800, Low rate Call girls in Kotla Mubarakpur Delhi NCR
8447779800, Low rate Call girls in Kotla Mubarakpur Delhi NCRashishs7044
 
8447779800, Low rate Call girls in New Ashok Nagar Delhi NCR
8447779800, Low rate Call girls in New Ashok Nagar Delhi NCR8447779800, Low rate Call girls in New Ashok Nagar Delhi NCR
8447779800, Low rate Call girls in New Ashok Nagar Delhi NCRashishs7044
 
Memorándum de Entendimiento (MoU) entre Codelco y SQM
Memorándum de Entendimiento (MoU) entre Codelco y SQMMemorándum de Entendimiento (MoU) entre Codelco y SQM
Memorándum de Entendimiento (MoU) entre Codelco y SQMVoces Mineras
 
Call US-88OO1O2216 Call Girls In Mahipalpur Female Escort Service
Call US-88OO1O2216 Call Girls In Mahipalpur Female Escort ServiceCall US-88OO1O2216 Call Girls In Mahipalpur Female Escort Service
Call US-88OO1O2216 Call Girls In Mahipalpur Female Escort Servicecallgirls2057
 
Marketplace and Quality Assurance Presentation - Vincent Chirchir
Marketplace and Quality Assurance Presentation - Vincent ChirchirMarketplace and Quality Assurance Presentation - Vincent Chirchir
Marketplace and Quality Assurance Presentation - Vincent Chirchirictsugar
 
Case study on tata clothing brand zudio in detail
Case study on tata clothing brand zudio in detailCase study on tata clothing brand zudio in detail
Case study on tata clothing brand zudio in detailAriel592675
 
Call Us 📲8800102216📞 Call Girls In DLF City Gurgaon
Call Us 📲8800102216📞 Call Girls In DLF City GurgaonCall Us 📲8800102216📞 Call Girls In DLF City Gurgaon
Call Us 📲8800102216📞 Call Girls In DLF City Gurgaoncallgirls2057
 
Innovation Conference 5th March 2024.pdf
Innovation Conference 5th March 2024.pdfInnovation Conference 5th March 2024.pdf
Innovation Conference 5th March 2024.pdfrichard876048
 

Último (20)

Digital Transformation in the PLM domain - distrib.pdf
Digital Transformation in the PLM domain - distrib.pdfDigital Transformation in the PLM domain - distrib.pdf
Digital Transformation in the PLM domain - distrib.pdf
 
Call Us ➥9319373153▻Call Girls In North Goa
Call Us ➥9319373153▻Call Girls In North GoaCall Us ➥9319373153▻Call Girls In North Goa
Call Us ➥9319373153▻Call Girls In North Goa
 
Annual General Meeting Presentation Slides
Annual General Meeting Presentation SlidesAnnual General Meeting Presentation Slides
Annual General Meeting Presentation Slides
 
8447779800, Low rate Call girls in Saket Delhi NCR
8447779800, Low rate Call girls in Saket Delhi NCR8447779800, Low rate Call girls in Saket Delhi NCR
8447779800, Low rate Call girls in Saket Delhi NCR
 
No-1 Call Girls In Goa 93193 VIP 73153 Escort service In North Goa Panaji, Ca...
No-1 Call Girls In Goa 93193 VIP 73153 Escort service In North Goa Panaji, Ca...No-1 Call Girls In Goa 93193 VIP 73153 Escort service In North Goa Panaji, Ca...
No-1 Call Girls In Goa 93193 VIP 73153 Escort service In North Goa Panaji, Ca...
 
Global Scenario On Sustainable and Resilient Coconut Industry by Dr. Jelfina...
Global Scenario On Sustainable  and Resilient Coconut Industry by Dr. Jelfina...Global Scenario On Sustainable  and Resilient Coconut Industry by Dr. Jelfina...
Global Scenario On Sustainable and Resilient Coconut Industry by Dr. Jelfina...
 
Youth Involvement in an Innovative Coconut Value Chain by Mwalimu Menza
Youth Involvement in an Innovative Coconut Value Chain by Mwalimu MenzaYouth Involvement in an Innovative Coconut Value Chain by Mwalimu Menza
Youth Involvement in an Innovative Coconut Value Chain by Mwalimu Menza
 
Ms Motilal Padampat Sugar Mills vs. State of Uttar Pradesh & Ors. - A Milesto...
Ms Motilal Padampat Sugar Mills vs. State of Uttar Pradesh & Ors. - A Milesto...Ms Motilal Padampat Sugar Mills vs. State of Uttar Pradesh & Ors. - A Milesto...
Ms Motilal Padampat Sugar Mills vs. State of Uttar Pradesh & Ors. - A Milesto...
 
India Consumer 2024 Redacted Sample Report
India Consumer 2024 Redacted Sample ReportIndia Consumer 2024 Redacted Sample Report
India Consumer 2024 Redacted Sample Report
 
Ten Organizational Design Models to align structure and operations to busines...
Ten Organizational Design Models to align structure and operations to busines...Ten Organizational Design Models to align structure and operations to busines...
Ten Organizational Design Models to align structure and operations to busines...
 
Kenya Coconut Production Presentation by Dr. Lalith Perera
Kenya Coconut Production Presentation by Dr. Lalith PereraKenya Coconut Production Presentation by Dr. Lalith Perera
Kenya Coconut Production Presentation by Dr. Lalith Perera
 
IoT Insurance Observatory: summary 2024
IoT Insurance Observatory:  summary 2024IoT Insurance Observatory:  summary 2024
IoT Insurance Observatory: summary 2024
 
8447779800, Low rate Call girls in Kotla Mubarakpur Delhi NCR
8447779800, Low rate Call girls in Kotla Mubarakpur Delhi NCR8447779800, Low rate Call girls in Kotla Mubarakpur Delhi NCR
8447779800, Low rate Call girls in Kotla Mubarakpur Delhi NCR
 
8447779800, Low rate Call girls in New Ashok Nagar Delhi NCR
8447779800, Low rate Call girls in New Ashok Nagar Delhi NCR8447779800, Low rate Call girls in New Ashok Nagar Delhi NCR
8447779800, Low rate Call girls in New Ashok Nagar Delhi NCR
 
Memorándum de Entendimiento (MoU) entre Codelco y SQM
Memorándum de Entendimiento (MoU) entre Codelco y SQMMemorándum de Entendimiento (MoU) entre Codelco y SQM
Memorándum de Entendimiento (MoU) entre Codelco y SQM
 
Call US-88OO1O2216 Call Girls In Mahipalpur Female Escort Service
Call US-88OO1O2216 Call Girls In Mahipalpur Female Escort ServiceCall US-88OO1O2216 Call Girls In Mahipalpur Female Escort Service
Call US-88OO1O2216 Call Girls In Mahipalpur Female Escort Service
 
Marketplace and Quality Assurance Presentation - Vincent Chirchir
Marketplace and Quality Assurance Presentation - Vincent ChirchirMarketplace and Quality Assurance Presentation - Vincent Chirchir
Marketplace and Quality Assurance Presentation - Vincent Chirchir
 
Case study on tata clothing brand zudio in detail
Case study on tata clothing brand zudio in detailCase study on tata clothing brand zudio in detail
Case study on tata clothing brand zudio in detail
 
Call Us 📲8800102216📞 Call Girls In DLF City Gurgaon
Call Us 📲8800102216📞 Call Girls In DLF City GurgaonCall Us 📲8800102216📞 Call Girls In DLF City Gurgaon
Call Us 📲8800102216📞 Call Girls In DLF City Gurgaon
 
Innovation Conference 5th March 2024.pdf
Innovation Conference 5th March 2024.pdfInnovation Conference 5th March 2024.pdf
Innovation Conference 5th March 2024.pdf
 

Give Me an Hour and i will triple your ROI

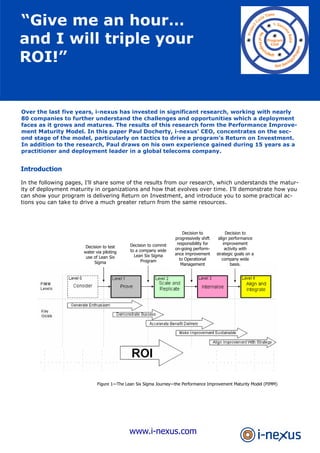
  • 1. “Give me an hour… and I will triple your ROI!” “Give me an hour… and I will triple your ROI!” Over the last five years, i-nexus has invested in significant research, working with nearly 80 companies to further understand the challenges and opportunities which a deployment faces as it grows and matures. The results of this research form the Performance Improvement Maturity Model. In this paper Paul Docherty, i-nexus’ CEO, concentrates on the second stage of the model, particularly on tactics to drive a program’s Return on Investment. In addition to the research, Paul draws on his own experience gained during 15 years as a practitioner and deployment leader in a global telecoms company. Introduction In the following pages, I’ll share some of the results from our research, which understands the maturity of deployment maturity in organizations and how that evolves over time. I’ll demonstrate how you can show your program is delivering Return on Investment, and introduce you to some practical actions you can take to drive a much greater return from the same resources. Decision to test water via piloting use of Lean Six Sigma Decision to commit to a company wide Lean Six Sigma Program Decision to progressively shift responsibility for on-going performance improvement to Operational Management Decision to align performance improvement activity with strategic goals on a company wide basis. Figure 1—The Lean Six Sigma Journey—the Performance Improvement Maturity Model (PIMM) www.i-nexus.com
  • 2. “Give me an hour… and I will triple your ROI!” Let me start by sharing some interesting data. The following table shows the mean and standard deviations of key measures associated with Return on Investment across all Performance Improvement programs surveyed during our research: Factor Mean Std Dev Operational definition ROI Multiple 2.5 1.5 Audited tangible financial benefits as a multiple of tangible costs. Project Cycle Time 8.7 Months 2.1 Months Time from Define tollgate approval to Control tollgate approval. Benefits/Project $137K $54K The annualised net project benefits which have been validated by the financial controller (one year from project close date) Concurrent Projects/Belt 0.6 0.3 The number of currently active projects divided by the number of trained belts (trained in last 24 months). % Successful 63% 26% The number of projects which pass a final tollgate review and for which net benefits are recorded in the following 12 months. Figure 2—Survey of 41 global deployments, at three year point This is based upon results from just over 40 global deployments, concentrating, in particular, on those companies at the three year point of their deployment, and so I would expect them to be starting to generate a significant return. Obviously there are some challenges in terms of comparing across different companies, but I have effectively factored out that variation to create a representative view of how companies are performing across the whole deployment. Some key observations Using the data as a benchmark of the real life performance of Lean and Six Sigma deployments today, the following points stand out: • The number of concurrent projects per Belt is much lower than you might otherwise expect. We are training a lot more people than actually get active and complete projects. From the point of view of getting more from the investment, this is a huge missed opportunity. • There is a significant Standard Deviation on the cycle time, but projects in the real world generally take a long time. Many people have talked about Green Belt projects lasting four months, and Black Belt projects taking six, but the data suggests that in fact it consistently takes much, much longer to execute a DMAIC project. • The level of benefit being generated per project is much lower than might be expected. In reality, this is because of a large number of trailing edge projects with low levels of return (i.e. projects that could and should have been stopped). Finally, it should be noted that there are some very interesting interaction effects between the variables. The longer you take to complete a project, the longer the cycle time and the lower the average benefits generated from that project. In turn, this is matched by a lower level of overall success. Drivers of ROI on Lean Six Sigma Programs As a Six Sigma practitioner and somebody who has been involved with cause-effect thinking for some time, I am a great believer in applying Six Sigma to Six Sigma, and the whole concept of “Y is a function of X”. The following diagram illustrates the key drivers of ROI on a Lean Six Sigma Program, using a simple equation to provide a complete description of the factors that drive Return on Investment. www.i-nexus.com
  • 3. “Give me an hour… and I will triple your ROI!” Figure 3-Drivers of ROI on a Lean Six Sigma Program. Using this, it is very clear that if I can reduce my cycle time, I will increase my Return on Investment. Equally, if I increase the amount of benefits generated per project investment, I drive up my Return on Investment. In the following pages, I focus on each of these areas and the top two tactics - or “uncommon practices” - that you can implement to deliver the biggest leverage effect on Return on Investment, based upon on our research and the best practice we have observed working with different companies. Key driver 1- Project Cycle Time The following analysis takes the average project cycle time and breaks that into value versus non-value added time: Figure 4-Total cycle time split by value and non-value time, based on a sample of 500 projects taken from a population of 15,000 projects.
  • 4. “Give me an hour… and I will triple your ROI!” What this breakdown shows is that out of every eight months spent on a project, five are wasted. That time is being squandered for a variety of reasons, but the following are key: • a delay in the availability of data • following a line of enquiry that is not leading us to the root causes • allowing the project to be driven by the metronome of the availability of the senior executives who are sponsoring the program, rather than the actions that the project needs to take. The biggest bang for the buck is to be gained from focussing on reducing the non-value adding time. One of the tactics that we can take to reduce the amount of unproductive lines of enquiry, particularly Green and Black Belts in the early stages of activity, is to use on-the-job coaching, either by Master Black Belts or by external consultants. However, coaching is a well known and well practiced approach so—against this driver—I am going to focus on two other tactics which can make a huge difference. Right Tool. Right Job. For over 10 years, I was a deployment leader in a telecoms company, and let me be honest that during that time I made just about every mistake it is possible to make deploying Six Sigma. I guess this is the way to learn, but I want to share some of my learning to avoid you making the same mistakes. The first tactic is about choosing the right approach. Looking back, one of the worst errors I made was at the beginning of the deployment when I focussed almost exclusively on applying DMAIC, not realizing that in reality there are other approaches you could adopt: • reduce variation with the DMAIC approach; • cut down waste through simplification (essentially the Lean approach); • remove complexity (Business Process Redesign or Design For Six Sigma). Figure 5—Analysis of process capability vs. correct choice of approach Applying an optimization approach, when you have a project that inevitably is going to require data collection, is a very inefficient way of applying improvement. One thing I have learnt from looking at many hundreds of projects is that, whilst there may be abundant Y data, there is very little X, cause or variable data available. Variation Reduction projects are data heavy. When you have a process with a low frequency, there is inevitably a long lead time to collect meaningful data, which in turn leads to a delay in the project cycle. So, simply being smarter about what types of approach you choose can dramatically cut cycle time. Let me give you a real example here. If you focus on a project where essentially you know you have a process frequency of less than one or two a day, and the process is not stabilized or at a level where optimization is the target,
  • 5. “Give me an hour… and I will triple your ROI!” then Lean is very much the right approach to take. The beauty of Lean is that we are really only focussing on ‘voice of the process’, rather than ‘voice of the data’, and our data collection is usually limited to the cycle time output variable. My experience is that setting some very simple rules about what approach gets applied to what type of project dramatically reduces cycle time, because you are not spending time unnecessarily waiting for data when you could be driving improvement. Immediate and brutal transparency Many projects are elongated simply because of the Sponsor’s availability. There are a number of strategies you can take to address this, but the most successful is what I’ve called “Immediate and Brutal Transparency”. Let’s take the scenario where you have a project Sponsor, a project leader like a Black Belt, and an executive, with ultimate responsibility for a portfolio within his or her business. If you can deliver a personalized report, indicating the status of each of the projects to the Sponsor on a regular basis, you do not have to be governed by their calendar - it turns up in their inbox everyday. Ideally, - at the same time - you would deliver detailed information on the projects to the project leaders, and a summary view with drill down capabilities to the senior executive. What you create is a self-righting mechanism where the Sponsor knows what action they have to take to get things done, the team understands what they have to do to get things done but critically everybody knows that the boss can see whether it is being done. Figure 6 - Cascading reports deliver “immediate and brutal transparency” In my experience, this is one of the best ways to get movement in any organization, but it all comes down to immediacy. Leaving this kind of approach until later in the program will present difficulties for multiple political reasons, so it is very important to start off on the right footing from the very beginning of the program.
  • 6. “Give me an hour… and I will triple your ROI!” Key driver 2 - Net benefits per project The following illustrates how we normally think about a DMAIC project:• • • a set of possible root causes are explored, analysis is applied to identify a possible solution, the solution is implemented and ultimately leveraged. Figure 7 - Points of maximum influence on net benefits per project However, what this really conveys is the three points in a DMAIC project cycle where you have a significant amount of leverage on the results that the project will deliver. The first, selecting a high impact defect, is pretty well institutionalized in most large organizations. Picking a project where the impact of the defect is significant will clearly give a better return than if you deliver against a lower impact defect. Instead, I will focus on two other areas where I see organizations struggling to realize tangible benefits: • Taking the action to realize tangible benefits - sponsor follow-through • Ensuring follow-through on leverage opportunities - pro-active replication
  • 7. “Give me an hour… and I will triple your ROI!” Sponsor follow-through This is a visual representation of the difference between delivering a project, which is usually the responsibility of the Black Belt, and delivering benefits which is ultimately the responsibility of the Sponsor in the project. Figure 8-The difference between delivering the project, and delivering its benefits Let’s take a classic example: a labor productivity saving is made by reducing the use of another resource - less rework, for example. The bottom-line is that this will deliver some potential up-side in terms of the opportunity value of that additional labor, but it will have no financial effect - no real ROI effect - until an action is either taken to remove those resources from the organization or redeploy them. My experience is that a lot of programs go through the experience of making project improvements and seeing capability improvements, but do not see the benefits in the financial sense because few projects have a direct and immediate working capital impact. Unless it’s as simple as, for example, reducing scrap on the shopfloor, realizing real benefit requires some secondary action. So how can you ensure this happens? One of the tactics used by a number of the companies we have worked with and researched is to extend the concept of chartering from an executive to a team, i.e. chartering between a CEO and the Sponsor that says, “If we commit to doing that project your personal income reward is going to be dependant upon realizing the benefits.” Pro-active replication It would seem fairly obvious that if you make an improvement, that that solution strategy should be replicable any similar business units or departments that have the same or similar processes. In many of the companies that we work with, for example global companies with 10’s if not 100’s of subsidiaries and operating units, there is a huge multiplication opportunity available for most projects, but the reality is that it rarely happens. Now the question is “why?” Put simply, it doesn’t happen because nothing drives it to happen. In most organizations, whilst there may be a Master Black Belt network, there is very little motivation to make replication happen, nor is there an easy process or supporting infrastructure. At its simplest, applying systematic replication requires two tactics: • At the point a project is started, look for similar examples, not just in terms of searching for project titles and key word matches, but search right into the documentation against every project to pull up as
  • 8. “Give me an hour… and I will triple your ROI!” many relevant opportunities to see if there is a solution there. • Provide the Master Black Belt, or the process owners in other functions around the organization with notifications that tell them if a project has been completed or a significant event has occurred relating to something which has interest to them. Figure 9— Facilitating pro-active replication Modern IT Infrastructures to support this are available today. If your current infrastructure cannot do this, it is preventing you from fully realizing Return on Investment from your program. Of course, nothing is as simple as just IT or technology or infrastructure; everything has a human aspect to it. What I have found is than companies that are driving Return on Investment through better replication have created an incentive program much like licensing intellectual. Their policies allow individual business units to licence the solutions that they come up with and earn income from the benefits gained by other business units - if you like a notional cross-charging approach. That might seem like an effort to implement but, with the right infrastructure, the approach can lead to a significant desire and drive to follow-through on the replication. Without it, new benefits brought to a particular business unit tend to begin and end right there.
  • 9. “Give me an hour… and I will triple your ROI!” Key driver 3 - Number of projects per Belt The third area of opportunity is around driving a greater number of projects per Belt. To help us get a greater understanding of this issue, the following data illustrates research carried out with the same companies but focusing specifically on time taken for each activity within the project. Figure 10- Analysis of time spent by Belts during a two month period Taking a sample of the Green and Black Belts, my research looked at how they spent their time over a two month period, breaking it down into hourly chunks. Whilst 2 – 4 weeks were spent training and coaching people in using the skills of Six Sigma, Green and Black Belts were spending less than 6% of their time actually applying those hard skills in project situations. Now that is a little one-dimensional, because obviously there are the other aspects of planning and delegating work, and coaching and facilitating the application of tools. However, the most important lesson here, and potentially the opportunity to increase the amount of projects that an individual can do, lies in the vast amount of their time lost in two key areas: • Managing stakeholder expectations - building consensus within stakeholders and developing those relationships • Driving data collection and implementing measurement systems - doing process characterization through mapping and data collection. If we want to drive up the number of projects implemented per Belt, we need to reduce the time spent on the softer skill issues and push towards a greater degree of productivity from our resources. Belt-business alignment The first tactic addresses the amount of time spent communicating with stakeholders, by increasing the alignment between the full and part-time resources that have been dedicated to Lean Six Sigma within the organization. This means not just aligning the Master Black Belts with specific business units or functions, but actually driving down and aligning individual Black Belts with the individual functions. Although this might seem to be highly inefficient from an economy of scale perspective (an individual Black Belt cannot handle projects from multiple parts of the organization), the real efficiency of scale is the reduction in the amount of communication required and the ability to concurrently manage more than one project in a particular business area.
  • 10. “Give me an hour… and I will triple your ROI!” What we have seen is that this way of aligning the organization seeds more of the responsibility for project definition and others back down to the operational leaders. In addition, it leads to a higher degree of buy-in and a stronger belief that the project is owned by the functions themselves. Self-service measurement system automation Figure 11—Investment in relationships can be leveraged to minimize unnecessary communication, and maximize projects/Belt A second tactic looks at the inordinate amount of time Belts spend collecting data. Although this issue may be less obvious, it is responsible for causing considerable delays to projects. Many organizations have data collection or measurement systems, but too often they are used for reporting, rather than improvement. As a result, a project leader may have a great deal of Y data immediately available, but lack the X data needed for qualitative analysis, or drilling further into the numbers. Clearly, the other factor that complicates or compounds the delay is the availability of IT resources. As an ex-IT Director in a large corporate organization, it has never been my intention to slow down Six Sigma and Lean type activity, but I can tell you that the scarcity of IT resources to specifically develop measurement systems can have significant effects on the project cycle time and productivity of Green and Black Belts. At the end of the day, people are resourceful so they build measurement systems using personal productivity tools, MS Excel for example, which allows them to collect data during the project life-cycle. However, it they adopt this approach, the data have to be analyzed in another tool and, more importantly, the ongoing measurement system is not sustainable. It is then not possible to leave in place a measurement system that allows the process owner to maintain that project process control once they take over the project solution. The ability to continually maintain the process capability and drive improvement on an ongoing basis is lost. So the question is how do you combat that? As a company we have invested in developing the kind of solutions which allow organizations to use the same infrastructure that they use to track program benefits and project savings to define and build the measurement plan associated with each project. End users are therefore able to: • • • • • Define a measurement plan (Y and X variables) Convert this into an manual or automated data collection system Create and publish web-based data collection forms to ease data entry Automatically chart this data using appropriate control charts Enable process owners to apply simple data analysis tools I believe that these tactics are critical to driving greater productivity in terms of individual Belts. Of course, there are other things that can be done: give Belts the soft skills they need to be more productive; ensure that the quality of Belts is not diluted in anyway. But these are more common practices. What I have described here are some of the uncommon practices which give the best leverage so that instead of seeing half a project per Belt you can achieve almost four times that level of productivity from the same resources.
  • 11. “Give me an hour… and I will triple your ROI!” Key driver 4 - Percentage successful projects Moving on, let’s look at the next driver of ROI - the question of success. If you look at any Lean Six Sigma project there are multiple ways to “screw that project up”. Figure 12 - Factors contributing to project failure Poor selection Ultimately, the selection of the project is the first point where you can make a mistake. Classically, the project scope is too big - you are just trying to “boil the ocean” - or the project is actually not a project solving an unknown or difficult to characterize problem. All too often, it is somebody promoting their favorite solution and characterizing it as a Lean Six Sigma project just to make sure it gets done. In my experience, selection is something you can address relatively easily by formalizing selection processes, enforcing clarity in terms of the defect that has actually been identified and making sure that you do not tick off projects before you have a meaningful defect that is worth fixing. Poor analysis Belt coaching and training can overcome the problem of poor analysis, but actually often it is not the Belt that is the issue, it is the Sponsor. Poor sponsorship The biggest issue that people face in terms of project success is that often the influence of the sponsor leads to inappropriate action being taken. Either the sponsor’s belief system leads them to want to press the accelerator, when really the right behavior is to focus on gathering data, or they are pushing through to get action because their instincts have been trained over 10 – 15 years to make quick decisions based upon gut feel as opposed to making rational decisions based upon collection of data. There are however a couple of tactics you can take to address the sponsor side of ensuring project success:
  • 12. “Give me an hour… and I will triple your ROI!” A) Sponsor coaching The first thing to consider is Sponsor coaching. Typically, senior executives in an organization have a two-day sheep dip experience involving some degree of executive orientation. They are poorly equipped and poorly prepared for their role, and in no position to guide their projects through to execution. What we need is an alternative strategy which balances the investment made in training and coaching Belts. Admittedly, increasing the amount of training offered to Sponsors is difficult, because getting a day or two days out of their diaries is extremely challenging. However, providing on-the-job coaching at critical points in the project’s execution, for example gate reviews, ensures the Sponsor understands their role, the critical questions they need to be asking, and when to slow down or speed up the project. This kind of coaching can help move from the “Ready, fire, aim” approach to “Ready, aim, fire”. In reality the problem is it’s not “Ready, fire, aim”, it ends up as ‘Ready, fire, aim okay— re-aim, fire, re-aim, fire”. Multiple attempts to solve the problem could have been eliminated by getting straight to the root cause simply by being more thoughtful about the project solution and the project analysis. Consequently, sponsor coaching is critical to getting a higher degree of Return on Investment from your program. Phase Key Question Define What is the defect and what is the business impact of the defect? Measure What is the process capability? Analyze What are the root causes and what evidence to we have to support our conclusions? Improve Do we know that the selected solution will generate a statistically significant improvement in process capability? Control (i) Have we achieved our planned capability improvement? Control (ii) Have the process owners taken full responsibility for on-going management of the process? Control (iii) Have we locked in the gains by fully standardizing the process? Control (iv) Have we summarized the learning and communicated and celebrated the success? Transfer Have we identified all logical opportunities for leverage of the project solution? Figure 13—Example questions for Gate Reviews
  • 13. “Give me an hour… and I will triple your ROI!” B) Common (simple) MAAR format for the project story I’ve been to many, many different project reviews, and what I usually see is a very long and complex story being told, with most people disengaging, or loosing the thread. A better alternative is that you use your tool experts your Master Black Belts - to validate the application of the tools, and use the project reviews to simply tell the story of the project, the opportunities that lie behind it, and to drive ownership of the ongoing improvements. Figure 14 - Using a MAAR chart format to simply tell the project’s story The MAAR chart format illustrated above is a simple but effective way of doing this. It gives a clear view of the life of the project as a control chart from the point the Y measure was implemented, shows the progress of actions that have been taken, highlights the biggest areas of opportunity and illustrates the impact on the root cause over time. Using this format can lead to a much tighter focus on what the project is about and less wasted energy and time working on projects that ultimately have no clear impact on the Y measure. When actions are taken you can clearly see if there is a consequential improvement in the process capability. In addition, this kind of approach leads to a greater degree of buy-in by the executives because they understand they are trying to move the dial and how that is connected to the actions that are being taken. So in terms of driving project completion, it may sound counter-intuitive but coaching Sponsors and telling the project’s story in a simpler and more direct way effectively ensures projects do not go on for ever, successful projects are given the support they need, and those that are less likely to be successful are killed at the earliest possible point in the process.
  • 14. “Give me an hour… and I will triple your ROI!” Key driver 5 - Reducing the cost of the program This is an analysis of 12 organizations, showing the cumulative average cost of their program over the last three years. Figure 15—Tangible costs for typical LSS deployment in $1Bn SBU: 100 projects per year; 20 Black Belts; 80 Green Belts. My research team also looked at what had been spent in tangible “above the water” iceberg expenses vs. the intangible ’lost opportunity’ costs sitting below the water line. Figure 16—Tangible costs vs hidden costs
  • 15. “Give me an hour… and I will triple your ROI!” One key finding right up front was that the investments made to get the right people, or to track and drive the reporting out of the program to create transparency and engagement were a very small fraction of the total three-year investment. Of course, there were costs that were more difficult to account for, so that there is a degree of subjectivity here. However, it is clear the majority of the cost was invested in paying salaries and funding the training program of the full time people. Above and before all else, it is this investment that must pay back. This leads to the following simple piece of advice: recognize that the primary issue lies in making sure that you do not waste your training investment. You have to avoid the perception that getting on to Six Sigma training is an easy thing or that the deployment organization is crying out for Black Belts. Maximize training investment - introduce the “3 strikes rule” My research showed that the companies that had done the best at making training effective had introduced a version of what we call the ‘three strikes rule’: Strike 1: First Warning Poor/non-existent Charter before first module of Belt training Strike 2: Second Warning No updated Charter within one week of completing first module Strike 3: You’re Out Define tollgate review not completed before the second module of Belt training Figure 17— The Three Strikes Rule Whilst it won’t help the “Number of Belts trained” KPI, adopting this approach will drive Sponsor and Belt behavior. Introduce the importance of engagement and performance right from the start by saying that actually getting on to a training course, or being sponsored on to DMAIC or other Lean training courses, requires you to come with a fully thought through project charter. Failure to deliver at the early stages of the cycle, results in a warning - a first strike. If within a week of getting back from the first module of Black or Green Belt training, you have not produced an updated Charter that the project sponsor is signed into, that’s strike two. This leaves only one more chance and that is to make sure you have completed the Define gate tollgate before the second week of training. With the right infrastructure it is very easy to be able to generate a report on any training courses that are taking place, to see who is falling foul of these three-strike rules. What we have found is that by rigorously enforcing these, you reach a much higher level of productivity because the Belts you train actually deliver and are encouraged to continue to deliver through the period they may actually be in rotation as Green or Black Belts. Not only that, you also get a reduction in training costs because you do not waste energy on poorly formed and inappropriately scoped projects or people who are not buying in. Automated reporting from “one set of numbers” Let me characterize for you what I believe to be the situation that exists in many, many different organizations today in terms of how Six Sigma is being reported and managed as a program. The reality of this is not unfamiliar to me because this is exactly how I felt in the mid- to late-90s when I was running a large scale program myself. What you have is a situation where Belts are communicating with the Master Black Belts on progress. They are communicating with Sponsors. The corporate deployment lead is trying to pull a picture together from different business groups to present a picture to the executives and the CEO. And everyone is storing information in multiple different places, whether that is shared drives or local drives, so that in fact you have several different versions of the truth and every one is different. At any point in time every organization is struggling to answer the question “What is the benefit that I have delivered from this Six Sigma Program - what is my ROI?”
  • 16. “Give me an hour… and I will triple your ROI!” Figure 18—“Many views of the truth”: Inconsistent operational definitions, significant lag—and significant cost With this kind of lag and this kind of inconsistency in operational definitions, most organizations loose faith, with the financial controllers in particular doubting whether the numbers are meaningful. In addition, people loose commitment because there is such a big difference between the time when the target is set and the point when it is realized. Clearly there is an alternative - one common set of operational definitions of how things are recorded, a single repository and, more critically, technology pushing out reporting on a personalized basis, so that information is delivered in real-time as it is updated.
  • 17. “Give me an hour… and I will triple your ROI!” Adopting this approach drives the pull on the Black Belts, Green Belts and team members to maintain the information that is a by-product of implementing their project. It also drives the pull on executives because they know their boss can see what is happening. Finally, it drives the pull on being able to do financial validation and tool validation within the same repository, so that there is tracking of whether things are actually being validated and agreed in real-time. In short, it gives you what is essentially a common operating system for your program and creates a much greater focus on cost. In Conclusion In the previous pages, we have outlined some of the key tactics which can drive ROI. In the few remaining pages, I will give you some idea of the potential impact of moving just one of the main ROI drivers. Let’s consider the benefits from reducing cycle-time. The following illustrates an organization performing at a typical level, perhaps a US$1Bn strategic business unit of a large global company or even a US$1Bn operating business itself. In a typical scenario, we would expect that company at a three year point to have deployed around 100 active Belts (20% Black Belt, 80% Green Belt) with around 0.6 projects per Belt. In terms of benefits, it would be generating $127K per project, based on an 8.7 month cycle time. That amounts to around $11.3M of benefits per year, or, as an ROI multiple, around about 1:2 – 3:1 as a normal ROI multiple. However, just cutting cycle time by two months can drive significantly higher benefits per year. Using the typical deployment described above, the program returns $15M rather than $11M, effectively adding a further third of the benefits again for implementing some of the simple tactics outlined in this paper. Keeping a laser focus - the LSS Program Dashboard Much of this relies on having the ability to pull information together, and drive it out at the appropriate time, and in an accessible format. With the right infrastructure, you can simply implement a Lean Six Sigma ROI Program Dashboard. This will plug straight into your project infrastructure so that it automatically reports on, for example net savings per project, and more importantly enables you to tell the story of your own improvement. Figure 20—An example LSS Program Dashboard, driven by i-nexus’ software Given the potential impact of reducing project cycle time by as little as two months, it is clearly worth shifting some resources to focus on this task. A program dashboard or scorecard will help to keep the program office focused on their mission, to scale and replicate their program and drive up ROI.
  • 18. “Give me an hour… and I will triple your ROI!” About the Author Paul Docherty is the CEO of i-nexus, the leading provider of enterprise software to enable strategy execution. Paul started his career in Marconi, the telecoms equipment provider, where he held a wide range of management roles covering manufacturing, IT, sales, product development, project management, Six Sigma and corporate strategy as well as having P&L responsibility for the growth of a regional services business. Paul holds a MEng in Computer Systems and Software Engineering from the University of York and an MBA from the University of Warwick. His understanding of the challenges of embedding Six Sigma and other performance improvement methodologies into the fabric of organizations comes from his experience coaching senior management teams in many Global 500 companies and from leading the deployment of Six Sigma at Marconi. Paul was a co-founder of i-solutions Global in 2001, and has spearheaded its rapid expansion into the preferred global deployment partner for Lean Six Sigma and Strategy Execution programs. He can be contacted on paul.docherty@i-nexus.com or by telephone on +44 (0)7985 117784 (mobile), +44 (0)24 7660 8865 (desk). About i-nexus i-nexus is the leading provider of web-based software for formulating, aligning and executing performance improvement in Global 500 leaders worldwide. Client companies include organizations such as Pfizer, BT, Royal Bank of Scotland, ALSTOM, AREVA, Staples, Hager, Vodafone, Carl Zeiss, CIBA Vision, Network Rail and Xchanging. i-nexus provides a tailored range of solutions. Beginning with simple deployment and training support, and expanding out beyond the project tracking needs of Lean and Six Sigma improvement programs, i-nexus can provide the infrastructure that enables strategy mapping, cascaded scorecards, corporate objective alignment and strategy execution. i-nexus solutions are underpinned by powerful business intelligence capabilities which deliver executive and senior management reports on demand, in real-time or on a scheduled basis. i-nexus is headquartered in Coventry, UK, with regional offices in Europe, North America and Asia. To find out more about how i-nexus can help you to reduce project cycle times, increase project success rates and cut the cost of managing your portfolio: • Email: sales@i-nexus.com • Call European office: +44 (0)845 607 0063 • Call Americas office: +1 (617) 267 9595 • Visit: www.i-nexus.com