1. TEACHING PORTFOLIO (SAMPLE)
PORAMATE (TOM) PRANAYANUNTANA
“For the past half-dozen years, Tom has consistently gotten amongst the very best student
evaluations in the Mathematics Department, at NYU-Poly.”
Erwin Lutwak – Chair of Mathematics
The abilities to view, think and make connections mathematically from several points of view
– algebraically, numerically, graphically and verbally, are some of the most valuable skills I
teach my students. They are the skills to read and draw two and three-dimensional graphs,
contour diagrams and think graphically, to read tables and think numerically. I teach my
students to apply these skills, along with algebraic skills, to model practical problems of
the real world. My students are from different majors – Applied Physics, Biomolecular Sci-
ence, Business and Technology Management, Chemical and Biomolecular Engineering, Civil
Engineering, Computer Engineering, Construction Management, Electrical Engineering, In-
tegrated Digital Media, Mathematics, Mechanical Engineering, Physics and Mathematics,
Science and Technology Studies, and Sustainable Urban Environments – and they all use
this subject differently. Unless my students engage themselves, they cannot view, think, or
make mathematical connections; thus, my primary goal is to encourage them to participate
actively in the learning process. Since my students come from diverse backgrounds, they
possess different skills and may have different viewpoints of the same theory. They also
experience different practical applications of the same theory. Therefore, I choose to teach
many of same concepts in different ways: algebraically, numerically, graphically, and verbally
in order for the students to have more chances to make connections with their previous or
background knowledge. Simultaneously, I emphasize the properties and insights of the topic
under consideration. This will help the students make connections and retain the knowledge.
Using various methods I ensure participation, including discussions outside of class–recitations
and office hours, leading undergraduate research, and even assigning students to teach the
recitation for the day. These techniques have worked well for the upper level classes however,
for the lower levels I found that providing the students with time to pause and contemplate
the answer before advancing with the lesson is most effective. Even with these approaches,
mathematics can be difficult to comprehend, therefore I use tangible examples that em-
phasize real world examples. Additionally, incorporating technology–such as the graphing
calculator with CAS (computer algebraic system)–as a motivator, instead of as a tool, is
useful for keeping the students interested. The following are some examples of calculator
usage. In my Linear Algebra class, I teach students how linear independence of column
vectors of a matrix relates to its unique reduced row echelon form. This enables the students
to inspect a matrix and find its reduced row echelon form without completely doing row
reduction steps. CAS calculators are being used for practicing this inspection technique and
2. Teaching Portfolio (Sample) Poramate (Tom) Pranayanuntana
verifying answers/patterns. In my Differential Equations class, CAS calculators were used
to verify the solution to the differential equation or the system of differential equations, plot
slope field and solution trajectory. In my Multivariable Calculus class once we found the
tangent plane, or quadratic approximation surface at some particular point, the graphs of
the original function, its tangent plane and its quadratic approximation surface would be
drawn. So graphing calculators with CAS, if used correctly, help students visualize the math
concepts they currently study. However, above all, when I show genuine concern for their
learning the students respond well. A friendly comportment, a comfortable classroom at-
mosphere where questions and comments are welcome, and flexible office hours have worked
well to this end. My students appreciate this time and dedication and I, not surprisingly,
have found their appreciation very rewarding.
I believe that teaching applied mathematics is not just a science, but also an art. In my
opinion, lecturing should not be a one-sided communication. The teachers should not only
lecture and present slides, but also ask the students for questions and opinions. They should
always keep observing the students’ responses to the topic taught, and should try to find
different strategies to get the students to understand and be able to apply the concepts
related to the topic taught. For example, when my daughter was in second grade, she
was mastering the definition of fractions. She had already been introduced to the idea of
functions; this opened the opportunity for me to teach her the definitions of the cosine and
sine functions by first asking her to divide the length along the circumference of a unit circle
(i.e. circumference is 2π) into fractions of 2π and locate the point. From that point, the
line parallel to the y-axis intersects the x-axis at the cosine value of that fraction of 2π.
Similarly, the line parallel to the x-axis intersects the y-axis at the sine value of that fraction
of 2π. This way, I believe she not only knew the definitions, but was also able to find the
sine and cosine values of some of the basic angles like the integer multiples of π/6 or π/4,
for example. Of course, before she could do this, she had to have a solid foundation of the
basic operations such as the multiplication and division of fractions, adding and subtracting
integers as well as fractions. Also, she had to be familiar with the projection of a point in the
Cartesian coordinate system, that is the xy-plane, onto the x-axis and the y-axis. Moreover,
she had to have a solid understanding of powers and radicals.
When my two kids, my daughter and my son, were in second grade, I taught them powers and
radicals of numbers. Simultaneously, I would also teach them the cosine and sine functions.
To demonstrate, once they knew that 25
= 2×2×2×2×2 = 32, I would tell them that
√
64
is 641/2
. I would ask them to factor 64, and they would get 64 = 8×8. I would then enlighten
them that the square root of 64 is nothing but 641/2
= (8×8)1/2
= 8. Using the definition of
the power function with fraction powers, (8×8)1/2
is one of the two multiplied 8’s. This way,
they could also find out that 645/6
= (2 × 2 × 2 × 2 × 2 × 2)5/6
= 2 × 2 × 2 × 2 × 2 = 32, since
they now understood that they had to take five out of the six 2’s in (2 × 2 × 2 × 2 × 2 × 2).
When teaching my Linear Algebra class, I emphasize that the theory of basic linear al-
gebra revolves around the concept that Linear Combination Relationship/Linear Depen-
dence/Linear Independence of column vectors of same corresponding positions of a matrix
and of its row equivalents are not changed through the process of row reduction. This can be
used to inspect a matrix to obtain its reduced row echelon form without actually completing
the row reduction steps as seen in the following example. Ex1. Let’s consider how to find
Page 2 of 12
3. Teaching Portfolio (Sample) Poramate (Tom) Pranayanuntana
the reduced row echelon form of the following matrix A.
A =
0 3 −6 6 4 3
3 −7 8 −5 8 25
3
v1
−9
v2
12
v3
−9
v4
6
v5
27
v6
rref
−−−−→
1 0 −2 3 0 −24
0 1 −2 2 0 −7
0
v1
0
v2
0
v3
0
v4
1
v5
6
v6
RREF(A)
.
We can observe that each of the non-pivot columns of A can be represented as a linear
combination of the pivot columns of A and the corresponding relation between each of the
non-leading columns and the leading columns of RREF(A) as follows:
−2v1 − 2v2 = v3 if and only if −2v1 − 2v2 = v3,
3v1 + 2v2 = v4 if and only if 3v1 + 2v2 = v4,
−24v1 − 7v2 + 6v5 = v6 if and only if −24v1 − 7v2 + 6v5 = v6.
In the above Gauss-Jordan Elimination result:
A =
−2
0
−2
3 −6 6 4 3
3 −7 8 −5 8 25
3
v1
−9
v2
12
v3
−9
v4
6
v5
27
v6
rref
−−−−→
−2
1
−2
0 −2 3 0 −24
0 1 −2 2 0 −7
0
v1
0
v2
0
v3
0
v4
1
v5
6
v6
,
it is clear that −2v1 − 2v2 = v3 if and only if −2v1 − 2v2 = v3,
A =
3
0
2
3 −6 6 4 3
3 −7 8 −5 8 25
3
v1
−9
v2
12
v3
−9
v4
6
v5
27
v6
rref
−−−−→
3
1
2
0 −2 3 0 −24
0 1 −2 2 0 −7
0
v1
0
v2
0
v3
0
v4
1
v5
6
v6
,
it is clear that 3v1 + 2v2 = v4 if and only if 3v1 + 2v2 = v4,
A =
−24
0
−7
3 −6 6
6
4 3
3 −7 8 −5 8 25
3
v1
−9
v2
12
v3
−9
v4
6
v5
27
v6
rref
−−−−→
−24
1
−7
0 −2 3
6
0 −24
0 1 −2 2 0 −7
0
v1
0
v2
0
v3
0
v4
1
v5
6
v6
,
it is also clear that −24v1 − 7v2 + 6v5 = v6 if and only if −24v1 − 7v2 + 6v5 = v6.
We observe also that the pivot columns v1, v2 and v5 are all the linearly independent columns
from left to right of A, and these are corresponding to the leading columns v1, v2 and v5
which are all the linearly independent columns from left to right of RREF(A).
Now, in order to inspect the matrix A and obtain RREF(A) we test column vectors of A
for linear independence and linear dependence from left to right as follows:
First we start with the first (left-most) column of A which is v1, if v1 is nonzero, then by
itself, it is linearly independent that is v1 is the first pivot column of A, so the corresponding
v1 in RREF(A) is the first leading column (the first column of identity matrix Im = I3). If
not, then the corresponding v1 in RREF(A) would be a zero vector.
Page 3 of 12
4. Teaching Portfolio (Sample) Poramate (Tom) Pranayanuntana
Then each step i of the next n − 1 steps we will test if the ith column vector of A and
the previously found linearly independent columns (pivot columns vp1 , . . . , vpi
) are linearly
independent or not. If they are linearly independent then the corresponding ith column
vector of RREF(A) is the (pi+1)th column of Im (which is I3 in our case for this example).
If the ith column vector of A is linearly dependent to all the previously found linearly
independent (or pivot) columns vp1 , . . . , vpi
of A, then we solve for cp1 , . . . , cpi
∈ R such that
vi = cp1 vp1 + · · · + cpi
vpi
and the ith column vector of RREF(A) is
cp1
...
cpi
0
...
0
:
Step 1 Since v1 = 0 (by itself, v1 is linearly independent) then
0
3
3
v1
rref
−−−−→
1
0
0
v1
Step 2 Since v2 is linearly independent to v1 then
0 3
3 −7
3
v1
−9
v2
rref
−−−−→
1 0
0 1
0
v1
0
v2
Step 3 Since v3 is linearly dependent to v1, v2 and −2v1 − 2v2 = v3 then −2v1 − 2v2 = v3,
therefore
−2
0
−2
3 −6
3 −7 8
3
v1
−9
v2
12
v3
rref
−−−−→
−2
1
−2
0 −2
0 1 −2
0
v1
0
v2
0
v3
Step 4 Since v4 is linearly dependent to v1, v2 and 3v1 + 2v2 = v4 then 3v1 + 2v2 = v4,
therefore
3
0
2
3 6
3 −7 −5
3
v1
−9
v2
−9
v4
rref
−−−−→
3
1
2
0 3
0 1 2
0
v1
0
v2
0
v4
Step 5 Since v5 is linearly independent to v1, v2, therefore
0 3 4
3 −7 8
3
v1
−9
v2
6
v5
rref
−−−−→
1 0 0
0 1 0
0
v1
0
v2
1
v5
Page 4 of 12
5. Teaching Portfolio (Sample) Poramate (Tom) Pranayanuntana
Step 6 Since v6 is linearly dependent to v1, v2, v5 and −24v1 − 7v2 + 6v5 = v6 then −24v1 −
7v2 + 6v5 = v6, therefore
−24
0
−7
3
6
4 3
3 −7 8 25
3
v1
−9
v2
6
v5
27
v6
rref
−−−−→
−24
1
−7
0
6
0 −24
0 1 0 −7
0
v1
0
v2
1
v5
6
v6
Then we put all the corresponding columns of A and RREF(A) back together to
obtain
A =
0 3 −6 6 4 3
3 −7 8 −5 8 25
3
v1
−9
v2
12
v3
−9
v4
6
v5
27
v6
rref
−−−−→
1 0 −2 3 0 −24
0 1 −2 2 0 −7
0
v1
0
v2
0
v3
0
v4
1
v5
6
v6
RREF(A)
.
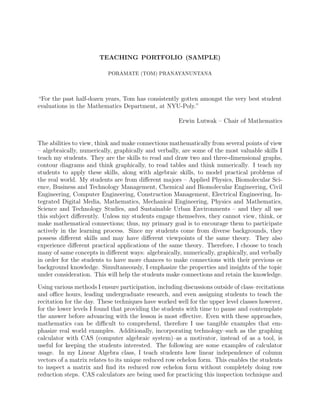
A CAS calculator can be used to check the work of each step and the final answer.
The following figure is the screen shot of a CAS calculator used for checking the
RREF(A).
Properties of eigenvalues and corresponding eigenvectors are also taught in my Linear Alge-
bra class and are used for Eigenvalue Inspection of a matrix. A CAS calculator is used for
checking the answer.
Ex2. Find all eigenvalues and corresponding eigenvectors of A =
4 −5 1
1 0 −1
0 1 −1
. Since
Av = λv and v = 0 then v = 0 ∈ Null space of (A − λI) or (A − λI)v = 0 with v = 0, this
means a nonzero linear combination of column vectors of A = 0 therefore column vectors of
(A − λI) are linearly dependent if and only if λ is an eigenvalue of A. Using this fact, we
can inspect the following matrix
A − 0I =
−1
4
−1
−5 1
1 0 −1
0 1 −1
we see that λ1 = 0 is an eigenvalue of A, and
Page 5 of 12
6. Teaching Portfolio (Sample) Poramate (Tom) Pranayanuntana
A − 1I =
−3
3
−2
−5 1
1 −1 −1
0 1 −2
we also see that λ2 = 1 is an eigenvalue of A. Since tr(A) = 3 = λ1
0
+ λ2
1
+λ3, therefore
λ3 = 2. Therefore,
Eigenvalue A Corresponding Eigenvector
λ1 = 0 v1 =
1
1
1
λ2 = 1 v1 =
3
2
1
λ3 = 2 v1 =
7
3
1
Where the last eigenvector can be easily seen from
A − 2I =
−7
2
−3
−5 1
1 −2 −1
0 1 −3
.
A CAS calculator can be used to check each of the answers, reducing the big amount of
tedious calculation, and let students focus only on theory. The following are screen shots of
a CAS calculator used for checking each eigenvalue and its corresponding eigenvector of A.
Page 6 of 12
8. Teaching Portfolio (Sample) Poramate (Tom) Pranayanuntana
When teaching my Differential Equations class, I use a graphing calculator with CAS to
help students understand theory since it reduces the calculation including differentiations
and integrations tremendously.
When teaching my Multivariable Calculus class, one very big problem that students face
is how to sketch or to figure out the shape of the surface given from its equation without
using a graphing calculator, especially hyperboloid surfaces. I then created a technique that
works for any equation that has the terms of u and v only in the form of u2
+ v2
, for (u, v)
that could be any of (x, y), (x, z), (y, z). The technique is to use polar coordinates to help
change an equation of three variables that contain u2
+ v2
into an equation of two variables
by substituting r2
= u2
+ v2
. Then from the graph–a curve–of the corresponding equation
of two variables, we can rotate the curve around some appropriate axis to obtain the shape
of the surface of the original three-variable equation. For example, if the question is asking
for students to sketch the graph of the surface x2
+ y2
− z2
= 1. Treating z as the output
and (x, y) as input, and each time we see x2
+ y2
, by applying polar coordinates, we can
replace x2
+y2
by r2
, the equation then becomes r2
−z2
= 1. Graphing this hyperbola curve
r2
− z2
= 1 in the rz-plane by hand, students should note the following
Page 8 of 12
9. Teaching Portfolio (Sample) Poramate (Tom) Pranayanuntana
(1) r cannot be zero,
(2) if z = 0 then r = 1 (r = −1 because in polar coordinates that we use in Multivariable
Calculus, r ≥ 0), that is we know that (1, 0) is on the curve r2
−z2
= 1 in the rz-plane,
(3) as r → ∞, z → ±r.
Since r = x2 + y2 represents the distance r = d
x
y
z
,
0
0
z
, especially if x = 0 then
r = y2 = ±y, that is the r-axis can represent the positive y-axis or it can represent the
negative y-axis or if y = 0 then r =
√
x2 = ±x, that is the r-axis can represent the positive
x-axis or it can represent the negative x-axis or even along the straight line y = kx, we would
have r = x2 + (kx)2 = d
x
kx
z
,
0
0
z
, so we can rotate the curve of r2
− z2
= 1
around the z-axis to obtain the surface x2
+ y2
− z2
= 1.
Linearization of function of two or more variables can be combined – added, subtracted,
multiplied, divided; and composed. When I ask my Multivariable Calculus students to find
a tangent plane to a surface at some particular point or to linearize a function around some
particular point, I usually ask them if they can find even easier ways to get the answer
or somehow use inspection to come up with the answer or use inspection to check if the
algebraic calculation makes sense or has any mistakes. For example, Ex1. Find a linear
approximation L(x, y) of f(x, y) = x + cos4(y) for (x, y) near (0, 0). Since f(x, y) ≈
f(a, b) + fx(a, b)(x − a) + fy(a, b)(y − b) with (a, b) = (0, 0), the linear approximation of
f(x, y), L(x, y), will have a term that contains a factor of (x − a) = (x − 0) = x and a term
that contains a factor (y − b) = (y − 0) = y. Now, cos(y) ≈ 1 − y2
/2 so by multiplying
cos2
(y) ≈ 1 − y2
and cos4
(y) ≈ 1 − 2y2
≈ 1 for all y near 0 (this linear approximation
of cos4
(y) ≈ 1 can be even easier obtained with graphing cos4
(y) near y = 0). So our
f(x, y) = x + cos4(y) ≈ (1+x)1/2
≈ 1+x/2 = L(x, y). This kind of question can be easily
done with inspection.
Quadratic approximation can also be done in a similar way. Ex2. Find a quadratic approx-
imation Q(x, y) of f(x, y) = x + cos4(y) for (x, y) near (0, 0). Since f(x, y) ≈ f(a, b) +
fx(a, b)(x−a)+fy(a, b)(y−b)+
fxx(a, b)
2
(x−a)2
+fxy(a, b)(x−a)(y−b)+
fyy(a, b)
2
(y−b)2
with
(a, b) = (0, 0), the quadratic approximation of f(x, y), Q(x, y), will have a term that contains
Page 9 of 12
10. Teaching Portfolio (Sample) Poramate (Tom) Pranayanuntana
a factor of (x − a) = (x − 0) = x, a term that contains a factor of (x − a)2
= (x − 0)2
= x2
,
a term that contains a factor of (y − b) = (y − 0) = y, a term that contains a factor
(y−b)2
= (y−0)2
= y2
and a term that contains a factor of (x−a)(y−b) = (x−0)(y−0) = xy.
Now, cos(y) ≈ 1−y2
/2 so by multiplying cos2
(y) ≈ 1−y2
and cos4
(y) ≈ 1−2y2
for all y near 0.
So our f(x, y) = x + cos4(y) ≈ (1−2y2
+x)1/2
≈ 1+(1/2)(−2y2
+x)+
(1/2)(1/2 − 1)
2!
(−2y2
+
x)2
≈ 1 + x/2 − x2
/8 − y2
= Q(x, y). Then I would draw and show the surface z =
x + cos4(y), its tangent plane z = L(x, y) and its quadratic approximation z = Q(x, y),
for all (x, y) near (0, 0).
Ex3. Find a quadratic approximation Q1(x, y) of f(x, y) = cos(x) cos(y) near (x, y) = (0, 0)
and Q2(x, y) near (x, y) = (π/2, π/2). Since cos(u) ≈ 1 − u2
/2, for all u near 0 and
sin(u) ≈ u, for all u near 0. We then have f(x, y) = cos(x) cos(y) ≈ (1 − x2
/2)(1 − y2
/2) ≈
1 − x2
/2 − y2
/2 = Q1(x, y), for all (x, y) near (0, 0). Also we have
f(x, y) = cos(x) cos(y)
= cos
π
2
+ (x −
π
2
) cos
π
2
+ (y −
π
2
)
= cos
π
2
cos(x −
π
2
) − sin
π
2
sin(x −
π
2
) cos
π
2
cos(y −
π
2
) − sin
π
2
sin(y −
π
2
)
= sin(x −
π
2
) sin(y −
π
2
)
≈ (x −
π
2
)(y −
π
2
) = Q2(x, y), for all (x, y) near (π/2, π/2)
Page 10 of 12
11. Teaching Portfolio (Sample) Poramate (Tom) Pranayanuntana
The graphs of the surface f(x, y) and its quadratic approximations Q1(x, y) around (0, 0)
and Q2(x, y) around (π/2, π/2) would emphasize the local behavior of f(x, y) near (0, 0) and
near (π/2, π/2) and this would be a good leading example toward the topic of local maxima,
local minima and saddle points.
Emphasizing understanding
not memorizing formulas is
the key of my teaching that
would lead to knowledge
retention. I have a common
mistake that many students
would always make when
memorizing formulas for
changing of coordinates in
the following flux integral
problem.
Ex4. Find the flux of vector field F =
4x
4y
0
through the surface S: part of a paraboloid
surface z = 16 − x2
− y2
with x2
+ y2
≤ 16 and oriented upward.
Flux of F through S =
S:r(x,y),(x,y)∈R
F dAS
=
R
F (rx × ry) dxdy
dAR
=
x=4
x=−4
y=
√
16−x2
y=−
√
16−x2
R
4x
4y
0
2x
2y
1
|J1| hidden here
dydx
dAR
=
x=4
x=−4
y=
√
16−x2
y=−
√
16−x2
R
8(x2
+ y2
) dydx
dAR
=
θ=2π
θ=0
r=4
r=0
T
8r2
r
|J2|
drdθ
dAT
= 8
r=4
r=0
r3
dr
·
θ=2π
θ=0
1 dθ
= 1024π,
Page 11 of 12
12. Teaching Portfolio (Sample) Poramate (Tom) Pranayanuntana
or if students parameterize directly with variables (r, θ) then they would get
Flux of F through S =
S:r(r,θ),(r,θ)∈T
F dAS
=
R
F (rr × rθ) drdθ
dAT
=
θ=2π
θ=0
r=4
r=0
T
4r cos θ
4r sin θ
0
2r cos θ
2r sin θ
1
r
|J|=|J1||J2| hidden here
drdθ
dAT
=
θ=2π
θ=0
r=4
r=0
T
8r2
r
|J2|
drdθ
dAT
= 8
r=4
r=0
r3
dr
·
θ=2π
θ=0
1 dθ
= 1024π.
The common mistake that students would make is plugging in an extra r with drdθ, because
they memorize that they also need an r for the jacobian without knowing that the jacobian
which including that r was already in the magnitude of rr × rθ =
2r cos θ
2r sin θ
1
r as follows:
Flux of F through S =
θ=2π
θ=0
r=4
r=0
T
4r cos θ
4r sin θ
0
2r cos θ
2r sin θ
1
r
|J|=|J1||J2| hidden here
r
extra r
because of misunderstanding
drdθ
dAT
=
θ=2π
θ=0
r=4
r=0
T
8r3
r
|J2|
drdθ
dAT
= 8
r=4
r=0
r4
dr
·
θ=2π
θ=0
1 dθ
=
16384
5
π,
which is incorrect. This is why encouraging students to try to understand the material of
topics studied is better than memorizing formulas and plug and play.
Page 12 of 12